Big Beat, Big Backlog, Big Caveats: Inside Super Micro’s 33% Upside Potential
Super Micro just posted its strongest quarter in years, yet shares barely moved. Understanding why the market shrugged reveals exactly what needs to go right before the bulls can claim victory.

This post may contain links from our sponsors and affiliates, and Flywheel Publishing may receive compensation for actions taken through them.

Super Micro Computer (NASDAQ:SMCI | SMCI Price Prediction) posted a 77.55% EPS beat on $11.12 billion in Q4 revenue, guided fiscal 2027 sales to $65 billion to $72 billion, and disclosed record backlog entering fiscal 2027. Shares closed essentially flat. That gap between fundamentals and price is where our model finds opportunity.
Our 24/7 Wall St. price target for Super Micro is $42.21, implying 33.58% upside over the next 12 months with a 90% confidence score. The recommendation is buy, though caveats around cash flow and the ongoing board review of export-control transactions keep this from being a slam dunk.
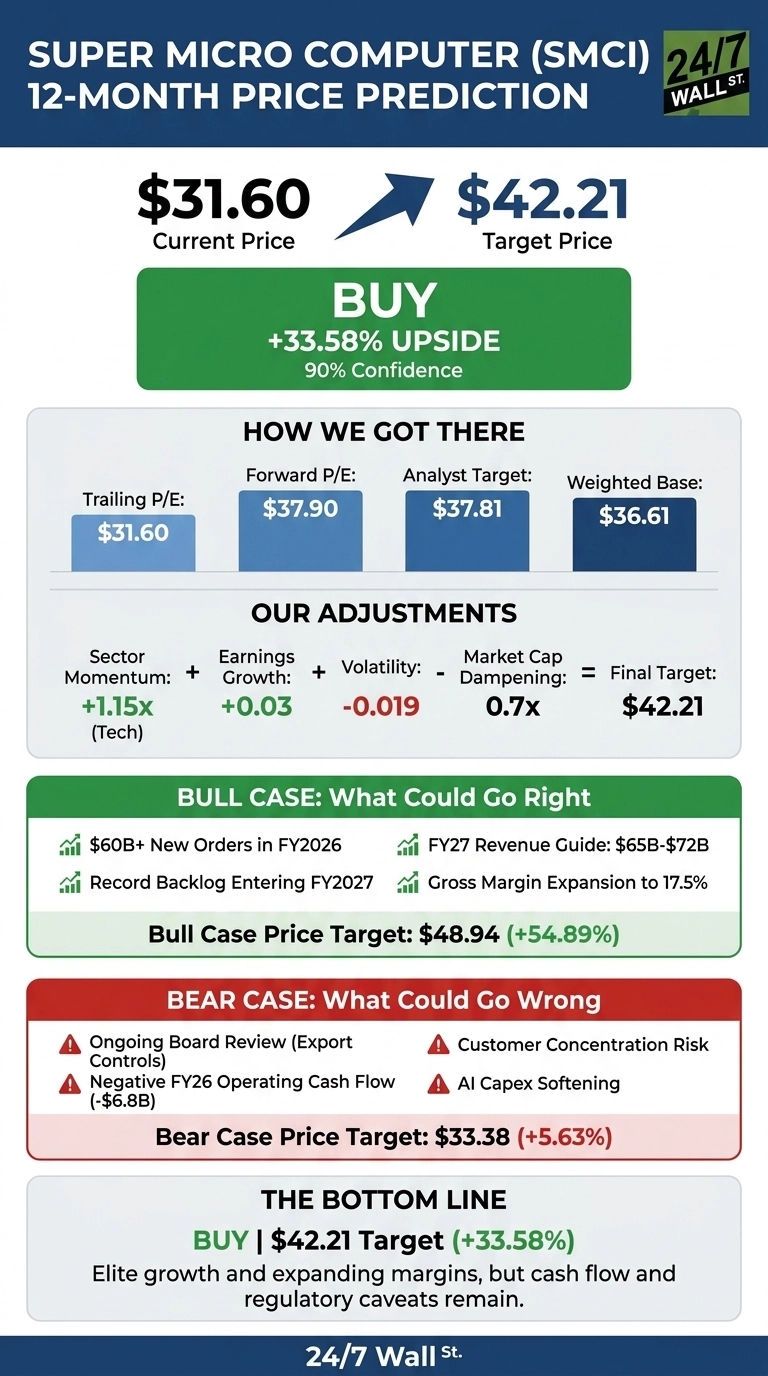
24/7 Wall St. Price Target Summary
| Metric | Value |
|---|---|
| Current Price | $31.60 |
| 24/7 Wall St. Price Target | $42.21 |
| Upside | 33.58% |
| Recommendation | BUY |
| Confidence Level | 90% |
A Muted Reaction to a Blockbuster Quarter
SMCI is down 30.09% over the past year but up 11.62% over the past month and 7.96% year to date. Shares sit 36% below the 52-week high of $58.78.
Q4 delivered revenue of $11.12 billion (+93.2% YoY), non-GAAP EPS of $1.70, and gross margin recovery to 17.5% from 9.5% a year ago. CEO Charles Liang credited “a richer enterprise customer mix and broader adoption of our optimized Data Center Building Block Solutions”. Full-year operating cash flow was negative $6.8 billion on working capital build.
Why Bulls See a Breakout Ahead
The bull case starts with $60 billion-plus in FY2026 new orders and Liang’s guidance for $65 billion to $72 billion in FY2027 revenue. If margins hold near the 17.5% Q4 level, non-GAAP EPS could push meaningfully above the $3.96 forward consensus.
Our bull-case scenario points to $48.94, a 54.89% total return. Analyst consensus target sits at $37.81, with 5 Buy or Strong Buy ratings currently on record.
The Risks Worth Watching
The bear case is real. The board is conducting an independent review of export-control transactions, results remain preliminary and unaudited, and insider activity leans toward selling.
The negative $6.8 billion in operating cash flow reflects an enormous working capital build to support backlog. If AI capex softens, that inventory becomes a problem. Our bear case lands at $33.38, roughly 5.63% above today.
How SMCI Compares to Dell and HPE
Dell Technologies (NYSE:DELL) trades at a forward P/E of 25 with 87.5% quarterly revenue growth and similar AI server exposure, but a far richer multiple.
Hewlett Packard Enterprise (NYSE:HPE) trades at a forward P/E of 12, cheaper than SMCI, but with just 40% revenue growth. SMCI’s forward P/E of 10 against 93% Q4 growth looks conservative next to Dell and reasonable against HPE.
| Company | Forward P/E | QoQ Rev Growth |
|---|---|---|
| SMCI | 10 | 93.2% |
| DELL | 25 | 87.5% |
| HPE | 12 | 40% |
Super Micro Price Prediction 2026-2030
Our 24/7 Wall St. price target of $42.21 and buy rating reflect a rare setup: elite growth, expanding margins, and valuation that discounts the caveats.
The constructive scenario firms up if Q1 FY2027 lands inside the $14.5 billion to $15.5 billion revenue guide and the export-control review closes without material impact. The setup weakens if operating cash flow does not normalize by the second half of fiscal 2027.
| Year | 24/7 Wall St. Price Target |
|---|---|
| 2026 | $42.21 |
| 2027 | $50.00 |
| 2028 | $58.50 |
| 2029 | $66.00 |
| 2030 | $71.83 |
These projections assume SMCI executes on its $65 billion-plus FY2027 pipeline and holds gross margins near current levels. Upside could come from sustained AI infrastructure demand; downside risk centers on customer concentration and regulatory overhang.
Contact [email protected] for any questions or corrections.
Vandita Jadeja is a financial publisher with over a decade of experience writing about financial topics, including investment, savings, retirement, insurance and banking. Vandita is a Chartered Accountant who loves to debunk financial concepts for readers.
Her work has appeared on sites that include The Motley Fool, InvestorPlace, and Benzinga. She covers investing and focuses on stock picks and price prediction for 24/7 Wall St.
When not looking for the next stock investment opportunity, she can be found traveling, reading, chasing sunsets and enjoying her iced latte.