Prediction: AT&T Could Have More Upside Than Its Dividend Suggests

This post may contain links from our sponsors and affiliates, and Flywheel Publishing may receive compensation for actions taken through them.
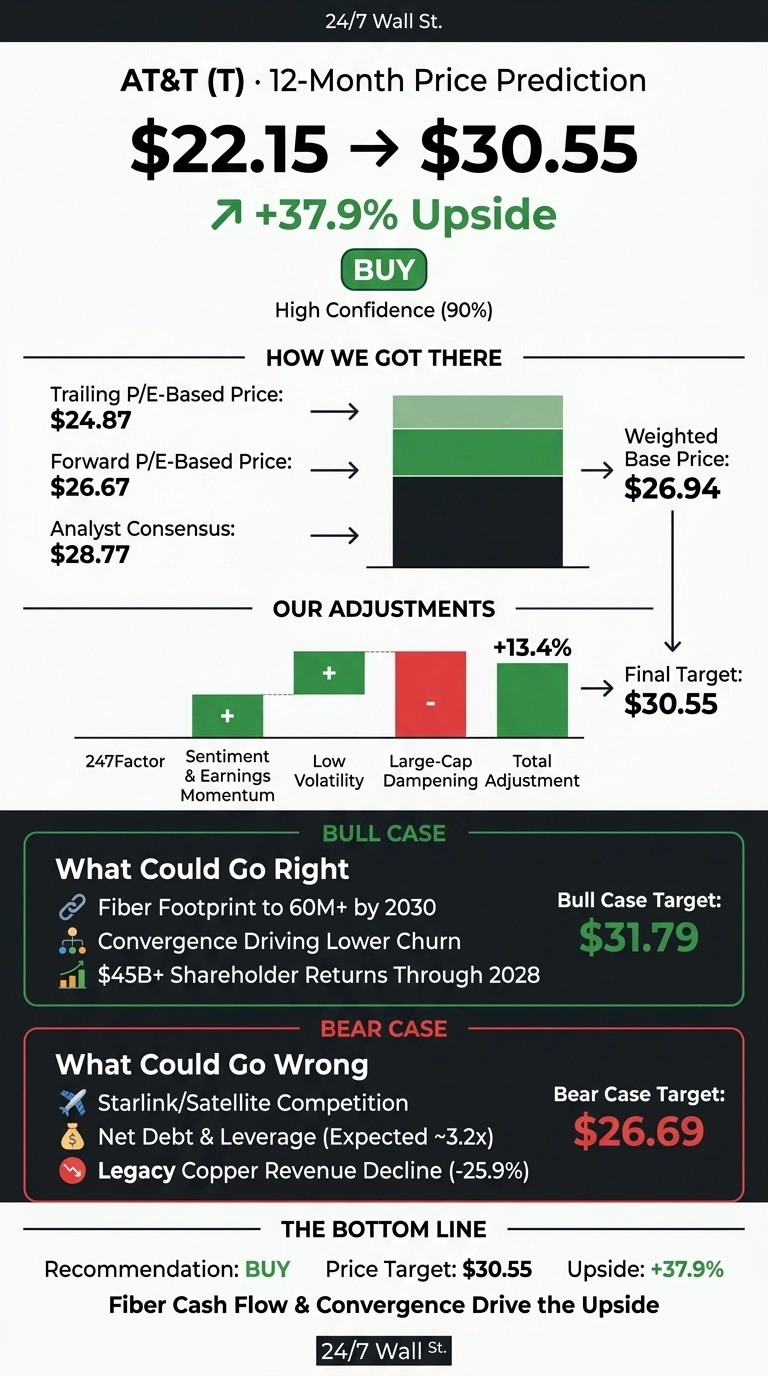
The 24/7 Wall St. price target for AT&T (NYSE:T | T Price Prediction) is $30.55 over the next 12 months. With shares at $22.15 midday Friday, that means 37.9% upside. AT&T earns a buy rating from the model with high confidence.
| Metric | Value |
|---|---|
| Current Price | $22.15 |
| Price Target from 24/7 Wall St. | $30.55 |
| Upside/Downside | 37.9% |
| Recommendation | BUY |
| Confidence Level | 90% |
The forward dividend of $1.11 yields about 5%. On free cash flow, management guides to $18B+ this year, rising to $21B+ in 2028, with buybacks at roughly $10B in 2026.

Starlink Spectrum Fears Knock AT&T to a Fresh Discount
Shares fell 9.95% in Friday’s session after SpaceX announced a spectrum deal for Starlink Mobile, which hit telecom stocks generally. AT&T is down 8.85% for the week, 13.48% for the month and 7.64% year to date. That leaves it 23% below its 52-week high of $28.75 and 12.8% above its low of $19.63.
Operations look much better than the share price. Q2 adjusted EPS of $0.65 beat the $0.5871 consensus. Revenue of $31.56B fell slightly short of the $31.81B estimate.
AT&T added 432,000 postpaid phones and on October 6 announced a new fiber joint venture with Global Infrastructure Partners and CPP Investments.
Why Bulls See $31.79 and Beyond
Fiber is the engine. AT&T covers 38.6M fiber locations and targets 60M+ by 2030. Consumer wireline broadband revenue rose 27.3%, and 42.5% of home internet customers also carry AT&T wireless. CEO John Stankey: “Where we have fiber, we win.”
Management guides to double-digit adjusted EPS growth over three years and $45B+ in shareholder returns. Analysts are mostly positive with 16 Buy or Strong Buy ratings and a $28.77 consensus target. An upside case covers $31.79, about 43.5% above the current price.

What Could Go Wrong for AT&T
Satellite-to-phone competition is now a live concern. Net debt stands at $144B, with leverage expected to rise to the 3.2 times range after the EchoStar (NASDAQ:SATS) spectrum purchase. Legacy copper revenue fell 25.9%, and interest expense rose 13.8%.
Capex rose 16.4% due to faster fiber deployment. The EchoStar and Lumen Technologies (NYSE:LUMN) deals are expected to add to earnings by 2028. Our bear case of $26.69 still is 20.5% above the current price.

How AT&T Compares to Verizon and T-Mobile
| Company | Forward P/E | Dividend Yield |
|---|---|---|
| AT&T | 9x | 5.0% |
| Verizon | 9x | 6.08% |
| T-Mobile | 12x | 2.46% |
Verizon (NYSE:VZ) competes head-to-head with AT&T in wireless and fiber. Its quarterly earnings fell 22% year over year, yet it trades at about the same multiple as AT&T, whose adjusted EPS beat expectations in Q2. That gap suggests AT&T deserves a premium.
T-Mobile (NASDAQ:TMUS) is the growth benchmark in wireless, with revenue up 7.9% year over year. At $30.55, AT&T would trade near 13x forward earnings, roughly in line with T-Mobile. Against both peers, our target looks reasonable.
AT&T Price Prediction 2026-2030
I’m sticking with our 24/7 Wall St. price target of $30.55, a buy rating and 90% confidence. The free cash flow path toward $21B+ tips the scale.
The bull case holds if fiber and wireless bundling keeps cutting churn. It weakens if Starlink cuts into AT&T’s wireless pricing or leverage remains above 2.5x. At about 9x earnings, the market is pricing in more disruption than AT&T’s results show.
Our model projects where AT&T could trade in the years ahead if current trends hold.
| Year | Price Target from 24/7 Wall St. |
|---|---|
| 2026 | $25.12 |
| 2027 | $30.55 |
| 2028 | $35.44 |
| 2029 | $39.32 |
| 2030 | $42.95 |
These estimates assume AT&T stays on track with fiber expansion and deleveraging. Satellite competition or delays in retiring copper lines could change these numbers.
Contact [email protected] for any questions or corrections.
Vandita Jadeja is a financial publisher with over a decade of experience writing about financial topics, including investment, savings, retirement, insurance and banking. Vandita is a Chartered Accountant who loves to debunk financial concepts for readers.
Her work has appeared on sites that include The Motley Fool, InvestorPlace, and Benzinga. She covers investing and focuses on stock picks and price prediction for 24/7 Wall St.
When not looking for the next stock investment opportunity, she can be found traveling, reading, chasing sunsets and enjoying her iced latte.