PepsiCo Has Raised Its Dividend 54 Straight Years, but $1,000 in Coca-Cola Finished $1,296 Ahead Over the Past Decade

This post may contain links from our sponsors and affiliates, and Flywheel Publishing may receive compensation for actions taken through them.
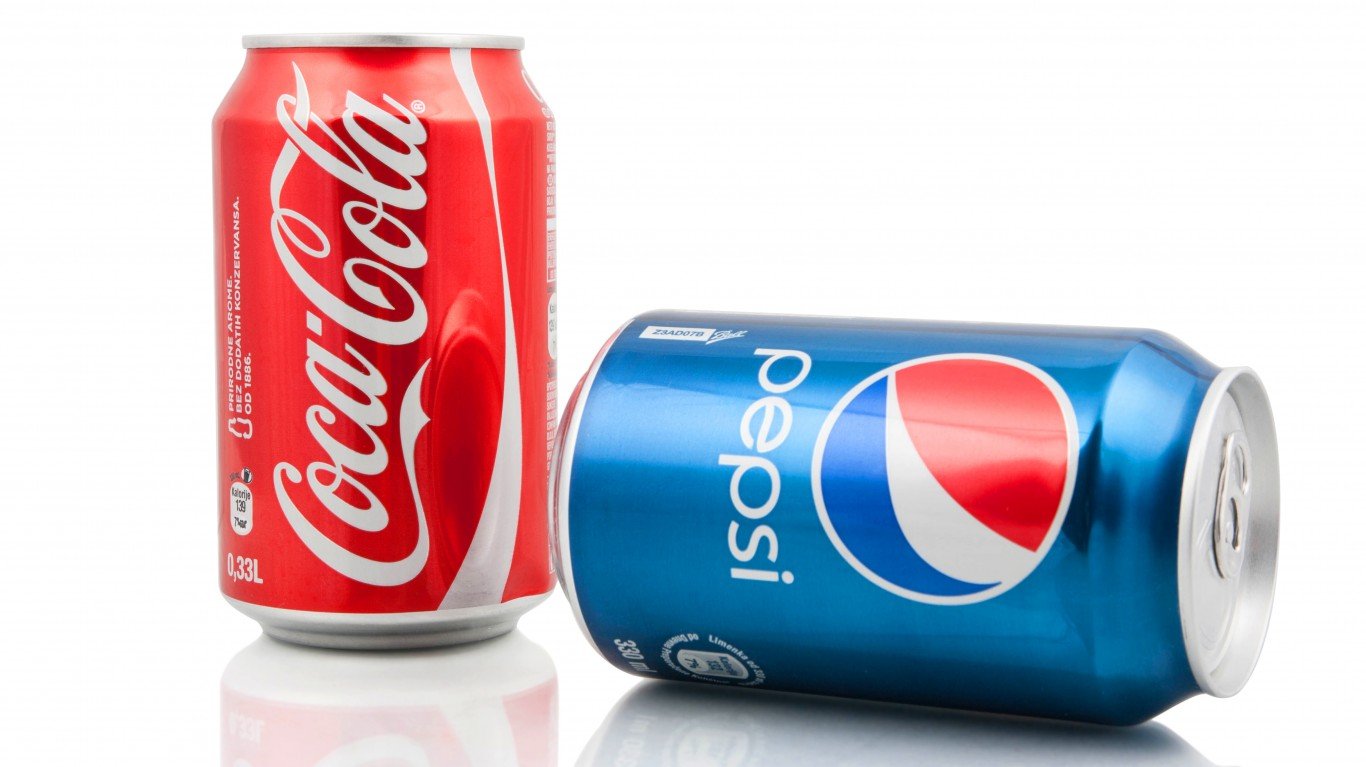
In the scenario, you had $1,000 invested in PepsiCo (NASDAQ:PEP | PEP Price Prediction) and Coca-Cola (NYSE:KO) at the Nov. 30, 2016 close, which would be worth today, with dividends reinvested. PepsiCo started at $100.10 a share and Coca-Cola at $40.35.
Two Dividend Kings With Very Different Decades
PepsiCo says 2026 marked its 54th consecutive annual dividend increase. Its quarterly payout rose from $1.4225 to $1.48, which works out to $5.92 a year. Coca-Cola raised its dividend for a 64th straight year, taking its quarterly payment from $0.51 to $0.53.
Coca-Cola sells only drinks, sells concentrate to bottling partners, and continues to sell off its own bottling operations, including a pending sale of its African bottlers. Its operating margin is 28.71%. PepsiCo also runs a large snack business and owns more of its bottling and distribution, with an operating margin of 12.24%. In the third quarter, core operating profit at PepsiCo Foods North America fell 12%, and PepsiCo cut its 2026 core EPS growth guidance to 2.5%-3.5%. Coca-Cola raised its outlook to at least 11%.


Coca-Cola Turned $1,000 Into $3,206
10-Year (dividends reinvested)
- PepsiCo: $1,910 (91% total, 6.7% annualized), or $1,412 on share price alone
- Coca-Cola: $3,206 (220.6% total, 12.4% annualized), or $2,371 on share price alone
- S&P 500 (price only, from Nov. 8, 2016): $3,434 (243.42%, 13.1% annualized)
5-Year (dividend-adjusted)
- PepsiCo: $1,001 (0.09%, 0.02% annualized)
- Coca-Cola: $1,949 (94.86%, 14.3% annualized)
- S&P 500 (price only): $1,569 (56.94%, 9.4% annualized)
1-Year (dividend-adjusted)
- PepsiCo: $1,039 (3.87%)
- Coca-Cola: $1,422 (42.23%)
- S&P 500 (price only): $1,097 (9.69%)


Over the decade, Coca-Cola ended up $1,296 ahead. Most of that gap opened in the last five years, when PepsiCo’s adjusted price barely moved, going from $141.22 to $141.34. Coca-Cola beat the S&P 500 over one and five years and trailed it slightly over ten. Our recent articles comparing Coca-Cola with Procter & Gamble (NYSE:PG) and tracking Coca-Cola since 1999 cover more of that history.
Yields, Valuations and Risks Heading Into 2027
PepsiCo yields 4.19% at a trailing P/E of about 17.8. Its $5.92 annual dividend represents roughly 74% of trailing earnings. Dividing its dividend yield by its earnings yield gives a payout ratio (the share of earnings paid out as dividends) of about 93%. Coca-Cola yields 2.22% at a trailing P/E of 28.1, putting its earnings payout ratio near 62%.
PepsiCo’s appeal rests on international growth (EMEA and Asia Pacific each grew 9% organically) and on planned structural cost cuts. One risk is that rising input costs squeeze profits while the payout ratio is near 93%. Coca-Cola’s appeal rests on volume growth and wider margins. Its risk is valuation, with the stock trading at roughly 29 times trailing free cash flow. Returns over the next ten years may differ from those of the last ten.
PepsiCo has raised its payout every year through a range of economic conditions. Over this decade, its total return was lower than Coca-Cola’s.
Contact [email protected] for any questions or corrections.
David Beren has been a Flywheel Publishing contributor since 2022. Writing for 24/7 Wall St. since 2023, David loves to write about topics of all shapes and sizes. As a technology expert, David focuses heavily on consumer electronics brands, automobiles, and general technology. He has previously written for LifeWire, formerly About.com. As a part-time freelance writer, David’s “day job” has been working on and leading social media for multiple Fortune 100 brands. David loves the flexibility of this field and its ability to reach customers exactly where they like to spend their time. Additionally, David previously published his own blog, TmoNews.com, which reached 3 million readers in its first year. In addition to freelance and social media work, David loves to spend time with his family and children and relive the glory days of video game consoles by playing any retro game console he can get his hands on.