Texas Instruments Is Up More Than 60% This Year, and $1,000 From a Decade Ago Is Now Worth More Than $5,000

This post may contain links from our sponsors and affiliates, and Flywheel Publishing may receive compensation for actions taken through them.

Texas Instruments (NASDAQ:TXN | TXN Price Prediction) is widely and likely best known for its graphing calculators, but most of its revenue comes from chips. The stock closed at $303.60 on Nov. 13, 2026, up 78.85% from the $169.75 close on Dec. 31, 2025. Below is what drove that move and what $1,000 would be worth today over one, five, and ten years.
Calculator Maker Turned Supplier of Chips Inside Everything
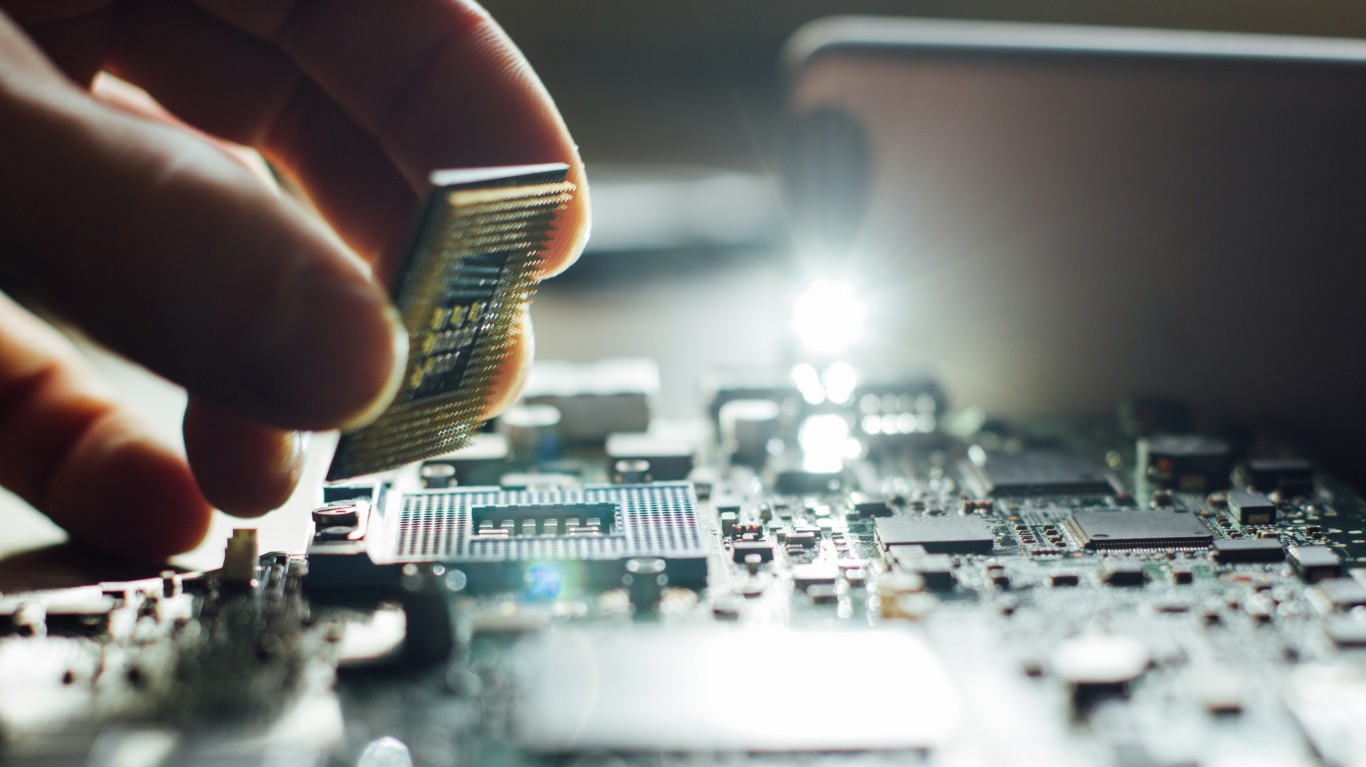
TI mainly sells analog chips that manage power and convert real-world signals like temperature or sound into data electronics can use. It also sells embedded processors, which are small chips that run cars, factory equipment, and appliances. In recent years, it has spent heavily on U.S. plants that make chips on 300mm wafers. Those larger wafers produce more chips at a lower cost per unit, and CHIPS Act incentives covered part of the bill. Capital spending reached $4.55B in 2025.
That spending weighed on profits for a while. Q4 2025 EPS of $1.27[1] missed the $1.31 consensus. Demand later increased. On Oct. 21, 2026[2], TI reported Q3 revenue of $6.05B[2], up 27.7%, and EPS of $2.62, ahead of estimates. Data center revenue rose about 95%,[3] and industrial revenue rose more than 40%. Quarterly capex dropped to $463M[2]. TI also has a pending acquisition of Silicon Labs (NASDAQ:SLAB) to expand its wireless connectivity and embedded chip lineup.

A Decade That Turned $1,000 Into $5,384
1-Year Return (share price)
- Initial Investment: $1,000
- Current Value: $1,871
- Total Return: 87.14%
- S&P 500 (same period): $1,122.50 (12.25%)
5-Year Return (share price)
- Initial Investment: $1,000
- Current Value: $1,597
- Total Return: 59.72%
- Annualized Return: 9.82%
- S&P 500 (same period): $1,614.40 (61.44%)
10-Year Return (from Nov. 30, 2016, dividends reinvested)
- Initial Investment: $1,000
- Current Value: $5,384 ($4,107 on share price alone)
- Total Return: 438.4%
- Annualized Return: about 18.33%
- S&P 500 (price only): $3,456 (245.6%)
The five-year result about matched the index, during years when TI spent heavily on building plants. Most of the gain came in the last year. The stock’s 52-week range runs from $149.47 to $330.71. The gap between the two ten-year figures comes from dividends. TI raised its quarterly payout 7% to $1.52[3], its 23rd consecutive year of increases, putting the yield at 2.o0%.

Valuation at 39 Times Trailing Earnings and What Analysts Expect
The stock trades at about 39 times trailing earnings and 27 times forward earnings. Analyst ratings include 18 buys, 13 holds and 2 sells, with an average target of $338.79.

The outlook for Texas Instruments depends partly on whether data center and industrial demand keep growing and whether the new plants continue to support margins. Q4 guidance calls for revenue of $5.80B-$6.30B[2]. A turn in the chip cycle is a risk, since analog demand has declined in past cycles. Plant spending also stays heavy, with TI aiming for $2 billion to $3 billion[3] in 2026 capex, and debt stands at $13.65 billion.

The stock has risen sharply over the past year as results recovered. Over the past decade, the stock has outpaced the S&P 500’s price return.
Contact [email protected] for any questions or corrections.
David Beren has been a Flywheel Publishing contributor since 2022. Writing for 24/7 Wall St. since 2023, David loves to write about topics of all shapes and sizes. As a technology expert, David focuses heavily on consumer electronics brands, automobiles, and general technology. He has previously written for LifeWire, formerly About.com. As a part-time freelance writer, David’s “day job” has been working on and leading social media for multiple Fortune 100 brands. David loves the flexibility of this field and its ability to reach customers exactly where they like to spend their time. Additionally, David previously published his own blog, TmoNews.com, which reached 3 million readers in its first year. In addition to freelance and social media work, David loves to spend time with his family and children and relive the glory days of video game consoles by playing any retro game console he can get his hands on.