XRP Analysis: XRP Lost 16% in October. What Did It Do in November the Last 5 Years?
XRP just closed one of its worst Octobers in recent memory, but history reveals that the following month can swing wildly in either direction, and the difference between those outcomes often comes down to a single unexpected event.

This post may contain links from our sponsors and affiliates, and Flywheel Publishing may receive compensation for actions taken through them.

XRP (CRYPTO:XRP) remains the fifth-largest cryptocurrency by market cap, but October 2026 proved tough for its holders. By the end of October, XRP was trading at $1.25, a decline of 15.9% from the start of the month, a drop many round off to a 16% loss. With Wall Street now involved through spot ETFs, investors felt the heat in both their brokerage accounts and crypto wallets.
However, one disappointing October doesn’t reveal much about what might happen in the next 30 days. Over the past five years, XRP’s November performance has been quite variable, ranging from an impressive 281.3% rise to a significant 13.9% decline, and a recent piece mapped out how low XRP could go in November. So does a weak October usually signal a weak November for XRP?
XRP Has Struggled in 3 of the Last 5 Novembers
XRP finished November lower in three out of the last five years, making a declining November more common than an upturn for the token. The average November gain stands at 49.3%, but this figure largely reflects one exceptionally strong month. Without the remarkable November of 2024, the other four Novembers generated returns ranging from a slight 1% gain to a substantial 13.9% loss.
| Year | XRP October Return | XRP November Return |
|---|---|---|
| 2021 | +17% | -10.6% |
| 2022 | -3.4% | -11.5% |
| 2023 | +16.5% | +1% |
| 2024 | -16.9% | +281.3% |
| 2025 | -11.9% | -13.9% |
The median result for November, the middle ground when ranking all five years, occurred in 2021 with a 10.6% loss. This median figure highlights a trend of XRP holders typically losing money in November.
October also provides mixed signals. XRP declined in October 2022, 2024, and 2025, and in two of those months losses continued into November, though the first downturn preceded the massive 281.3% surge the following year. In the two instances when October ended positively, in 2021 and 2023, November saw losses of 10.6% and a minimal gain of 1%.
Trump’s 2024 Victory Propelled XRP Upward by 281.3% in November
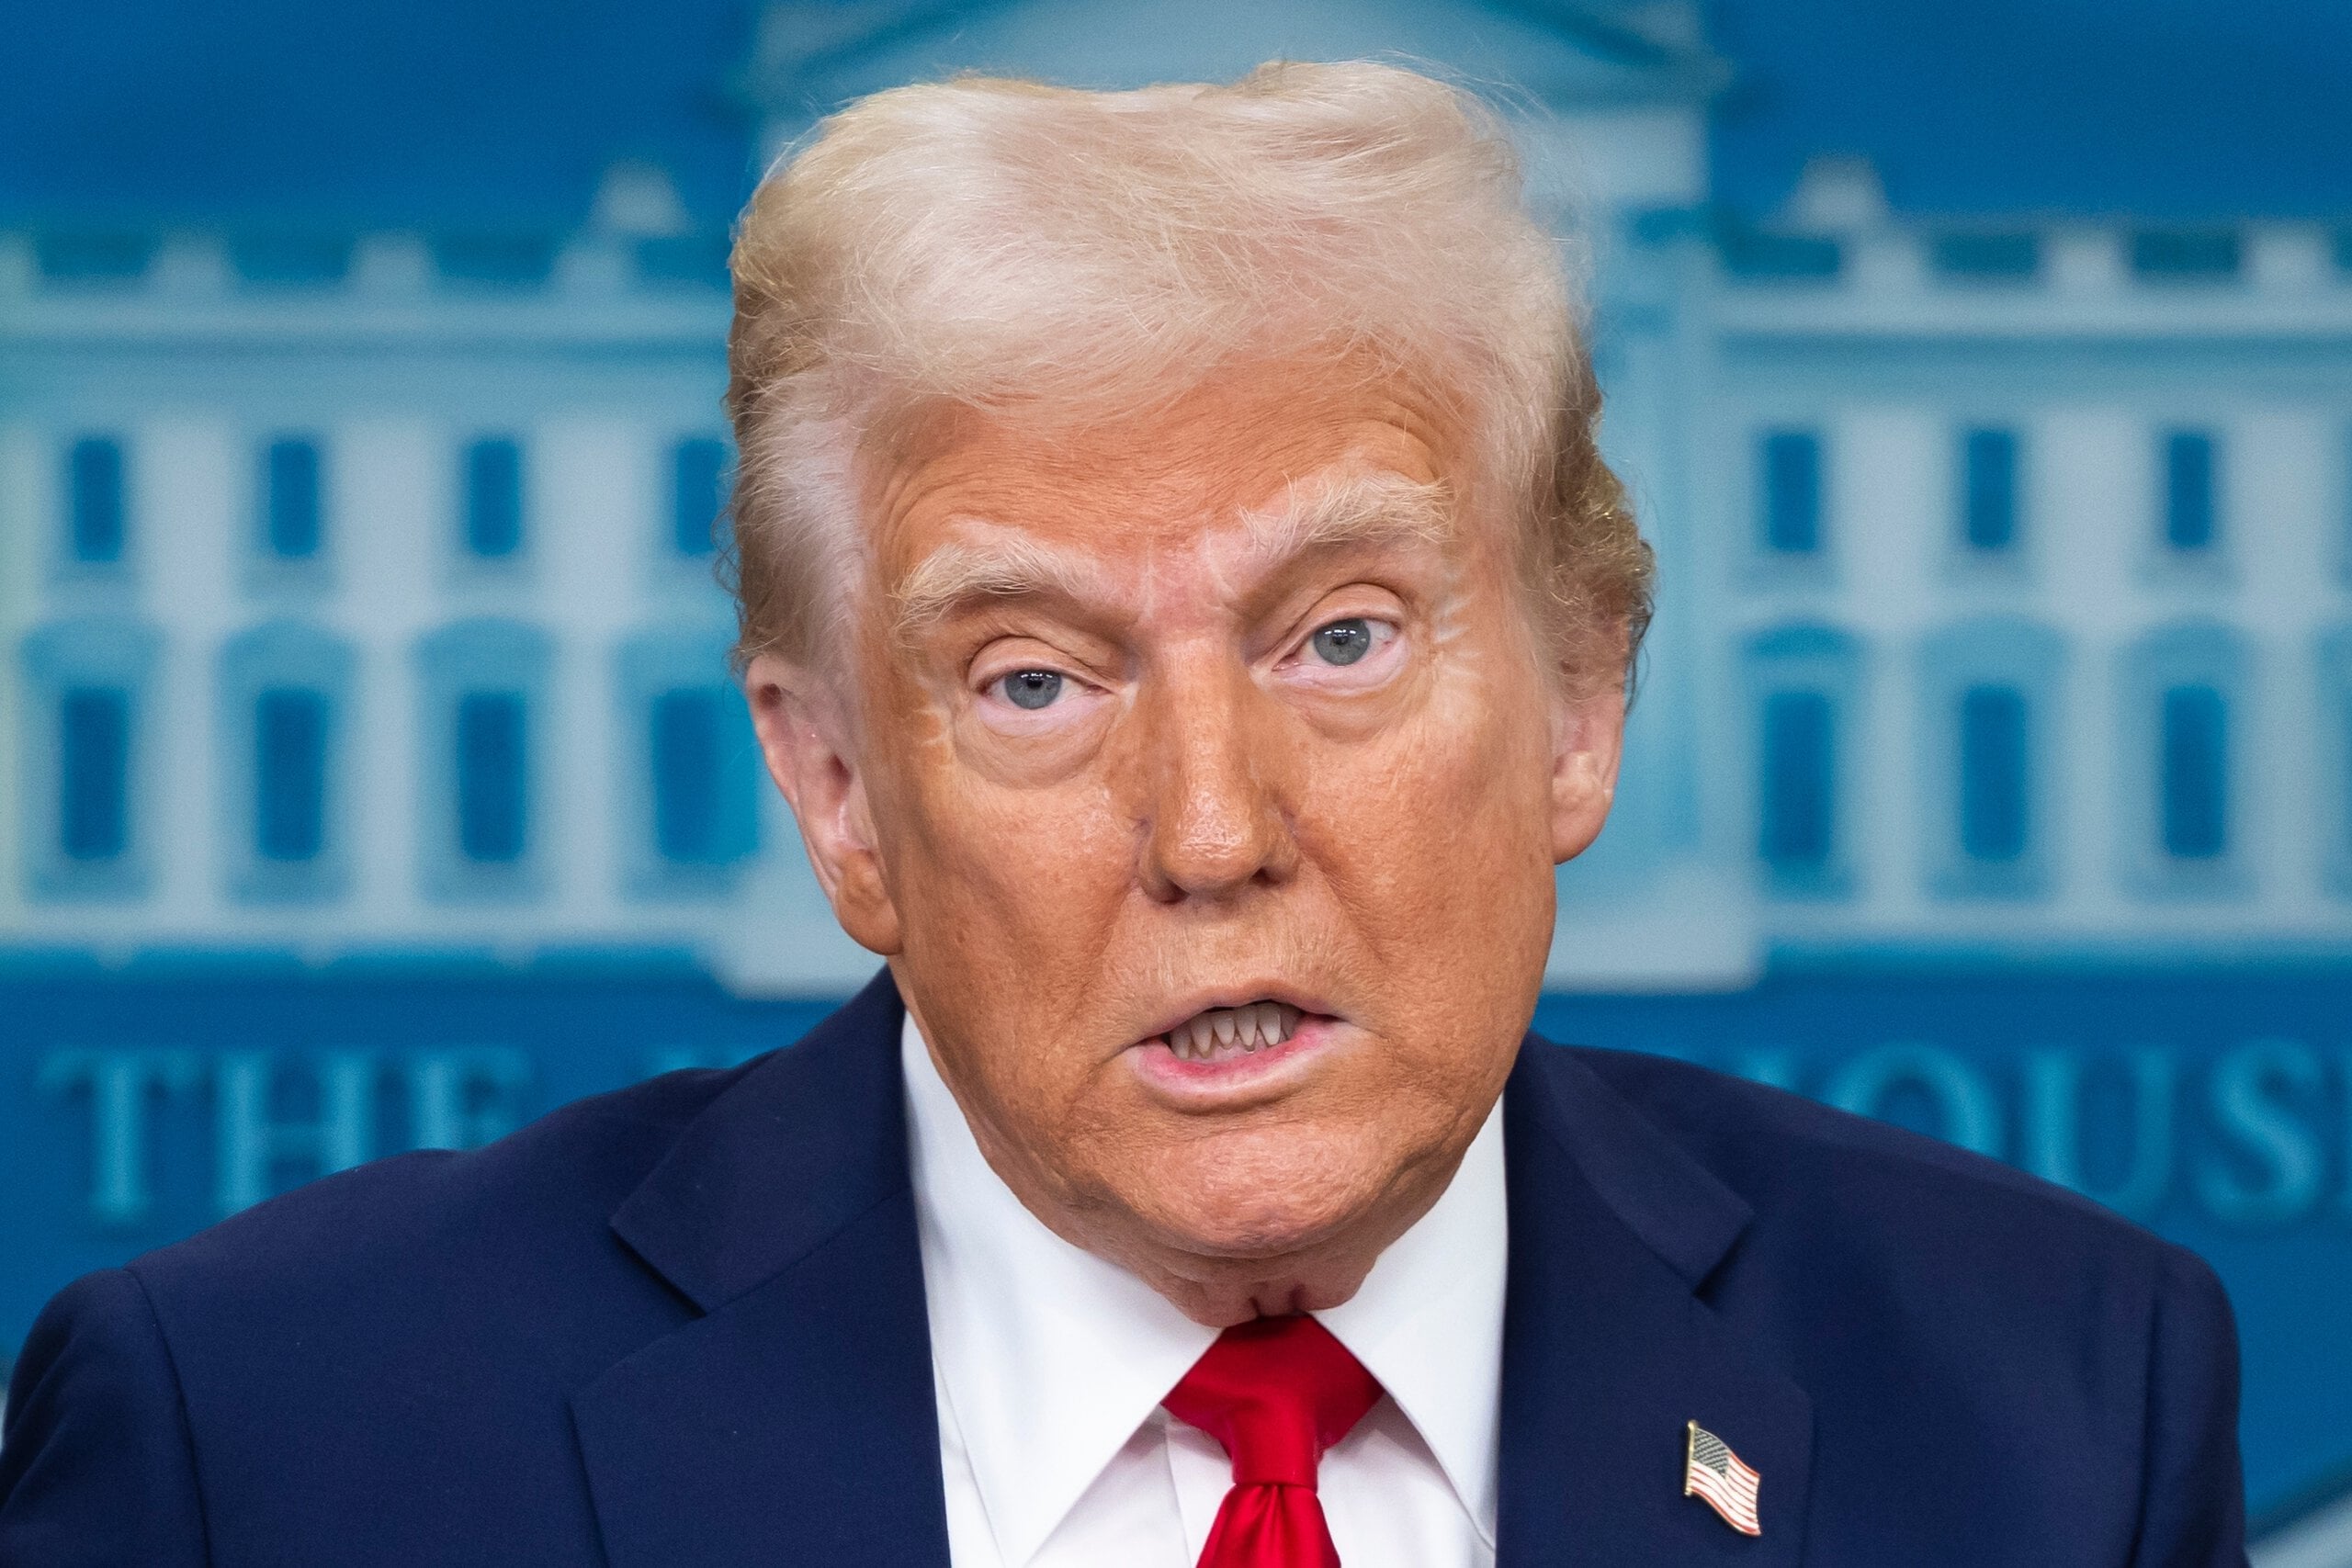
The only dramatic surge in November was tied to a specific trigger, the 2024 U.S. presidential election. Before the results were in, XRP was trading between $0.50 and $0.60. Donald Trump’s victory then convinced many traders to expect a more supportive stance from Washington toward cryptocurrencies. Influential voices in crypto, like Anthony Pompliano, noted that significant crypto backing had played a crucial role in the 2024 election cycle.
On November 21, 2024, then-SEC Chair Gary Gensler’s resignation announcement lifted a major legal cloud hanging over Ripple, the company behind XRP. As a result, XRP jumped from an October 2024 closing price of $0.5104 to a November 2024 close of $1.9379.
November 2026 brings another political event, the U.S. midterm elections on November 3. Historically, midterms have less impact on crypto policy than presidential elections, so a repeat of the 2024 spike looks unlikely.
XRP’s November Price Targets and the Levels to Watch
Starting at $1.25, a typical November performance could push XRP up to around $1.87. If November turns out to be as bad as its worst historical result, the price could drop to about $1.08. The median historical performance falls closer to the lower figure.
Currently, XRP is testing first support at $1.253. If it falls below its October 2026 low of $1.1975, traders could watch the worst-case November figure near $1.08.
On the upside, the 20-day moving average at $1.3164 serves as preliminary resistance. If XRP can break through that level, the next hurdle could be the week’s high of $1.3431 from this week’s close. A continued climb could then test the 50-day average at $1.3945 and the 30-day high of $1.555.
Currently valued at $79.44 billion, XRP trades about 65.8% below its all-time high of $3.65 from July 17, 2025, and is down 31.7% throughout 2026. Despite the price decline, XRP ETFs kept taking in money. The Bitwise XRP ETF (NYSEARCA:XRP) drew in $4.3 million in the week ending October 31, 2026, bringing total holdings to approximately $1.42 billion.
XRP’s November History Suggests Caution, with One Major Exception
XRP’s historical performance in November leans toward the downside, with three of five years ending in losses and only one notable, election-driven spike. For November 2026 to break this trend, XRP needs a daily close back above the 20-day average at $1.3164, followed by a move above the 50-day average at $1.3945.
XRP starts November 2026 nearly 50% lower than a year ago, so many sellers have likely already exited. If the token can hold above $1.1975 and reclaim $1.3164, it could break from its typical red November. A drop below $1.1975 could set XRP up for another disappointing month. Will XRP’s November history repeat in 2026, or will the token finally defy expectations?
Contact [email protected] for any questions or corrections.
Sam Daodu is a crypto analyst and the editor of 24/7 Wall St.'s Crypto Desk, where he covers Bitcoin, XRP, Ethereum, Solana and the altcoins investors search for most. His work focuses on price levels, spot ETF flows, on-chain data and the regulatory decisions that move crypto markets, written so a first-time buyer and a seasoned trader can both use it.
Sam has written about crypto professionally since 2019 and has published more than 2,000 articles. Before joining 24/7 Wall St., he wrote for crypto media outlets and Web3 companies and ghostwrote for crypto founders and token launches. His analysis is syndicated on Yahoo Finance, MSN and AOL and has been cited by other crypto news sites. He also founded MacLabs Marketing, a content and personal branding agency for crypto founders and executives.
When he isn't reading charts, Sam is usually at the gym or watching One Piece, a series he maintains has better tokenomics than most altcoins.