What If You’d Bought Vanguard’s Growth ETF at the Worst Possible Moment?
Buying a growth ETF at the absolute peak of a historic bubble sounds like a guaranteed disaster, yet some of the worst possible entry points in VUG's history still managed to outrun the S&P 500. The answer depends entirely on…

This post may contain links from our sponsors and affiliates, and Flywheel Publishing may receive compensation for actions taken through them.

A buyer who put $10,000 into Vanguard Morningstar Growth ETF (NYSEARCA:VUG) on Oct 31, 2007, watched VUG lose 51%. That investment is worth $100,122 today.
Buy-and-hold advice assumes you bought at a reasonable price. VUG’s worst purchase dates are a harder test, so each one here is measured in total return against the SPDR S&P 500 ETF Trust (NYSEARCA:SPY).
VUG charges 0.03% a year, closed at almost $92, and its ETF share class holds $233 billion. It now tracks the Morningstar US Large Cap Growth Index, which is the old CRSP index under a new name, and its objective and management are unchanged.
Buying at the 2007 Top Still Produced a Six-Figure Stake
The 2007 buyer rode VUG down 51% to the Mar 9, 2009 bottom. Breaking even took until Feb 8, 2011, a wait of 1,196 days.
SPY fell 55% from its own Oct 9, 2007 peak. It did not recover until Aug 16, 2012.
Today, the VUG investment is worth $100,122, a rate of 13% a year, compared with $71,189 in SPY at 11%. The fund that looked riskier fell about as far, recovered sooner, and finished far ahead.
VUG’s total-return high came on Nov 19, 2021. The fund fell 36% to Nov 3, 2022, and needed 795 days to get back to that peak.
SPY fell 25% in the same bear market. Rising rates hit expensive growth stocks hardest, and VUG holds little else.
A VUG investment bought at that peak is now $17,350, or 12% a year, against $17,742 in SPY at 12%. Of all the entry points tested, this is the only one where the VUG buyer still trails the S&P 500.
A Fast Crash Cost Almost Nothing While a Slow One Cost Years
VUG peaked on Feb 19, 2025, then fell 23% by Apr 8, 2025, during the tariff drop. It recovered in 125 days.
That buyer now holds $12,959 against $12,944 in SPY, which is effectively a tie.
Longer holding periods also favor VUG. It beat SPY in all 154 rolling ten-year windows starting at a month-end since 2004.
Its smallest win ran from Dec 31, 2012 to Dec 30, 2022, by roughly $1,000. The margin was thin only because that window ended in the middle of a bear market for growth stocks.
Carry the same purchase forward to today. That buyer holds $87,743 in VUG against $68,972 in SPY.
Dot-Com Buyers Waited More Than a Decade to Break Even
The worst moment in this fund’s history came before the ETF existed. VUG is a share class of the Vanguard Growth Index Fund, whose Investor Shares fell 56% from Mar 27, 2000 to Jul 23, 2002.
The break-even point came on Sep 13, 2012, roughly 12.5 years after the purchase. A decade in, the investment was worth $7,349, while Vanguard’s S&P 500 index fund held $9,111.
After two decades, the growth fund still fell behind, at $22,874 against $24,075. Today it holds $84,158, slightly ahead of $80,653.
Those Investor Shares tracked different growth indexes during that stretch and charged more than the ETF. For anyone drawing income, waiting that long matters more than how far the fund fell, because withdrawals during a slow recovery lock in losses.
Who Can Stomach VUG’s Deep Drawdowns
VUG best suits investors with at least a decade ahead of them. They should be able to sit through a drop like the financial crisis’s 51% decline without selling.
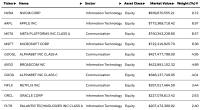
Concentration helps explain why declines run so deep. The fund’s largest positions are NVIDIA (NASDAQ:NVDA | NVDA Price Prediction) at 14%, Apple (NASDAQ:AAPL) at 12% and Microsoft (NASDAQ:MSFT) at 10%, making up 36% of the fund. That concentration makes a deep fall more likely but does nothing to speed up recovery, which depends on those companies continuing to grow earnings.
Investors near retirement, or those who know they would sell in a crash, may want to research SPY’s smaller loss history. It fell 25% in the last bear market against VUG’s 36%, and investors who bought it at the late-2021 top are ahead today. Buying every month also changes these results, because shares bought during a loss cost less and bring the break-even date closer.
Contact [email protected] for any questions or corrections.
Omor Ibne Ehsan is a writer at 24/7 Wall St. He is a self-taught investor with a focus on growth, cyclical, and dividend equities that have strong fundamentals, value, and long-term potential. He also has an interest in high-risk, high-reward investments such as penny stocks.