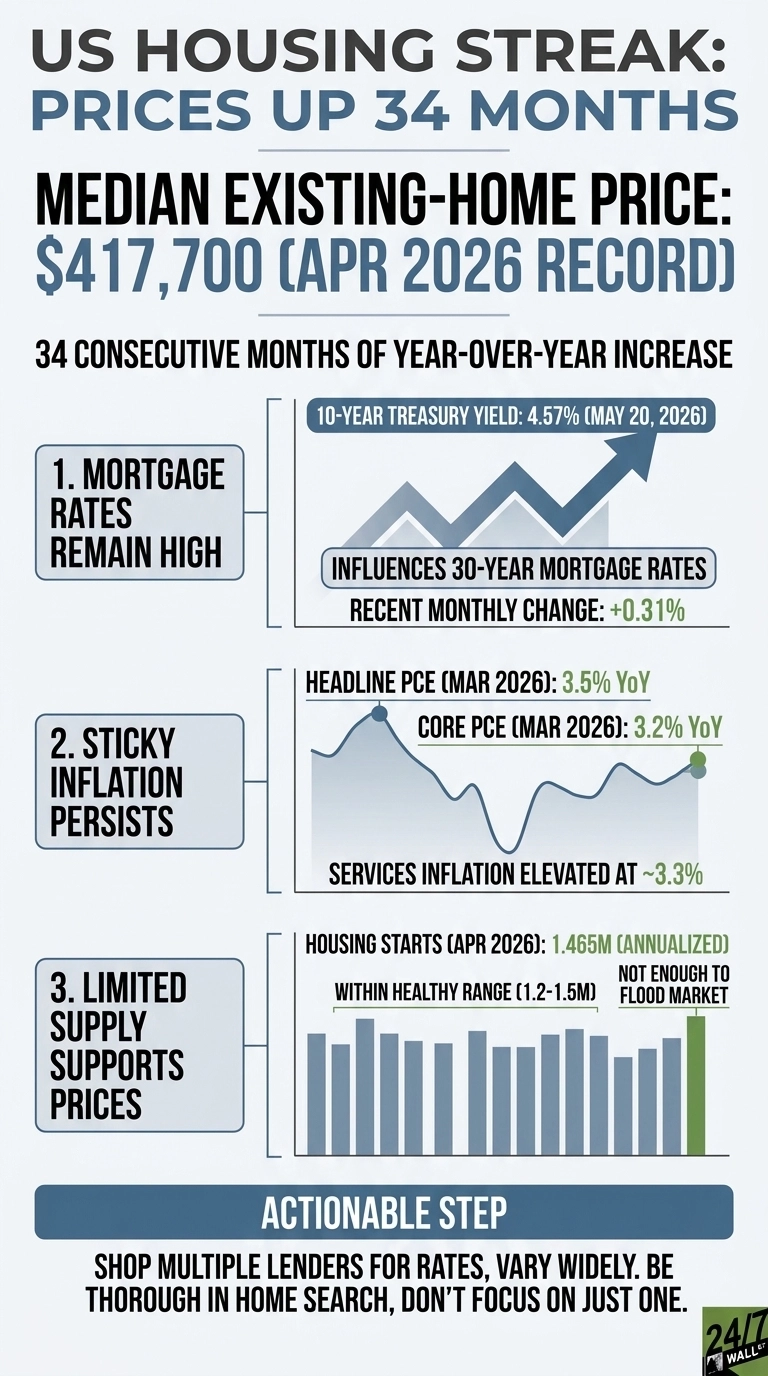
The National Association of Realtors’ April 2026 existing-home sales report delivered the same fundamental message it has broadcast nearly every month for three straight years. The national median existing-home sales price ticked up to $417,700, establishing an all-time record for April and marking the 34th consecutive month of year-over-year price appreciation. Prospective buyers who completely stepped aside back in 2023, waiting for a broad market correction, have instead watched annualized baseline valuations climb during every subsequent cycle.
This persistent streak began in mid-2023, meaning anyone who resolved to wait out the real estate market when 30-year mortgage borrowing rates first breached 7% has watched the median entry cost escalate amid shifting federal policy adjustments, warnings of a macroeconomic recession, and repeated headlines about widespread buyer fatigue. The April print represents a modest 0.9% increase over the previous year’s median of $414,000. That annual adjustment appears quite incremental on its own, but it remains layered directly atop 33 consecutive months of historical gains.
Compounded over time, this relentless pricing trajectory is precisely what has pushed a traditional single-family home far beyond the financial reach of the average American household.
The Correction That Never Showed Up
The conditions buyers expected to break the market did arrive, as existing-home sales ran at a 4.02 million annualized pace in April, well below the 5 million-plus volume of the pre-pandemic norm. Inventory reached 4.4 months of supply, the highest reading in years and approaching the six-month threshold that traditionally separates a seller’s market from a balanced one. Consumer sentiment, measured by the University of Michigan index, fell to 49.8 in April, the lowest reading in the 12-month tracking period and within striking distance of recessionary territory.
None of those forces broke the price line, the reason is supply. Housing starts ran at 1.465 million annualized units in April, inside the 1.2 to 1.5 million “healthy” range but not the kind of building boom that would dent prices. The 12-month average is 1,365 thousand units, which means builders are producing enough to stabilize the market, not enough to flood it.
Mortgage Rates Have Not Fallen
The primary macro element that completely sidelined prospective homebuyers was the unfulfilled promise of lower borrowing costs. The Federal Reserve aggressively adjusted policy. The absolute upper bound of the fed funds target rate is 3.75%, down from 5.00% one year ago. Mortgage markets simply refused to cooperate. The benchmark 10-year Treasury yield, which establishes the absolute pricing floor beneath standard 30-year residential mortgage commitments, closed at 4.57% on May 20, up 0.31% over the trailing month and positioned at the 98.4th percentile of its 12-month historical range.
The fundamental reason long-term interest rates are failing to contract is localized signs that consumer price inflation has reaccelerated. Headline year-over-year PCE advanced to 3.4% in March, climbing from its previous baseline, while core PCE metrics remained stubbornly stuck at 3.2%. The broader CPI expanded 0.5% during a single month to print a nominal index level of 332.4. The Federal Reserve has maintained its 3.75% terminal policy rate for over five straight months, primarily because sticky services inflation stubbornly refuses to break decisively lower. Consequently, long-term commercial mortgage rates remain firmly anchored exactly where they sit.
Wages Closed Some Of The Gap, Not Enough
Average hourly earnings reached $37.41 in April, up from $36.12 a year earlier and $34.76 two years ago. Per capita disposable income climbed to $68,617 in Q1 2026 from $66,095 a year prior. The personal savings rate dropped to 4% from 5.2% in Q1 2025, meaning the wage gains are largely being absorbed by current spending rather than down-payment savings.
At April’s median price of $417,700, a full-time worker earning the average hourly wage produces an annual gross of roughly $77,813. That puts the typical home at 5.4 times the average full-time wage, before mortgage insurance, taxes, or insurance premiums. The historical affordability benchmark sits closer to three times income.
What The Streak Documents
Month 35 is not guaranteed to look like the prior 34. Across the 34-month run, the combination of buyers waiting for lower rates, falling prices, and rising supply has not materialized. Rates fell at the front of the curve and rose at the long end. Supply expanded modestly, and prices rose anyway. Sentiment collapsed, and the median kept climbing.
The structural picture for someone still on the sidelines is clear. The market did not crash because supply never reached levels that would have triggered one, and wage growth, while real, has not closed the affordability gap created by the post-2020 price surge. Waiting has cost roughly 0.9% over the past year on top of larger gains in prior years. Whether that pattern continues depends on the building.
Contact [email protected] for any questions or corrections.