In order to thrive, cities must find ways to attract new businesses and new workers. The jury is still out on the best way to attract workers, and even on which workers cities should be attracting.
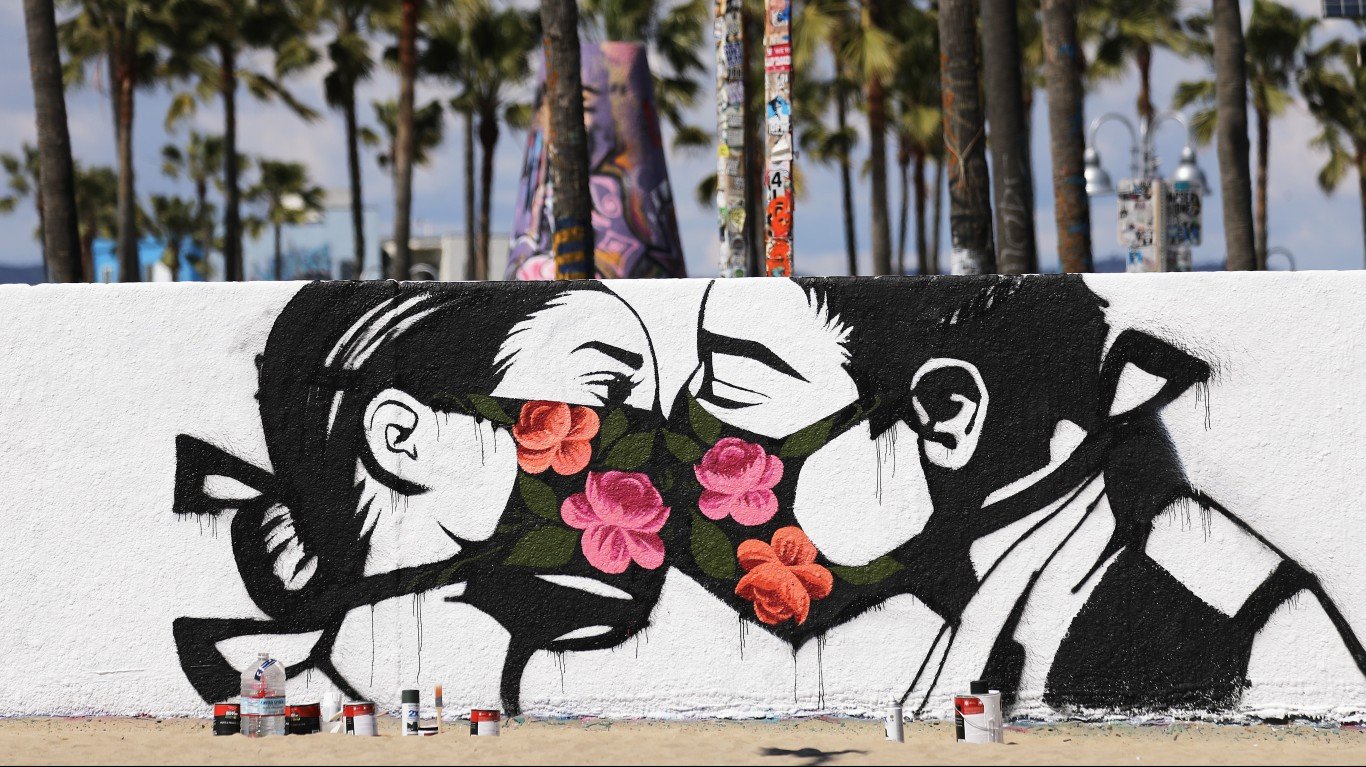
Some argue that in order for cities be able to build a successful, thriving economy, they need to attract a diverse array of workers, from technically proficient employees to those who are engaged in creative work. This wide range of workers includes people in the arts — music, theater, visual arts, etc. — as well as those engaged in technological development, such as engineers, programmers, and more.
These two groups — those involved with the arts and those working in technical product development — are of course very different, but they actually share many similarities. And according to some experts, it is the existence of both creative groups that makes a city thrive.
24/7 Wall St. conducted an analysis of Bureau of Labor Statistics employment data, using 2017 employment by occupation based on standard occupation codes. We ranked metropolitan areas that had the largest number of workers employed in jobs that could be considered creative per capita.
The list of cities includes many that the layperson would expect to see: tech strongholds like San Jose and cities with rich art scenes such as Portland, Oregon. The vast majority of these cities tend to represent a strong mix of both the arts and technological innovation.
The importance of cities developing a creative class was popularized by urban studies theorist Richard Florida in his book, “The Rise of the Creative Class.” Florida argued that a large base of highly-skilled, creative workers would thrive, and, importantly, choose to continue living in a city that has arts and other cultural attractions. An analysis of Yelp! data shows that most of the cities on this list contain a high share of cultural venues such as theaters, galleries, and museums. In general, the cities with the largest creative classes have the largest number of these cultural venues per capita.
Innovation in business is a key component of economic growth, and one way to measure the success of a large creative workforce is with patent grants. In general, the metropolitan areas on this list also have among the highest rates of patent recipiency over the past decade. San Jose, which ranks first on our list, has the most total patents awarded between 2000 and 2015. The vast majority of the metropolitan areas on this list are among the 30 largest patent recipients out of over 380 U.S. metropolitan areas.
| Metro area | Creative jobs/ 1,000 pop. | Adults w/ Bachelor’s deg. | Rank | Patents granted, 2000-2015 | Rank |
|---|---|---|---|---|---|
| United States | 1.50 | 32.0% | . | .. | .. |
| New York, New York | 1.83 | 39.6% | 39 | 92577 | 2 |
| Rochester, New York | 1.84 | 34.1% | 93 | 20239 | 19 |
| Kansas City, Missouri | 1.85 | 36.5% | 66 | 7952 | 36 |
| Baltimore, Maryland | 1.87 | 39.5% | 40 | 10574 | 28 |
| Milwaukee, Wisconsin | 1.95 | 35.8% | 72 | 8988 | 33 |
| Madison, Wisconsin | 1.95 | 45.9% | 18 | 5187 | 56 |
| Palm Bay, Florida | 1.95 | 30.0% | 153 | 4922 | 58 |
| Columbus, Ohio | 1.96 | 35.9% | 71 | 6165 | 49 |
| Albany, New York | 2.03 | 37.2% | 58 | 10841 | 27 |
| San Diego, California | 2.04 | 38.8% | 44 | 45465 | 7 |
| Los Angeles, California | 2.11 | 34.2% | 91 | 74381 | 4 |
| Cedar Rapids, Iowa | 2.16 | 31.0% | 138 | 2178 | 92 |
| Minneapolis, Minnesota | 2.22 | 41.7% | 29 | 41696 | 9 |
| Raleigh, North Carolina | 2.22 | 46.2% | 15 | 15950 | 21 |
| Burlington, Vermont | 2.26 | 43.0% | 27 | 6263 | 48 |
| Portland, Oregon | 2.35 | 40.3% | 34 | 25717 | 15 |
| Salt Lake City, Utah | 2.39 | 35.5% | 77 | 6690 | 47 |
| Denver, Colorado | 2.43 | 43.9% | 24 | 11436 | 24 |
| Austin, Texas | 2.57 | 44.8% | 21 | 33753 | 12 |
| Ann Arbor, Michigan | 2.78 | 54.5% | 2 | 7928 | 37 |
| Durham, North Carolina | 2.80 | 46.9% | 14 | 6861 | 45 |
| Detroit, Michigan | 2.88 | 31.1% | 133 | 37342 | 10 |
| Boston, Massachusetts | 3.02 | 47.6% | 11 | 62653 | 5 |
| Trenton, New Jersey | 3.03 | 43.9% | 24 | 5810 | 54 |
| San Francisco, California | 3.13 | 49.3% | 9 | 89981 | 3 |
| Seattle, Washington | 3.38 | 41.9% | 28 | 44406 | 8 |
| California, Maryland | 4.14 | 31.8% | 127 | #N/A | #N/A |
| Huntsville, Alabama | 4.45 | 38.8% | 44 | 2368 | 87 |
| Boulder, Colorado | 4.75 | 63.2% | 1 | 9137 | 32 |
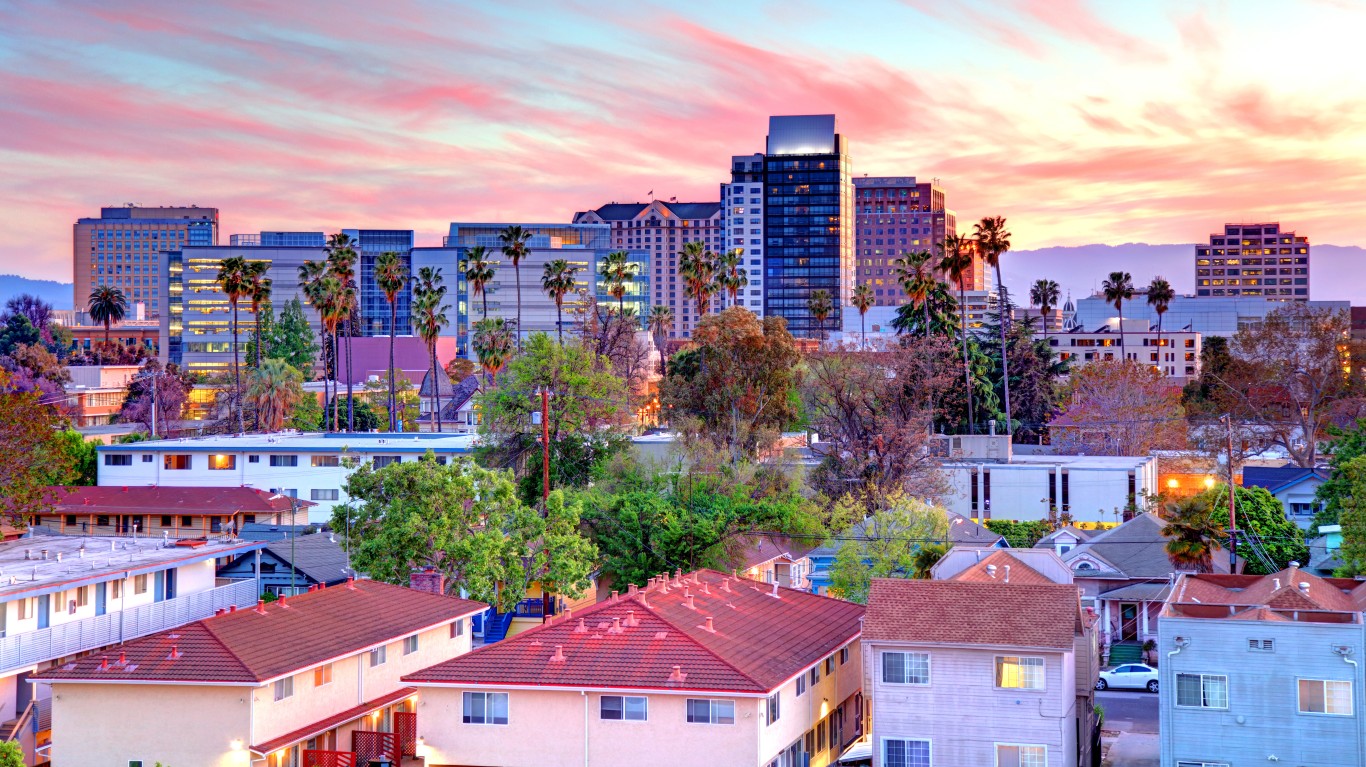
| San Jose, California | 6.51 | 50.8% | 7 | 143473 | 1 |
Methodology
To identify the 30 cities with the largest creative classes, 24/7 Wall St. reviewed 2017 employment data from the Bureau of Labor Statistics’ Standard Occupational Classification system. We combined total employment in each metropolitan area in occupations that we determined to be creative occupations. The share of adults with a bachelor’s degree is from the U.S. Census Bureau’s American Community Survey, and is for 2017. The number of patents granted is from The U.S. Patent and Trademark Office.
Contact [email protected] for any questions or corrections.