For better or worse, many American cities are defined largely by their local economy. Places like Las Vegas and Miami are major international tourist hubs, while Houston is a global energy leader, and Detroit is practically synonymous with the U.S. auto industry. (Here is a look at the most iconic job in every state.)
Similarly, there are many cities in the United States that stand out for having a large creative class workforce. Creative class occupations — defined as those that typically require high levels of creative thinking — span multiple industries, including architecture, the arts, engineering, technology, and business. These types of jobs usually require at least a bachelor’s degree and tend to be well paying. They are also a key driver of innovation, economic growth, and culture in the United States.
Using data from the Bureau of Labor Statistics, 24/7 Wall St. identified the cities with the largest creative classes. We ranked metro areas on employment within “creative class” occupations — based on classifications from the Economic Research Service of the U.S. Department of Agriculture — as a percentage of all occupations in 2022.
Among the 40 metro areas on this list, creative class occupations make up anywhere from 16.7% to over 30% of all jobs. Several of these places are large, so-called “superstar” cities that regularly draw in young, college-educated, and upwardly mobile professionals. These cities include Boston, Los Angeles, New York, and San Francisco.
While this list includes places that are well known for the presence of creative class jobs, such as Silicon Valley and Washington D.C., others have only recently emerged as creative class hubs. Metro areas like Charlotte, North Carolina; Des Moines, Iowa; and Lincoln, Nebraska — all of which rank on this list — have reported greater than 40% increases in creative class employment in the last five years alone. (Here is a look at America’s 25 booming industries.)
These are the U.S. cities with the largest creative classes.
40. Philadelphia-Camden-Wilmington, PA-NJ-DE-MD
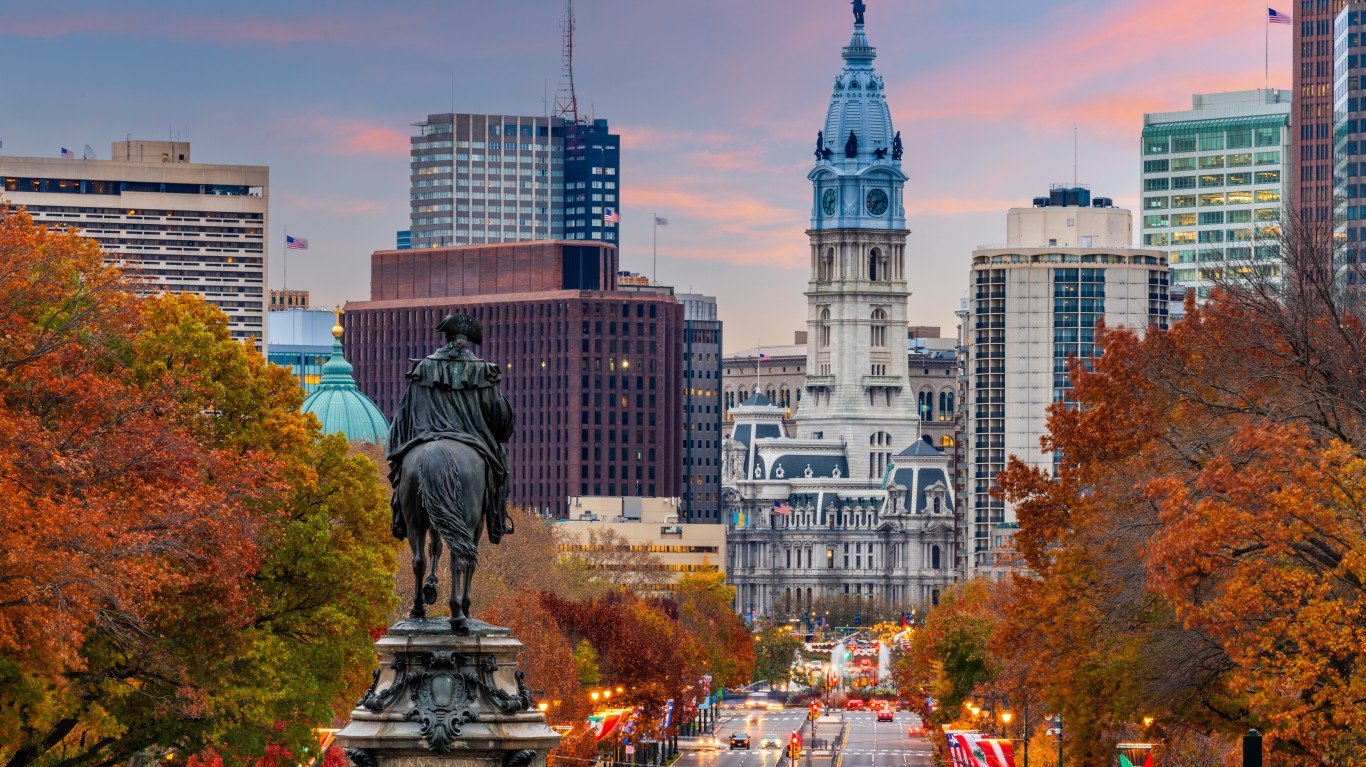
- “Creative class” as share of all jobs: 16.7%
- Avg. annual “creative class” wage: $109,575
- Avg. annual wage for all occupations: $64,500
- Most concentrated “creative class” job: Postsecondary architecture teachers; biochemists and biophysicists; chemical engineers
39. Fort Collins, CO
- “Creative class” as share of all jobs: 16.8%
- Avg. annual “creative class” wage: $104,581
- Avg. annual wage for all occupations: $63,700
- Most concentrated “creative class” job: Conservation scientists; atmospheric and space scientists; computer hardware engineers
38. Burlington-South Burlington, VT
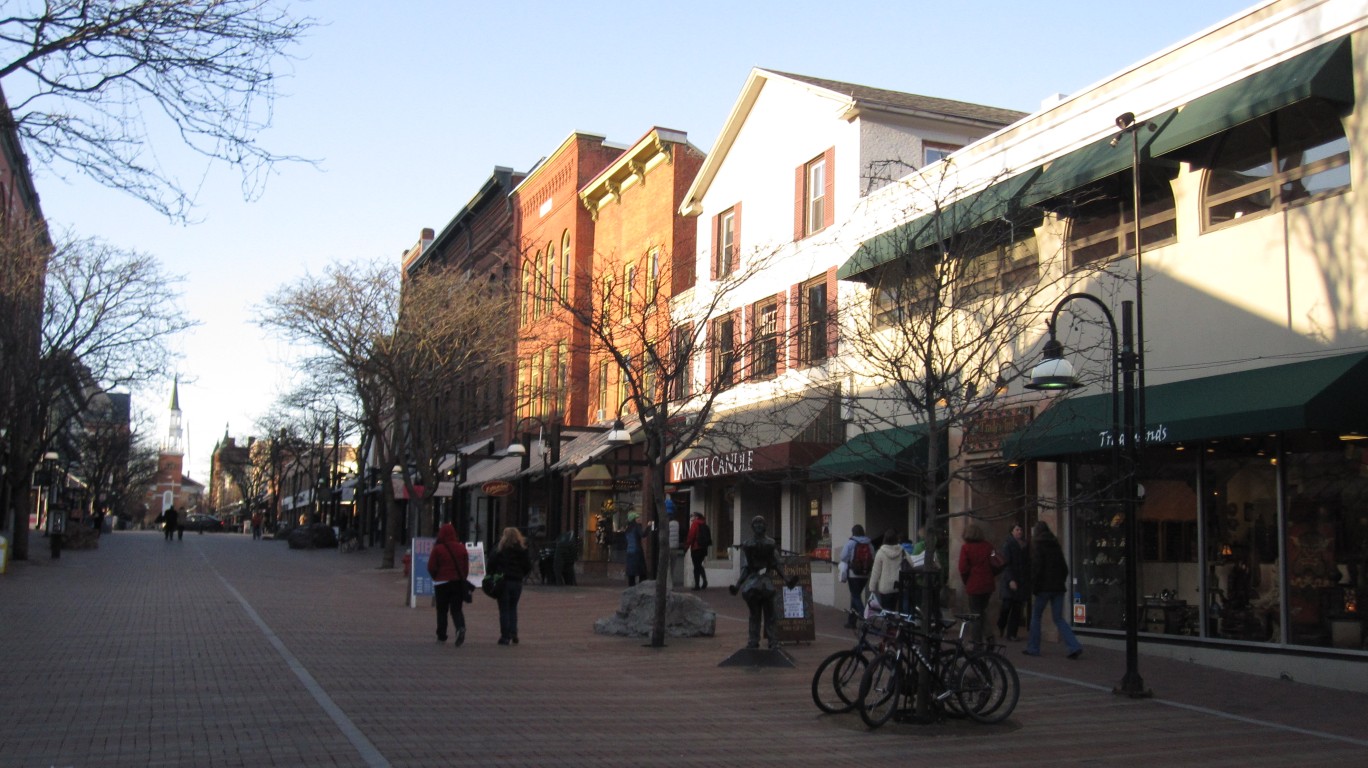
- “Creative class” as share of all jobs: 16.9%
- Avg. annual “creative class” wage: $97,105
- Avg. annual wage for all occupations: $63,180
- Most concentrated “creative class” job: Hydrologists; commercial and industrial designers; education and childcare administrators, preschool and daycare
37. Portland-South Portland, ME
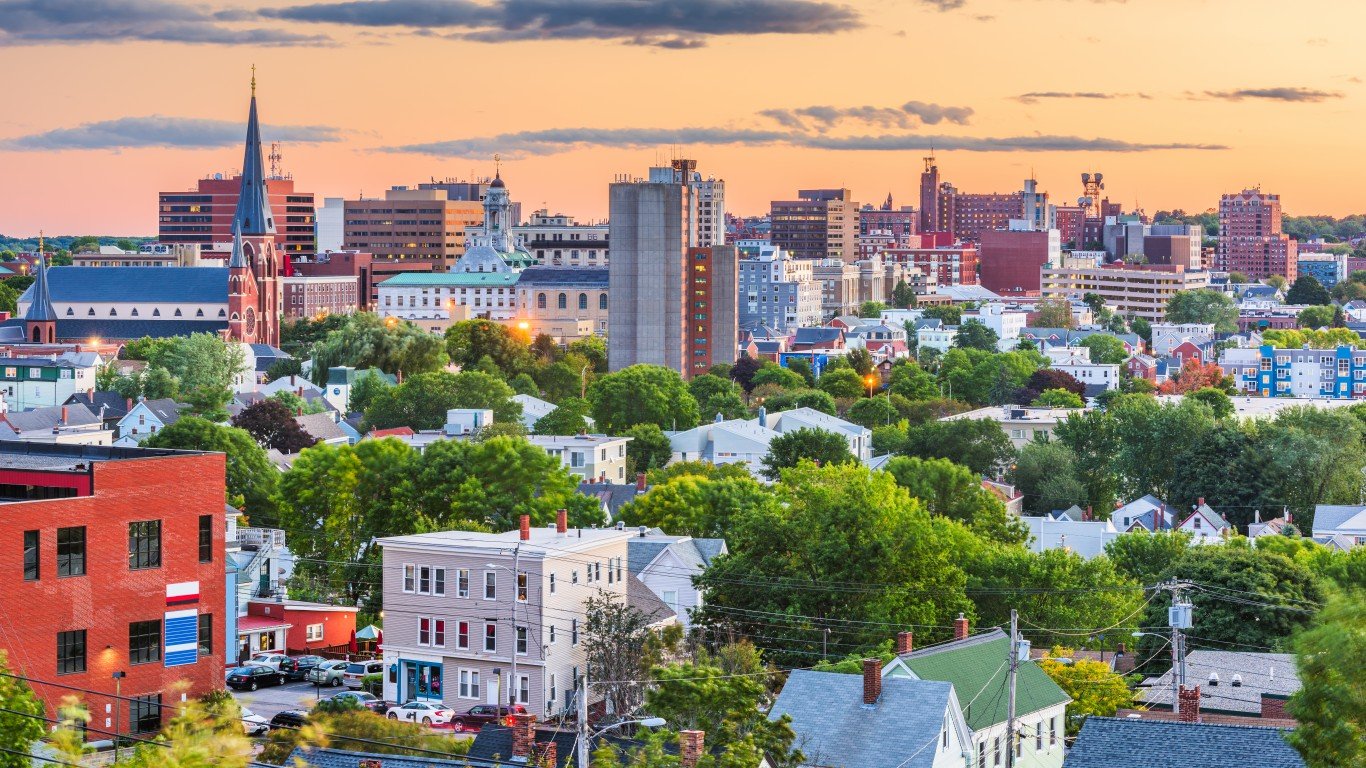
- “Creative class” as share of all jobs: 17.0%
- Avg. annual “creative class” wage: $95,583
- Avg. annual wage for all occupations: $59,920
- Most concentrated “creative class” job: Biochemists and biophysicists; advertising and promotions managers; political scientists
36. Charlotte-Concord-Gastonia, NC-SC
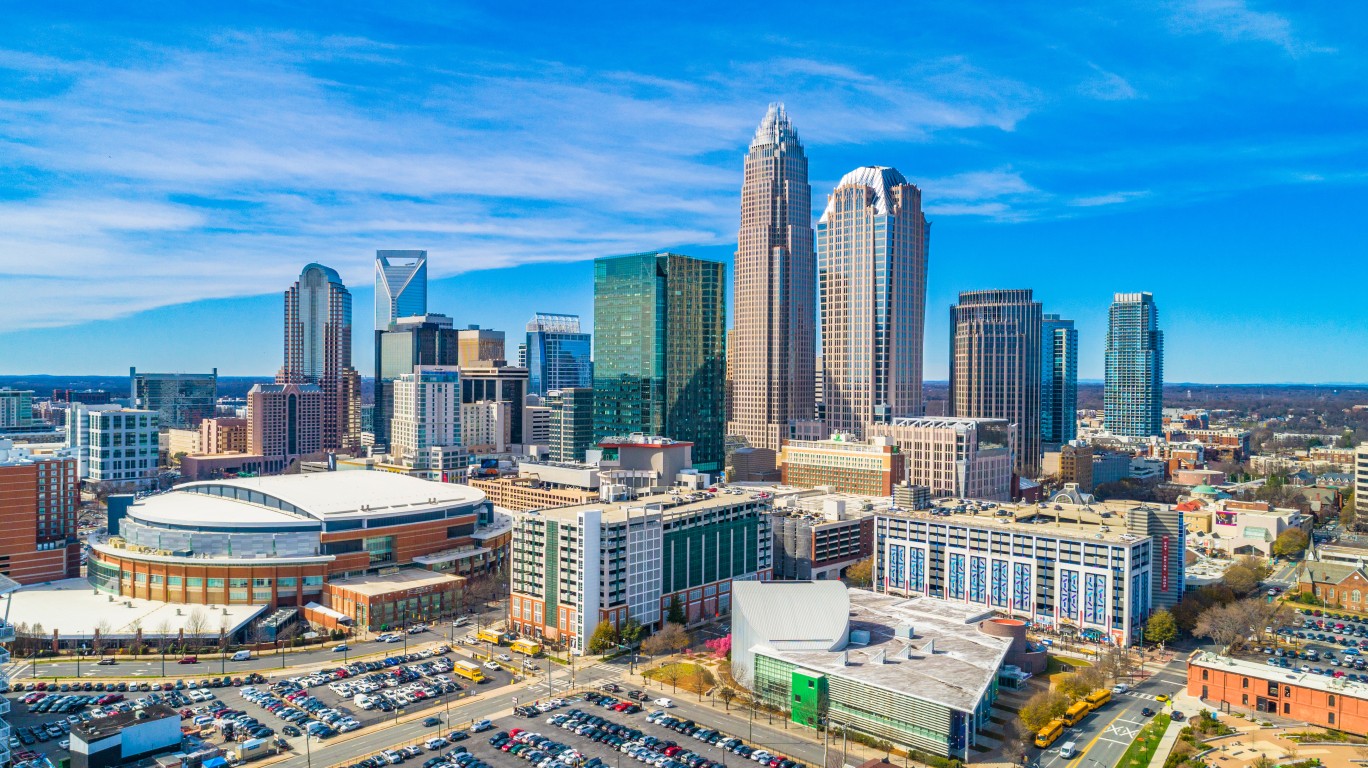
- “Creative class” as share of all jobs: 17.1%
- Avg. annual “creative class” wage: $110,884
- Avg. annual wage for all occupations: $60,550
- Most concentrated “creative class” job: Athletes and sports competitors; archivists; computer systems analysts
35. Albany-Schenectady-Troy, NY
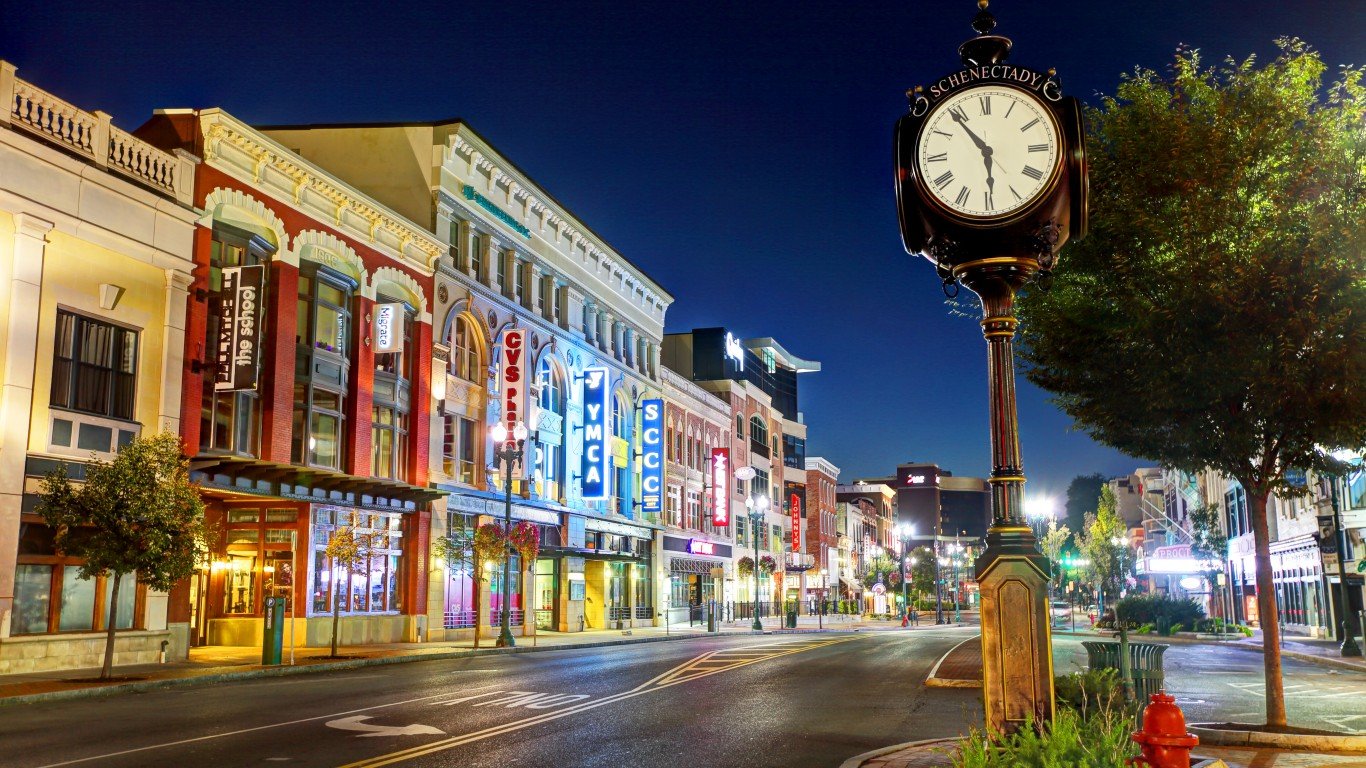
- “Creative class” as share of all jobs: 17.2%
- Avg. annual “creative class” wage: $105,539
- Avg. annual wage for all occupations: $64,690
- Most concentrated “creative class” job: Physical scientists; survey researchers; materials scientists
34. Palm Bay-Melbourne-Titusville, FL
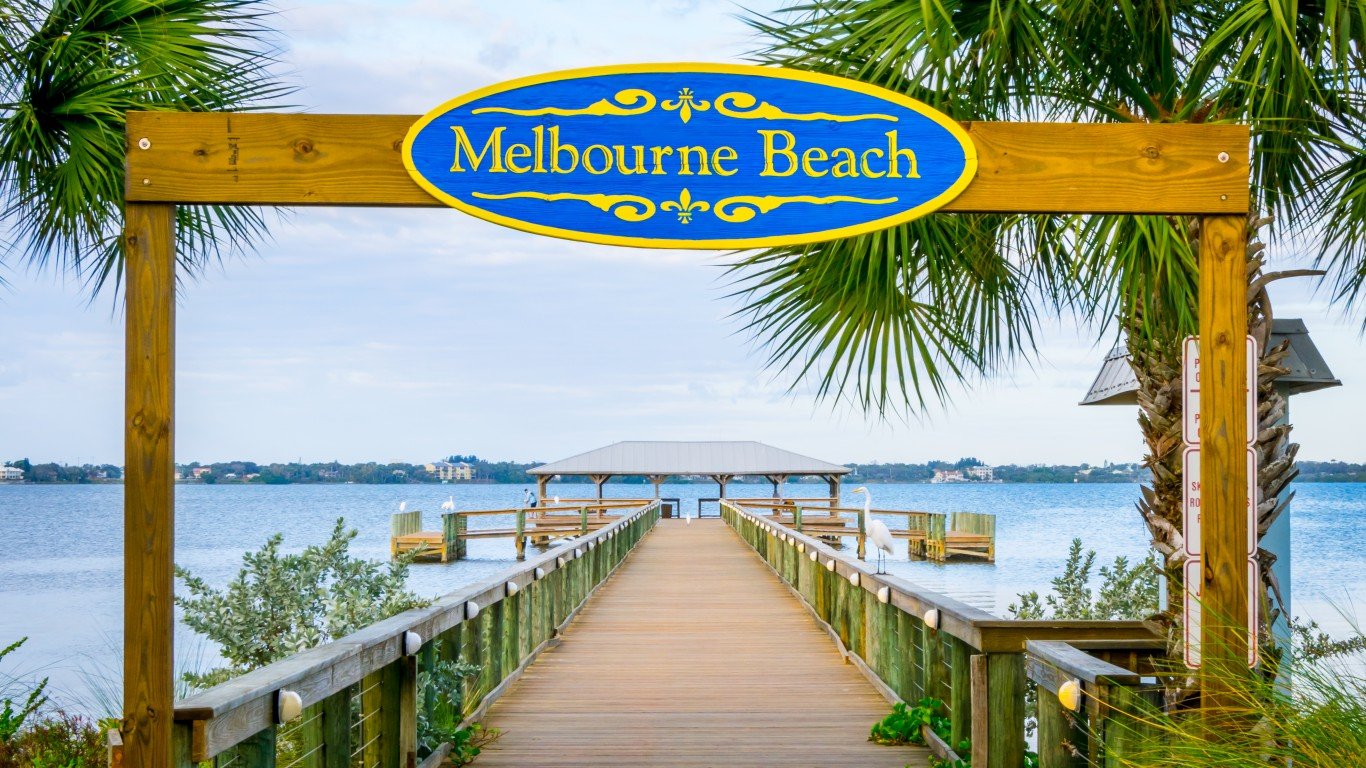
- “Creative class” as share of all jobs: 17.4%
- Avg. annual “creative class” wage: $104,958
- Avg. annual wage for all occupations: $58,280
- Most concentrated “creative class” job: Aerospace engineers; engineers; atmospheric and space scientists
33. Lincoln, NE
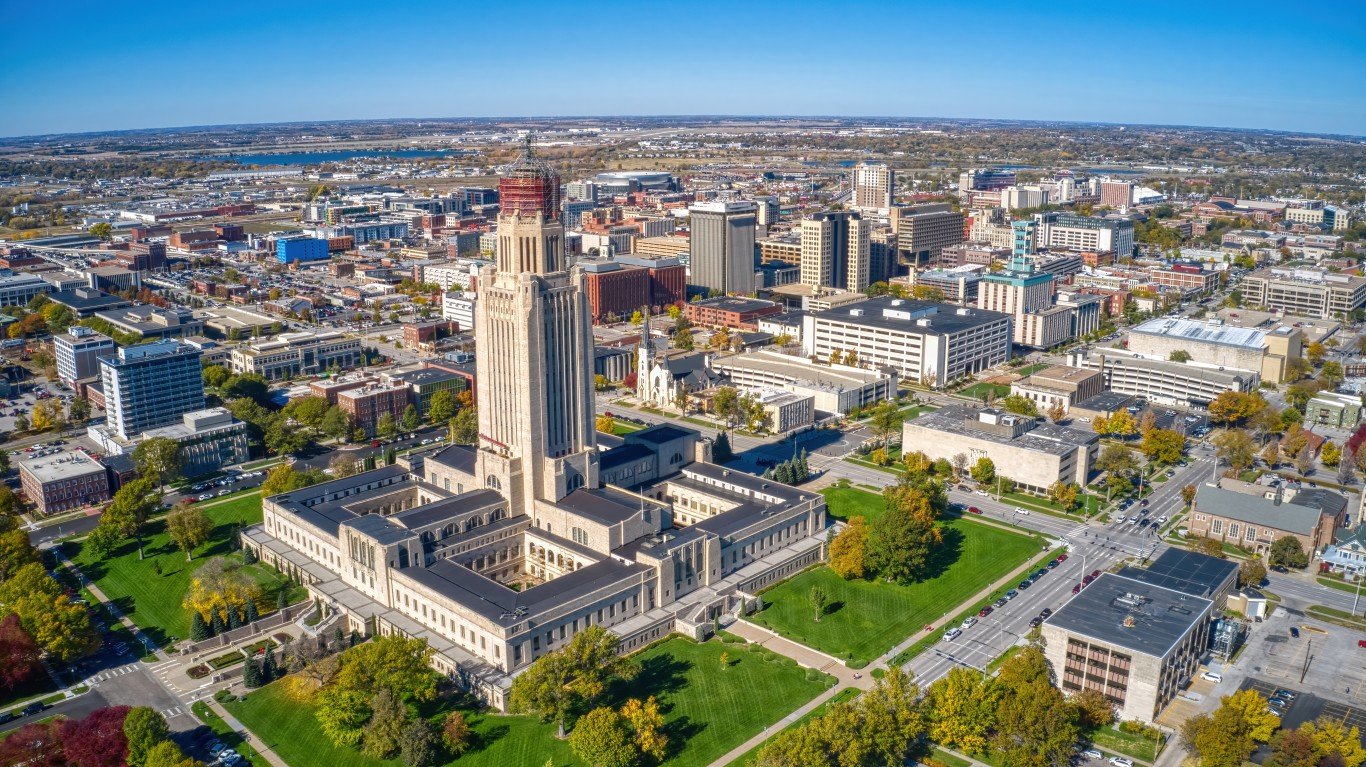
- “Creative class” as share of all jobs: 17.6%
- Avg. annual “creative class” wage: $87,096
- Avg. annual wage for all occupations: $55,610
- Most concentrated “creative class” job: Postsecondary agricultural sciences teachers; choreographers; soil and plant scientists
32. Olympia-Tumwater, WA
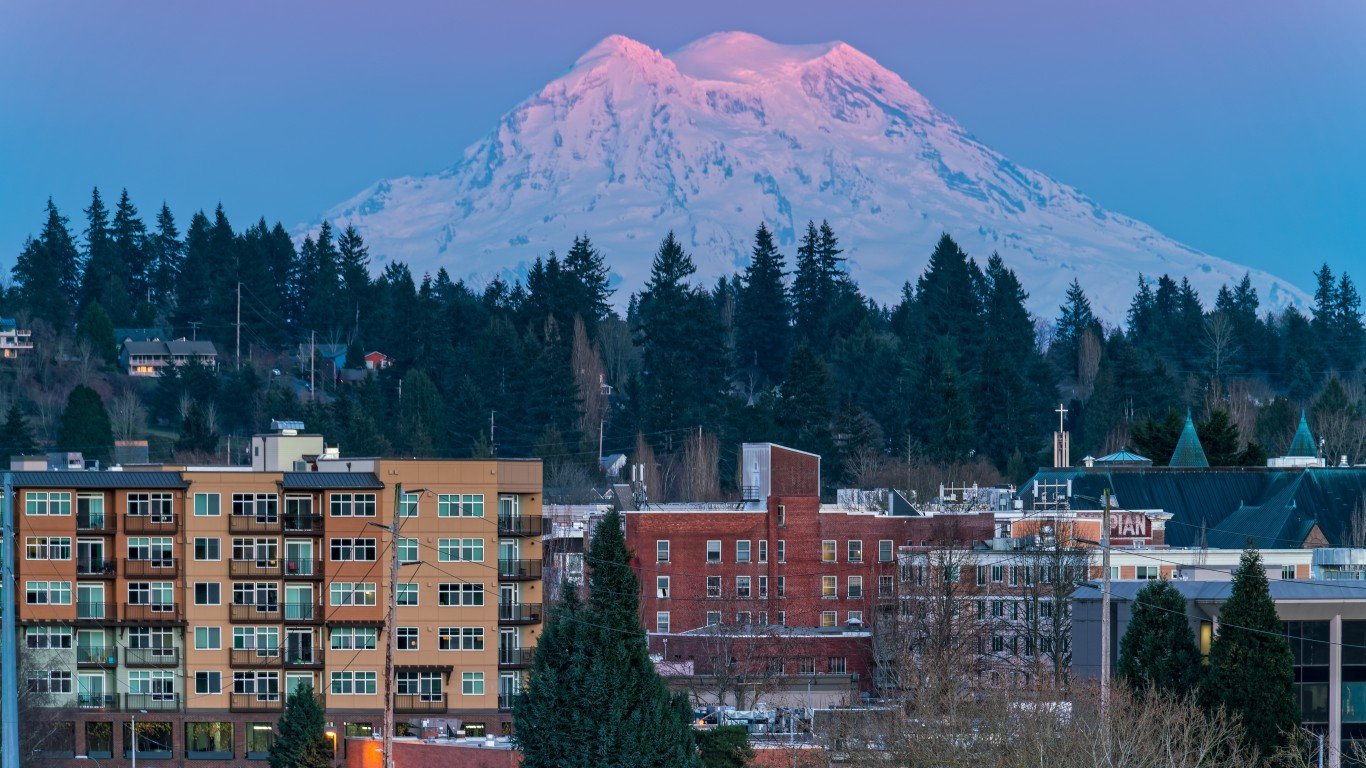
- “Creative class” as share of all jobs: 17.8%
- Avg. annual “creative class” wage: $100,753
- Avg. annual wage for all occupations: $65,960
- Most concentrated “creative class” job: Urban and regional planners; zoologists and wildlife biologists; archivists
31. Des Moines-West Des Moines, IA
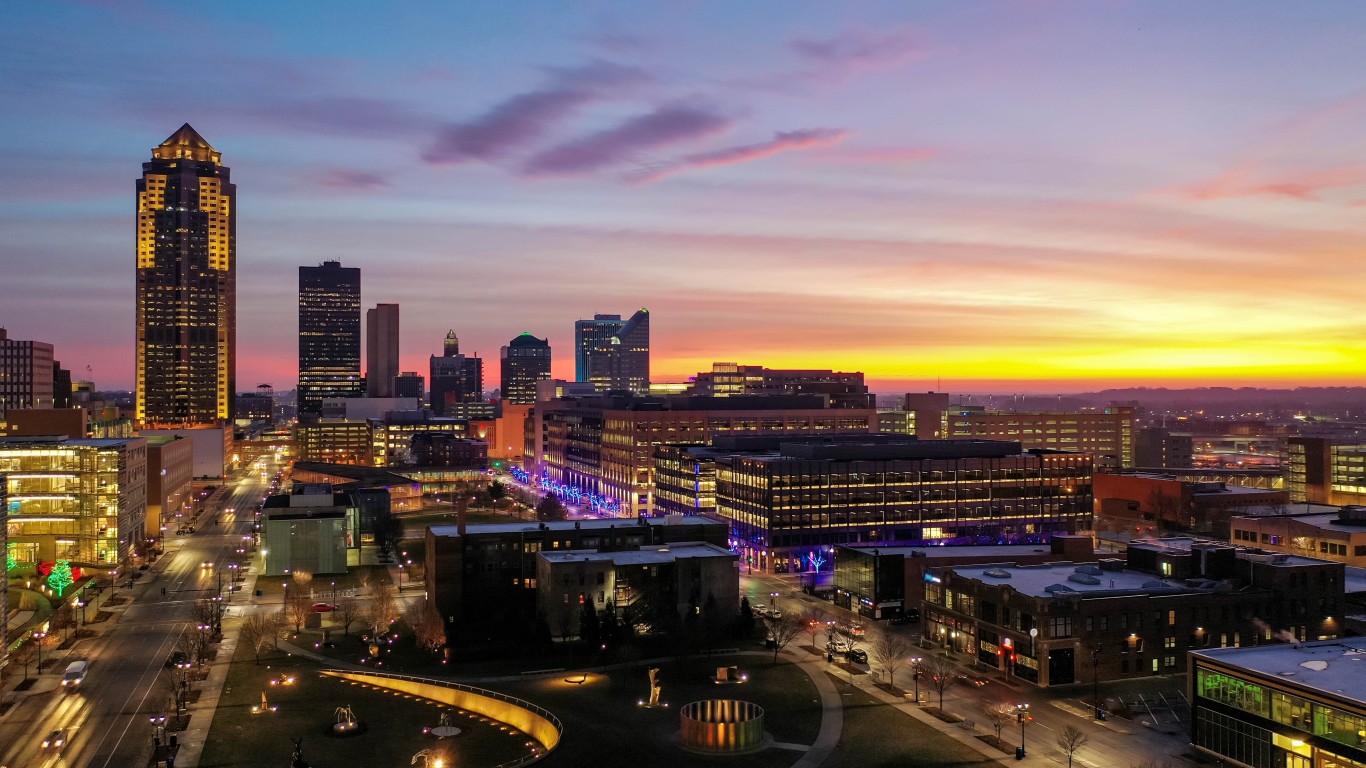
- “Creative class” as share of all jobs: 17.8%
- Avg. annual “creative class” wage: $96,386
- Avg. annual wage for all occupations: $59,950
- Most concentrated “creative class” job: Soil and plant scientists; actuaries; survey researchers
30. Detroit-Warren-Dearborn, MI
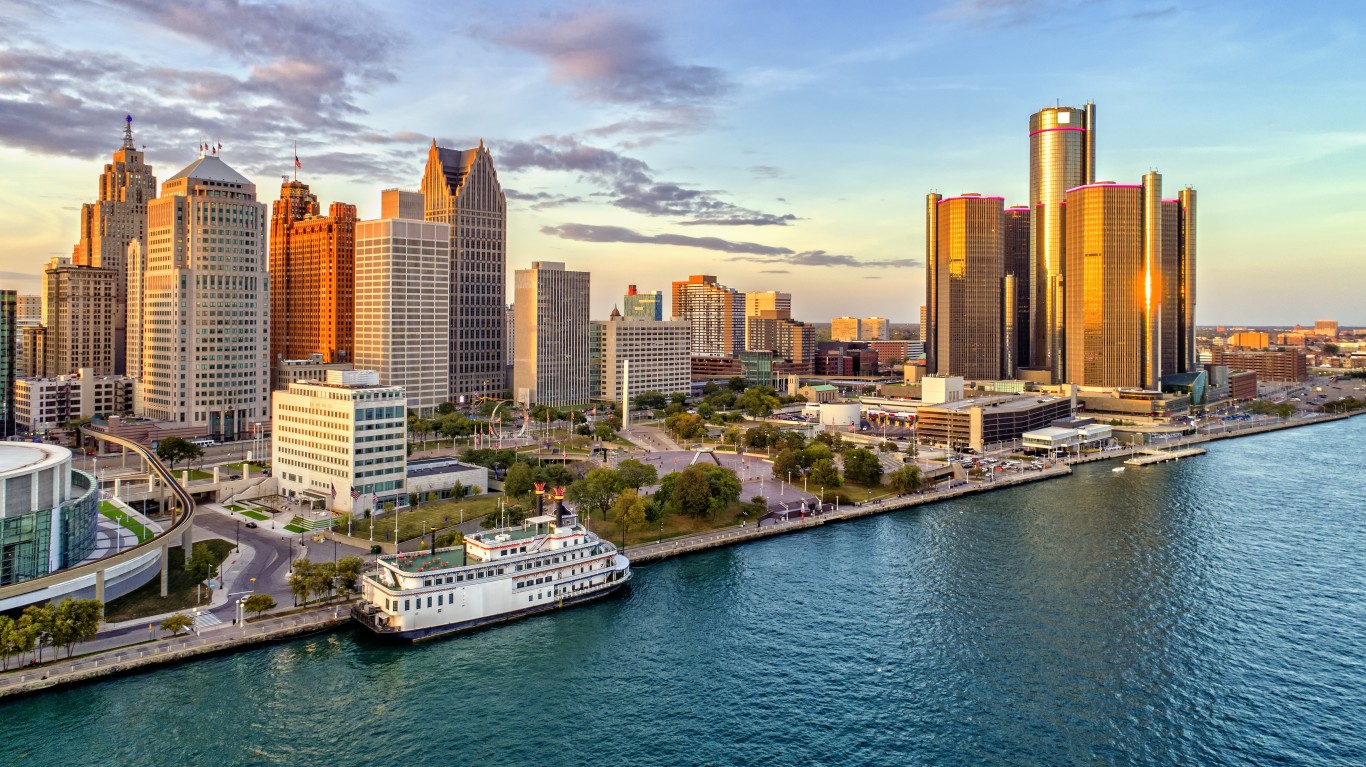
- “Creative class” as share of all jobs: 17.8%
- Avg. annual “creative class” wage: $104,382
- Avg. annual wage for all occupations: $62,000
- Most concentrated “creative class” job: Mechanical engineers; commercial and industrial designers; craft artists
29. Atlanta-Sandy Springs-Roswell, GA
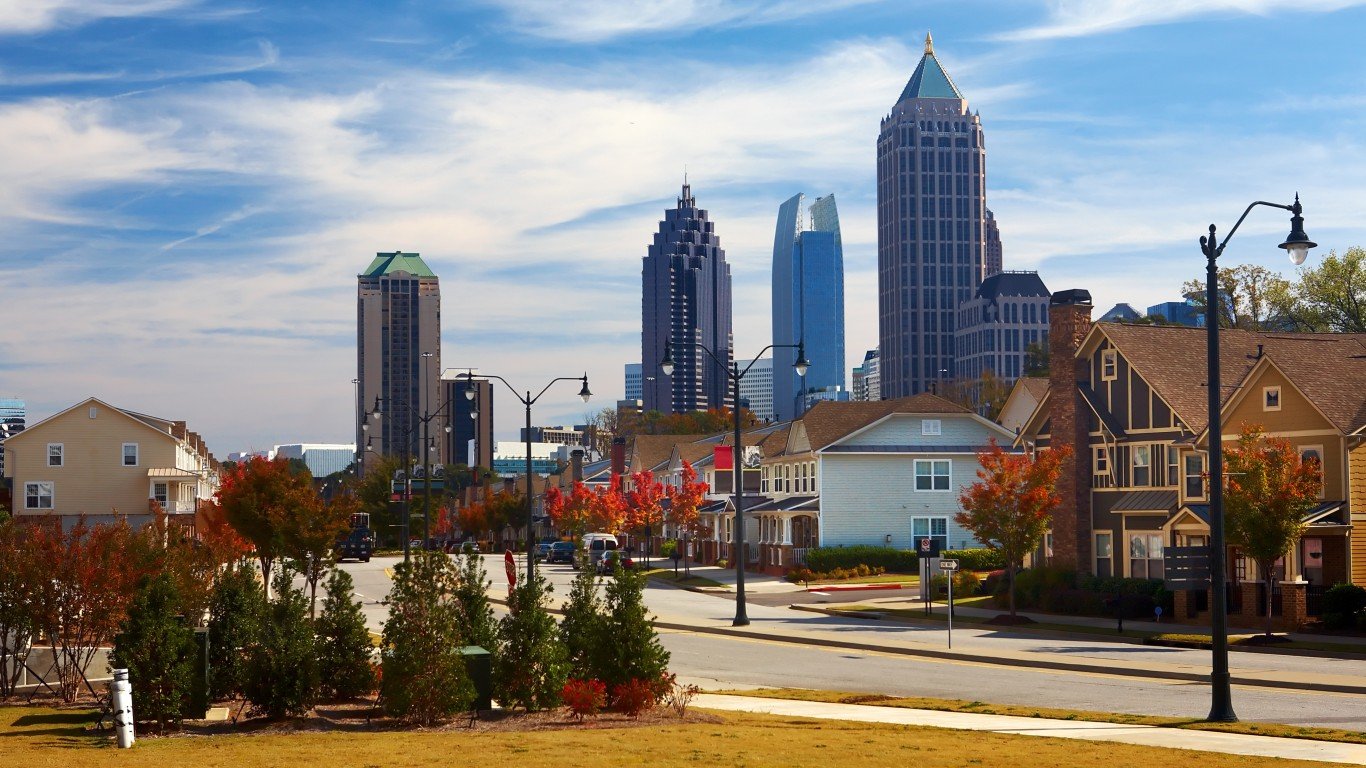
- “Creative class” as share of all jobs: 17.9%
- Avg. annual “creative class” wage: $112,533
- Avg. annual wage for all occupations: $63,180
- Most concentrated “creative class” job: Actors; artists and related workers; mathematical science occupations
28. Los Angeles-Long Beach-Anaheim, CA
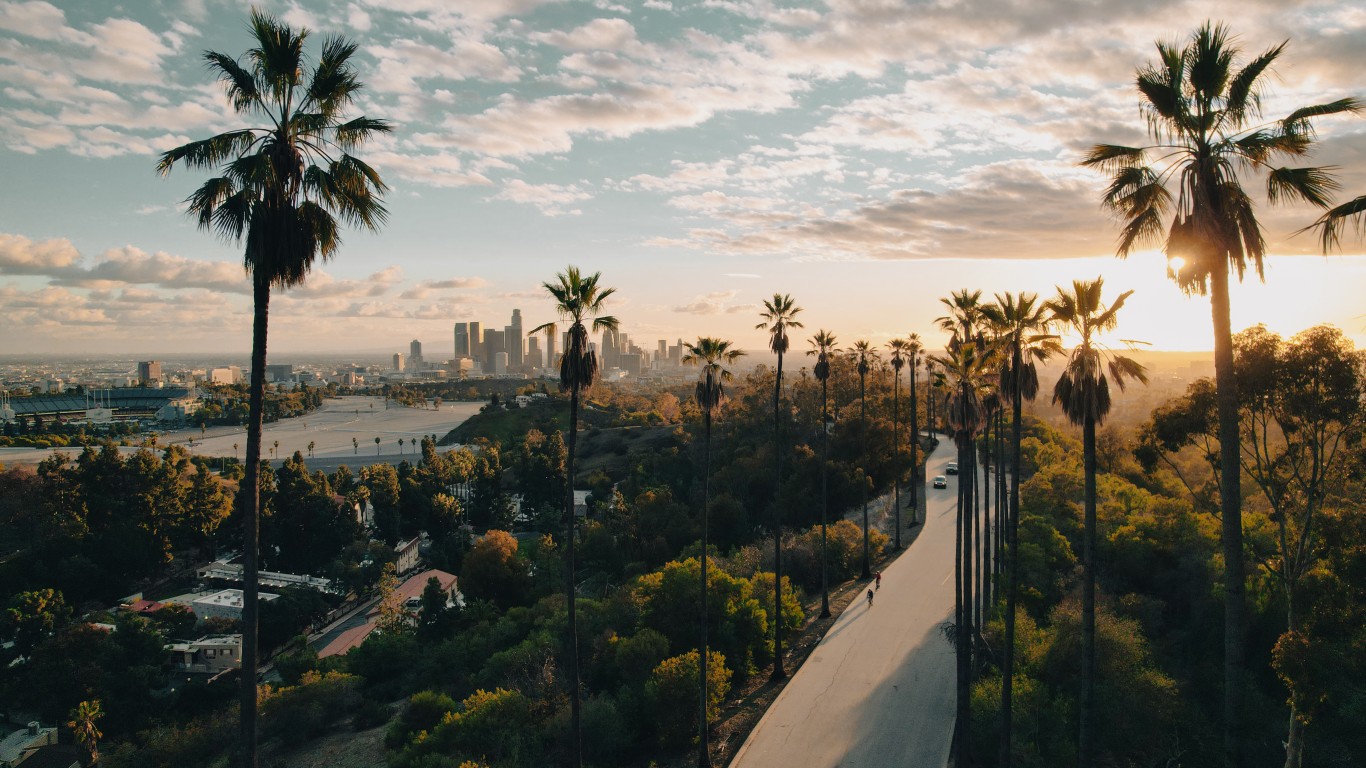
- “Creative class” as share of all jobs: 18.0%
- Avg. annual “creative class” wage: $123,659
- Avg. annual wage for all occupations: $69,540
- Most concentrated “creative class” job: Special effects artists and animators; media and communication workers; lighting technicians
27. Chicago-Naperville-Elgin, IL-IN-WI
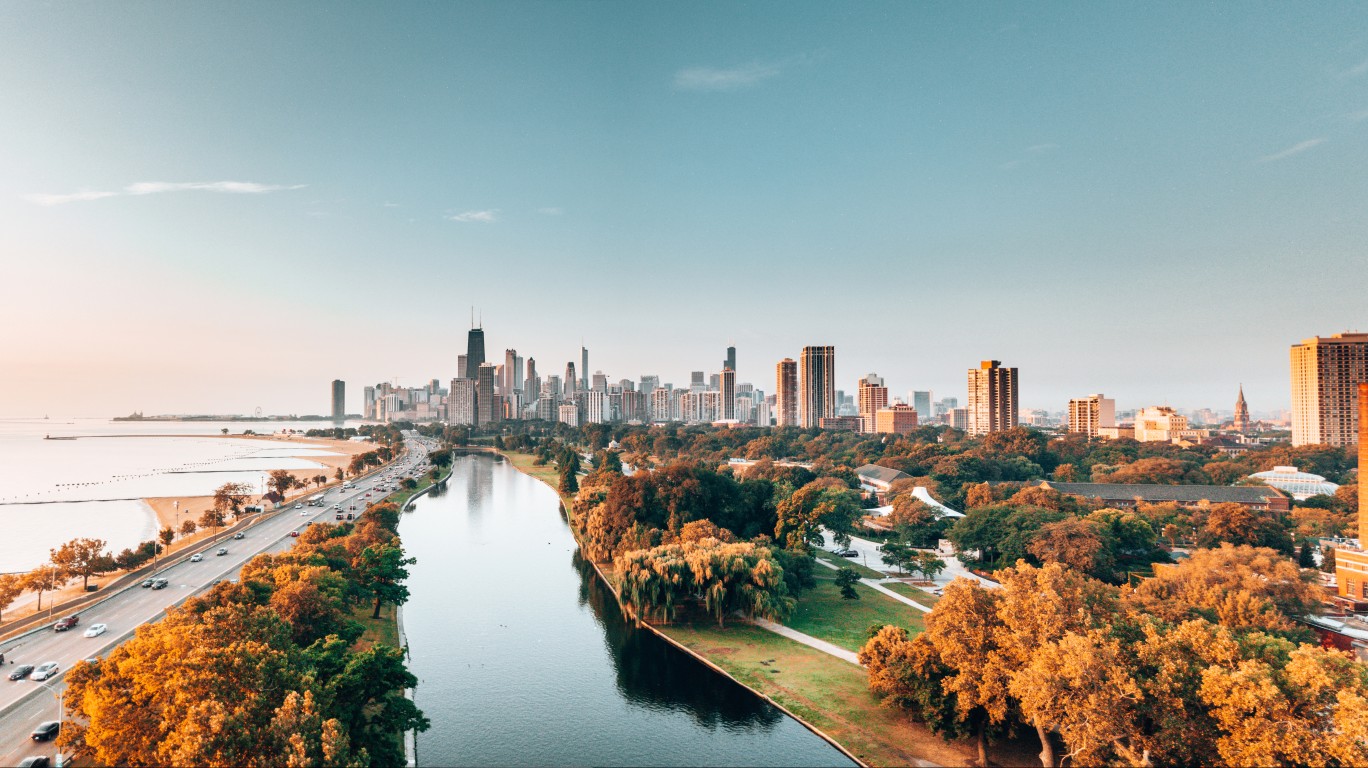
- “Creative class” as share of all jobs: 18.0%
- Avg. annual “creative class” wage: $114,894
- Avg. annual wage for all occupations: $66,170
- Most concentrated “creative class” job: Mathematical science occupations; actuaries; physicists
26. Omaha-Council Bluffs, NE-IA
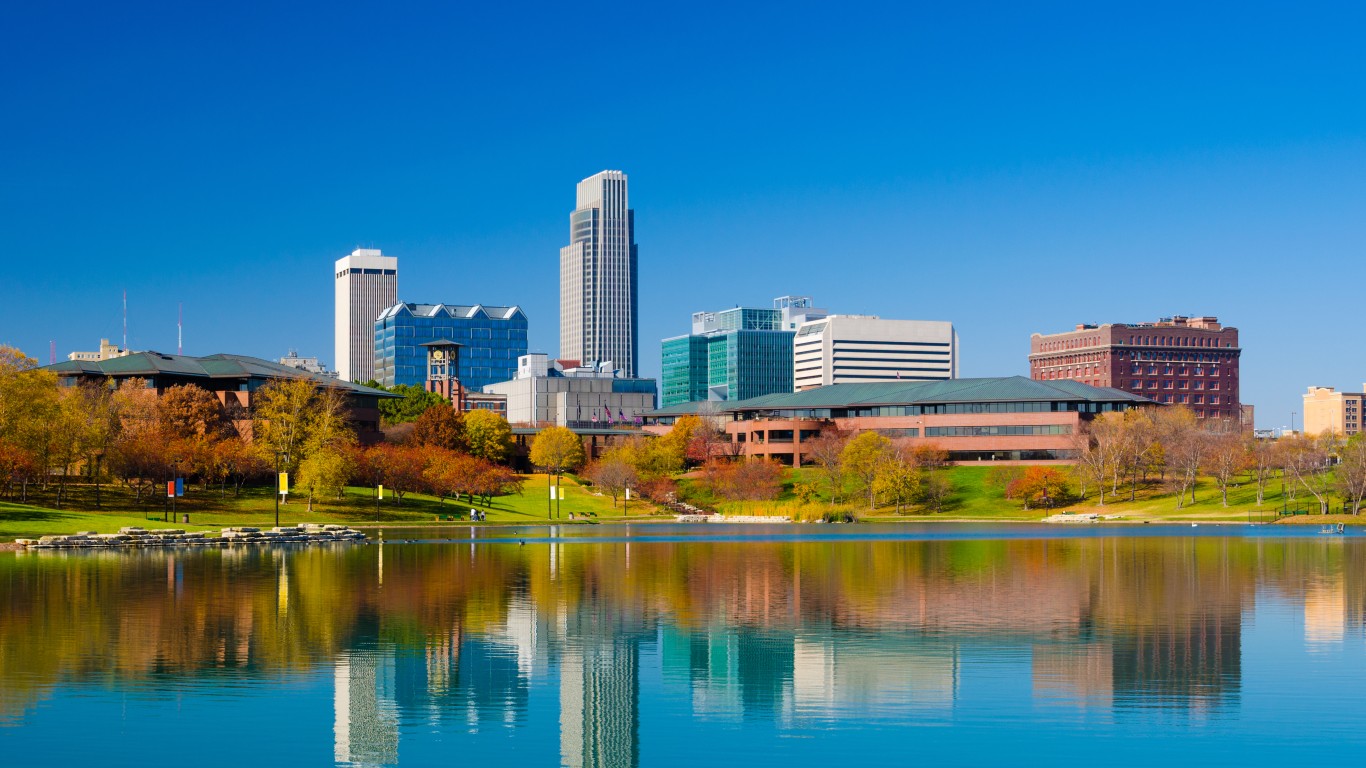
- “Creative class” as share of all jobs: 18.1%
- Avg. annual “creative class” wage: $95,416
- Avg. annual wage for all occupations: $58,000
- Most concentrated “creative class” job: Food scientists and technologists; personal service managers; soil and plant scientists
25. Ann Arbor, MI
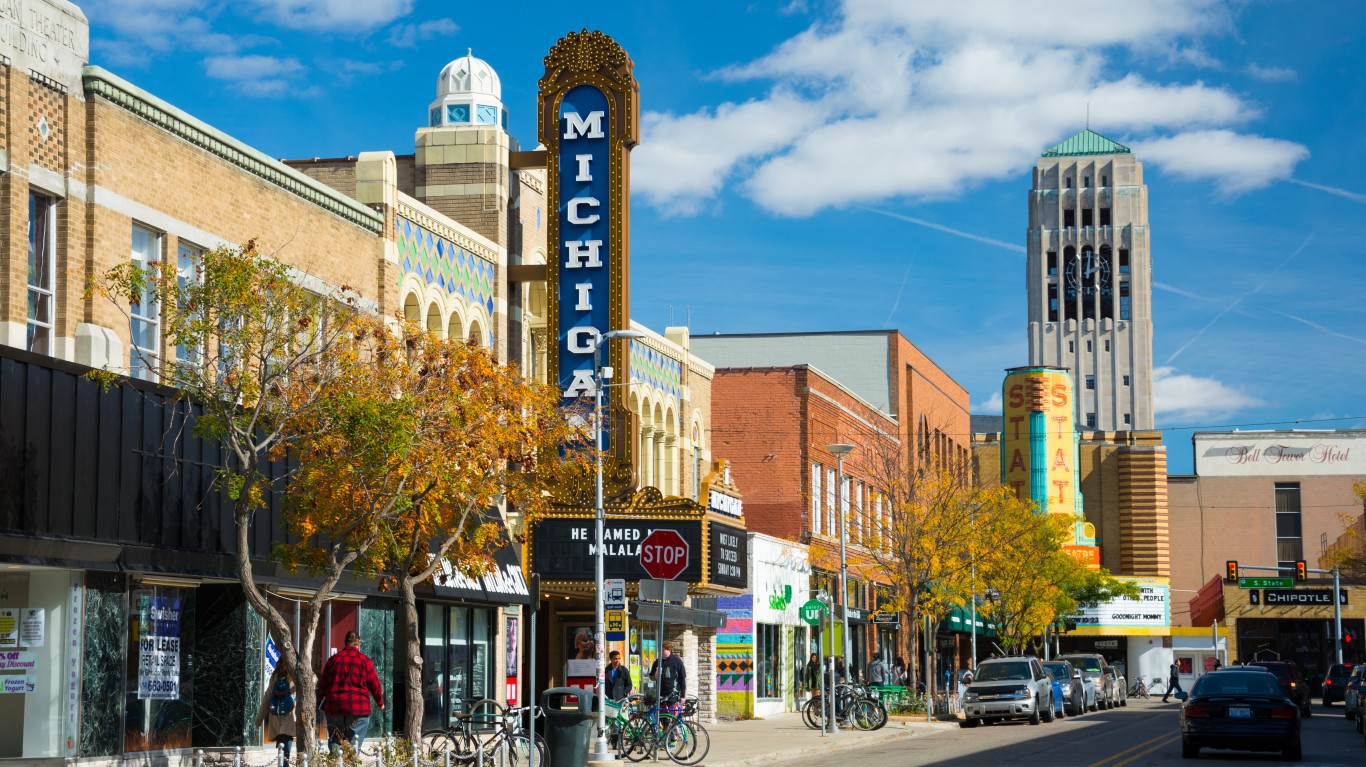
- “Creative class” as share of all jobs: 18.5%
- Avg. annual “creative class” wage: $108,584
- Avg. annual wage for all occupations: $66,130
- Most concentrated “creative class” job: Postsecondary engineering teachers; sociologists; postsecondary environmental science teachers
24. Dallas-Fort Worth-Arlington, TX
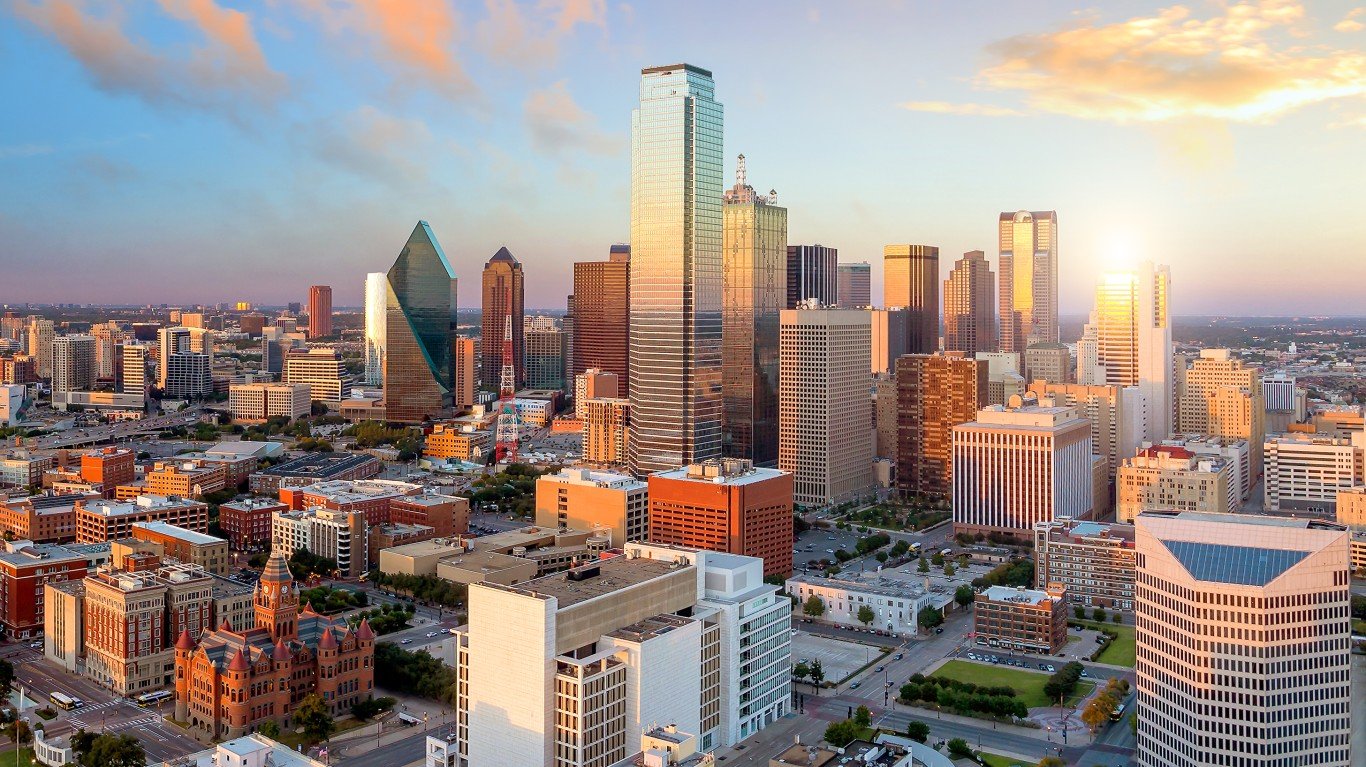
- “Creative class” as share of all jobs: 18.5%
- Avg. annual “creative class” wage: $109,495
- Avg. annual wage for all occupations: $61,160
- Most concentrated “creative class” job: Sales engineers; petroleum engineers; court reporters and simultaneous captioners
23. Minneapolis-St. Paul-Bloomington, MN-WI
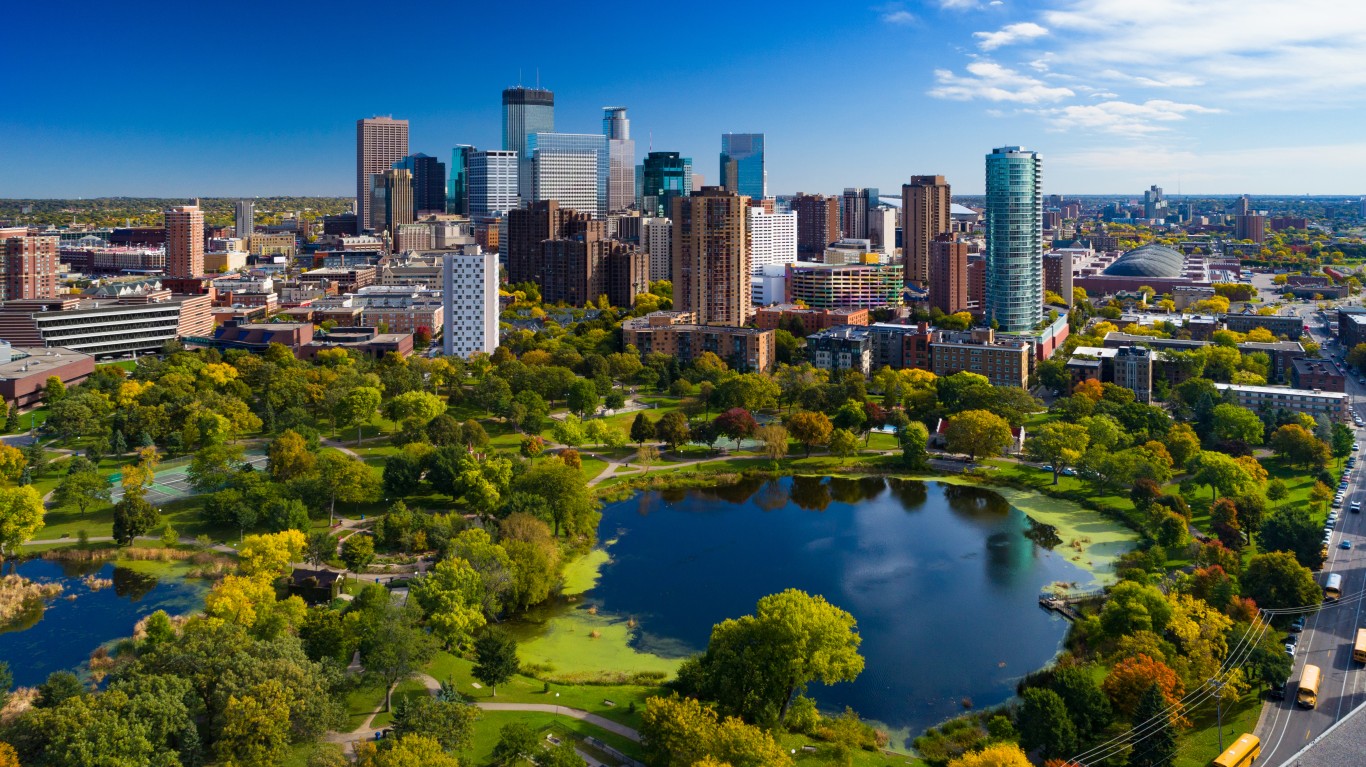
- “Creative class” as share of all jobs: 18.6%
- Avg. annual “creative class” wage: $110,410
- Avg. annual wage for all occupations: $67,060
- Most concentrated “creative class” job: Materials scientists; medical scientists, except epidemiologists; bioengineers and biomedical engineers
22. New York-Newark-Jersey City, NY-NJ-PA
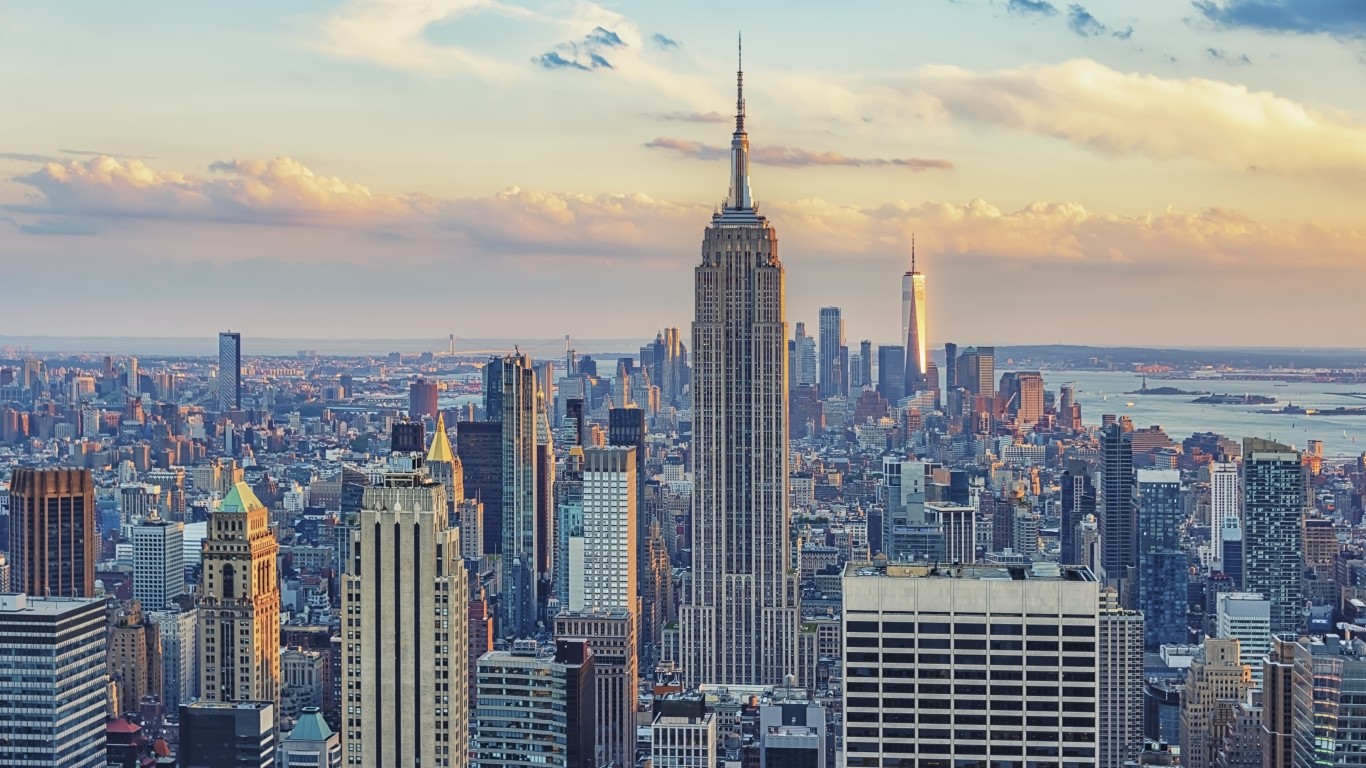
- “Creative class” as share of all jobs: 19.0%
- Avg. annual “creative class” wage: $142,322
- Avg. annual wage for all occupations: $78,560
- Most concentrated “creative class” job: Fashion designers; advertising and promotions managers; film and video editors
21. Portland-Vancouver-Hillsboro, OR-WA
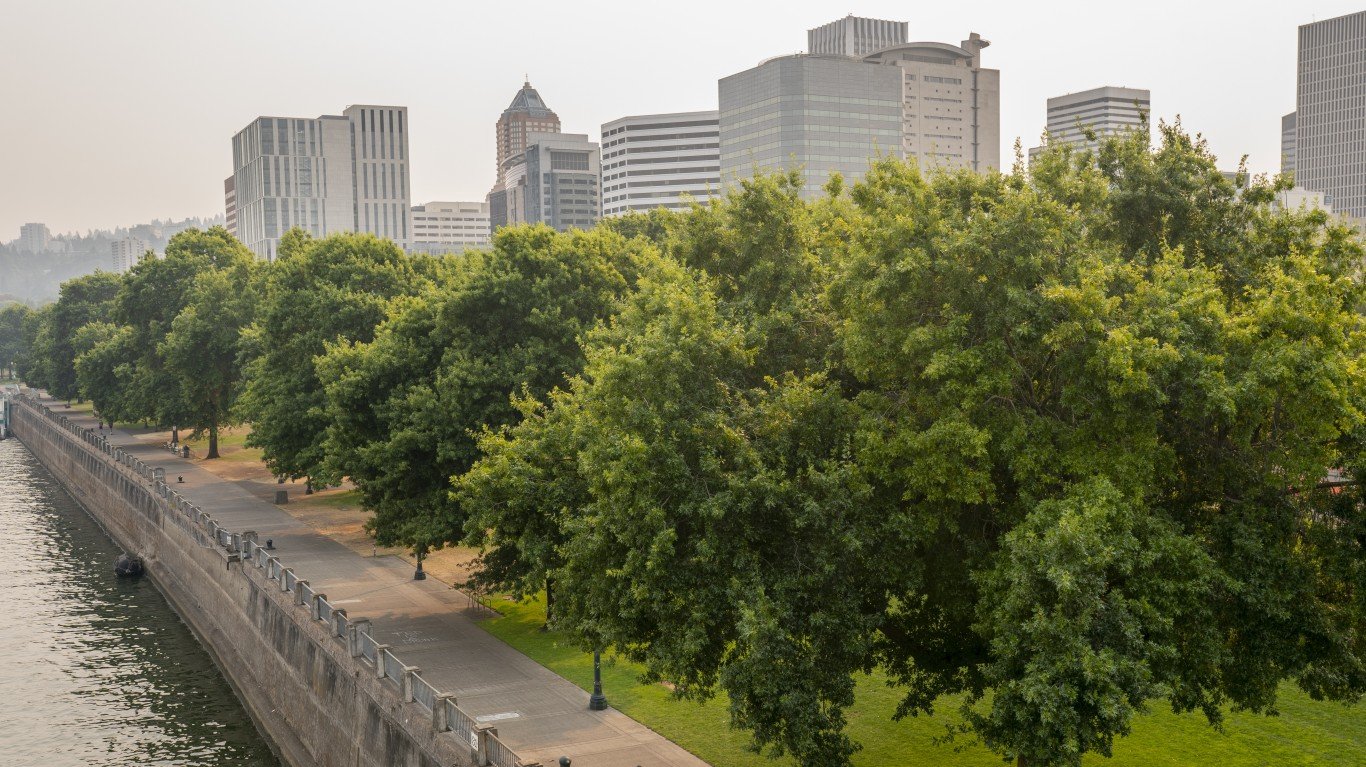
- “Creative class” as share of all jobs: 19.1%
- Avg. annual “creative class” wage: $109,436
- Avg. annual wage for all occupations: $67,970
- Most concentrated “creative class” job: Computer hardware engineers; drafters; cartographers and photogrammetrists
20. Madison, WI
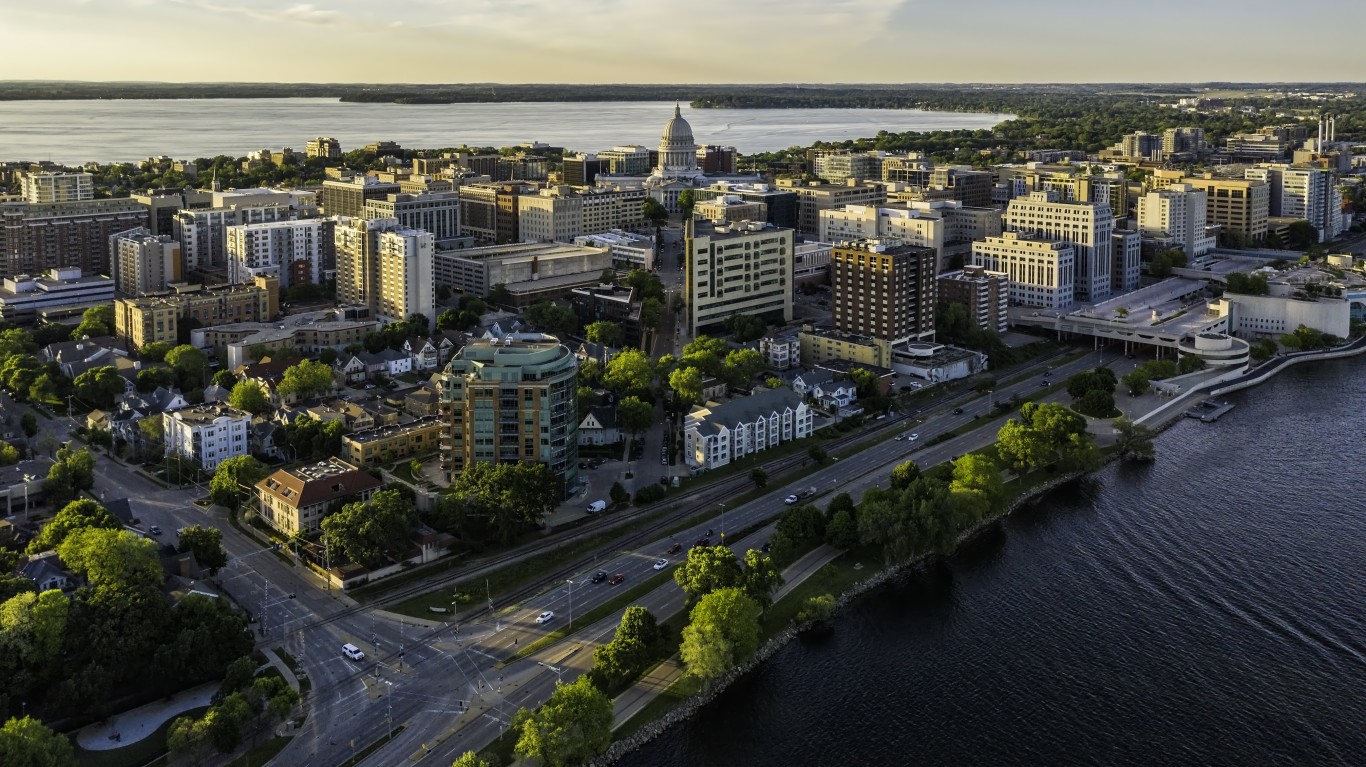
- “Creative class” as share of all jobs: 19.1%
- Avg. annual “creative class” wage: $98,051
- Avg. annual wage for all occupations: $62,200
- Most concentrated “creative class” job: Postsecondary agricultural sciences teachers; microbiologists; postsecondary health specialties teachers
19. Provo-Orem, UT
- “Creative class” as share of all jobs: 19.1%
- Avg. annual “creative class” wage: $96,780
- Avg. annual wage for all occupations: $56,440
- Most concentrated “creative class” job: Umpires, referees, and other sports officials; web developers; writers and authors
18. Hartford-West Hartford-East Hartford, CT
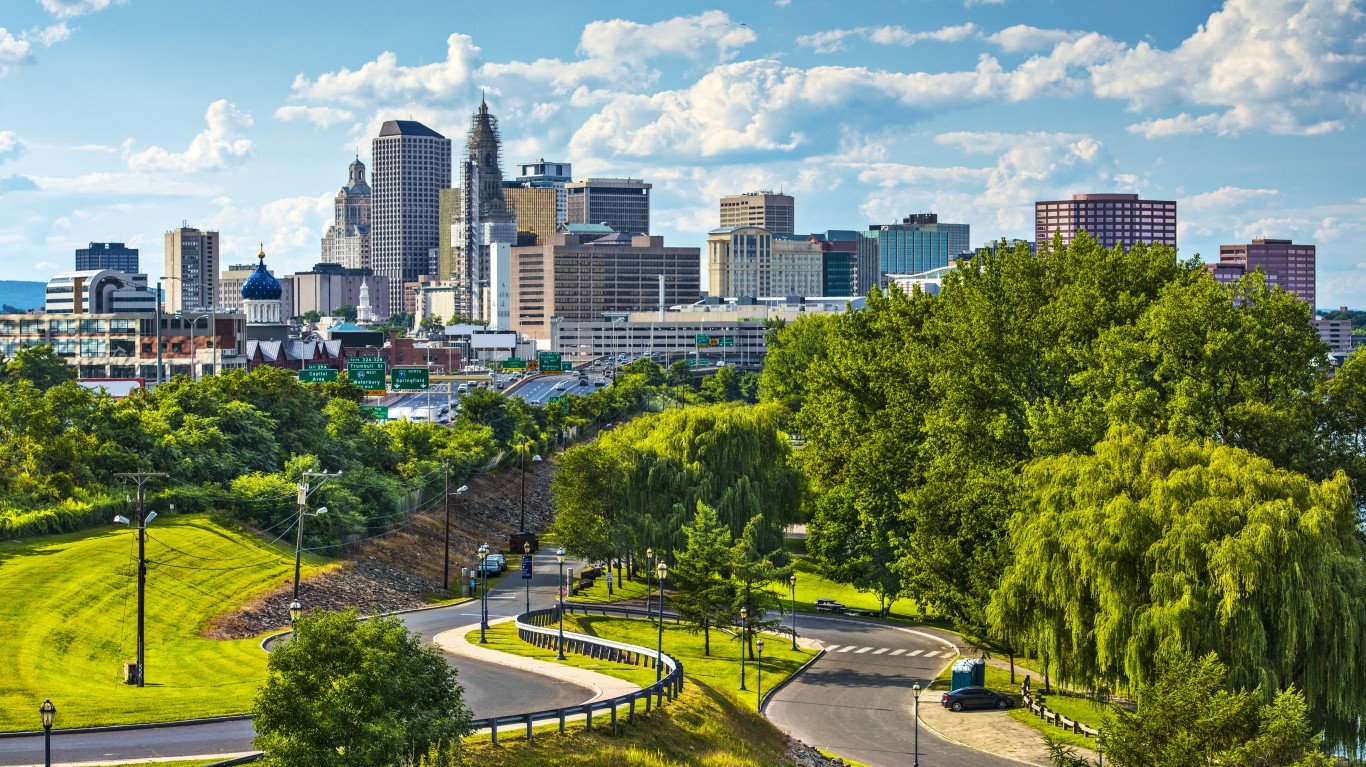
- “Creative class” as share of all jobs: 19.1%
- Avg. annual “creative class” wage: $117,883
- Avg. annual wage for all occupations: $69,040
- Most concentrated “creative class” job: Actuaries; television, video, and film camera operators; athletes and sports competitors
17. San Diego-Carlsbad, CA
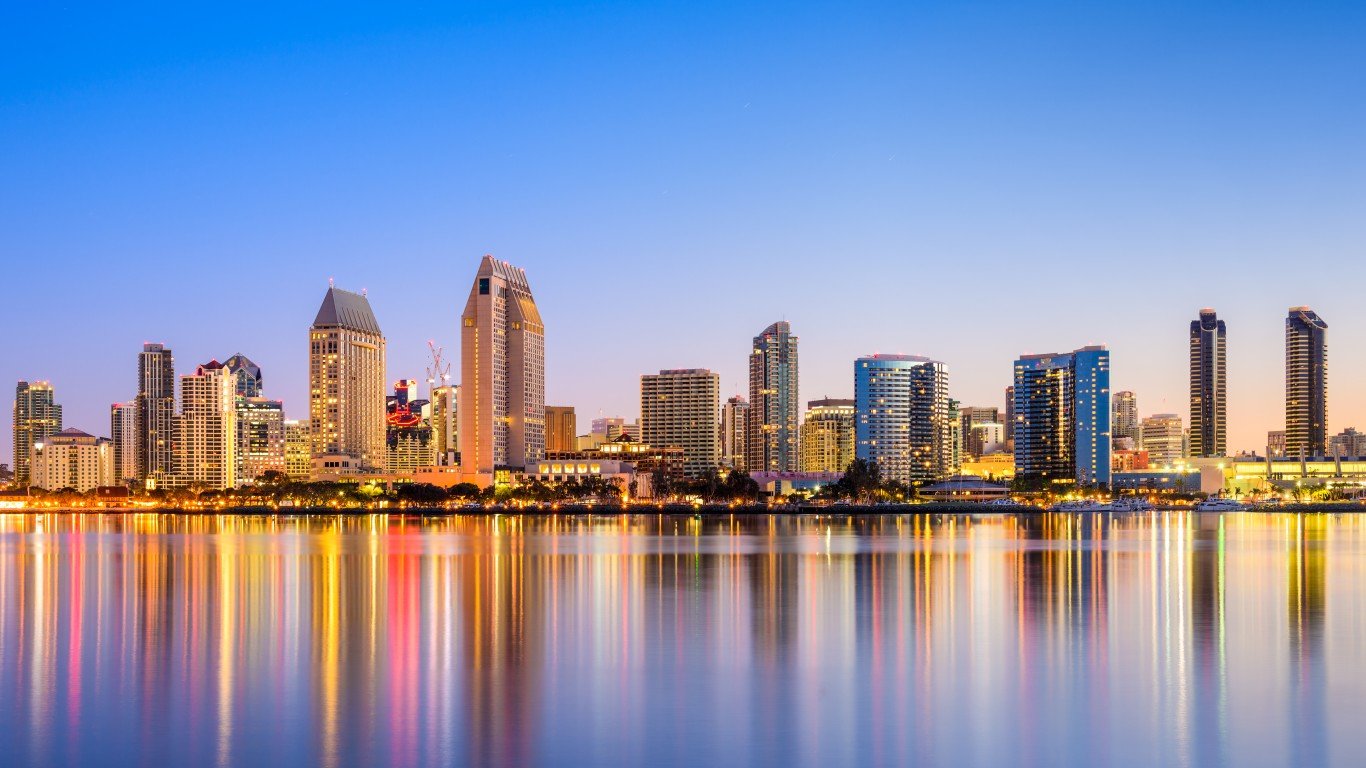
- “Creative class” as share of all jobs: 19.2%
- Avg. annual “creative class” wage: $121,209
- Avg. annual wage for all occupations: $71,080
- Most concentrated “creative class” job: Biological scientists; computer hardware engineers; biochemists and biophysicists
16. Baltimore-Columbia-Towson, MD
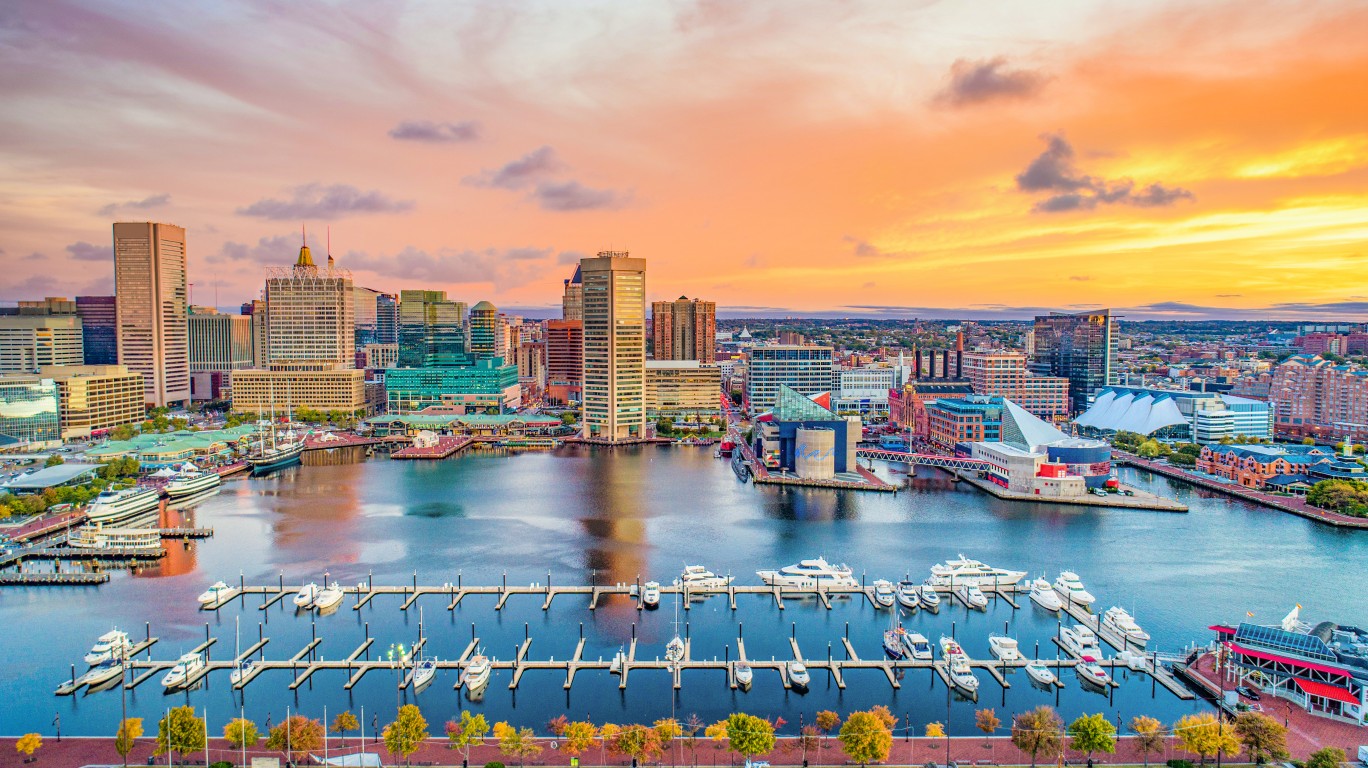
- “Creative class” as share of all jobs: 19.9%
- Avg. annual “creative class” wage: $113,597
- Avg. annual wage for all occupations: $68,620
- Most concentrated “creative class” job: Physical scientists; atmospheric and space scientists; information security analysts
15. Denver-Aurora-Lakewood, CO
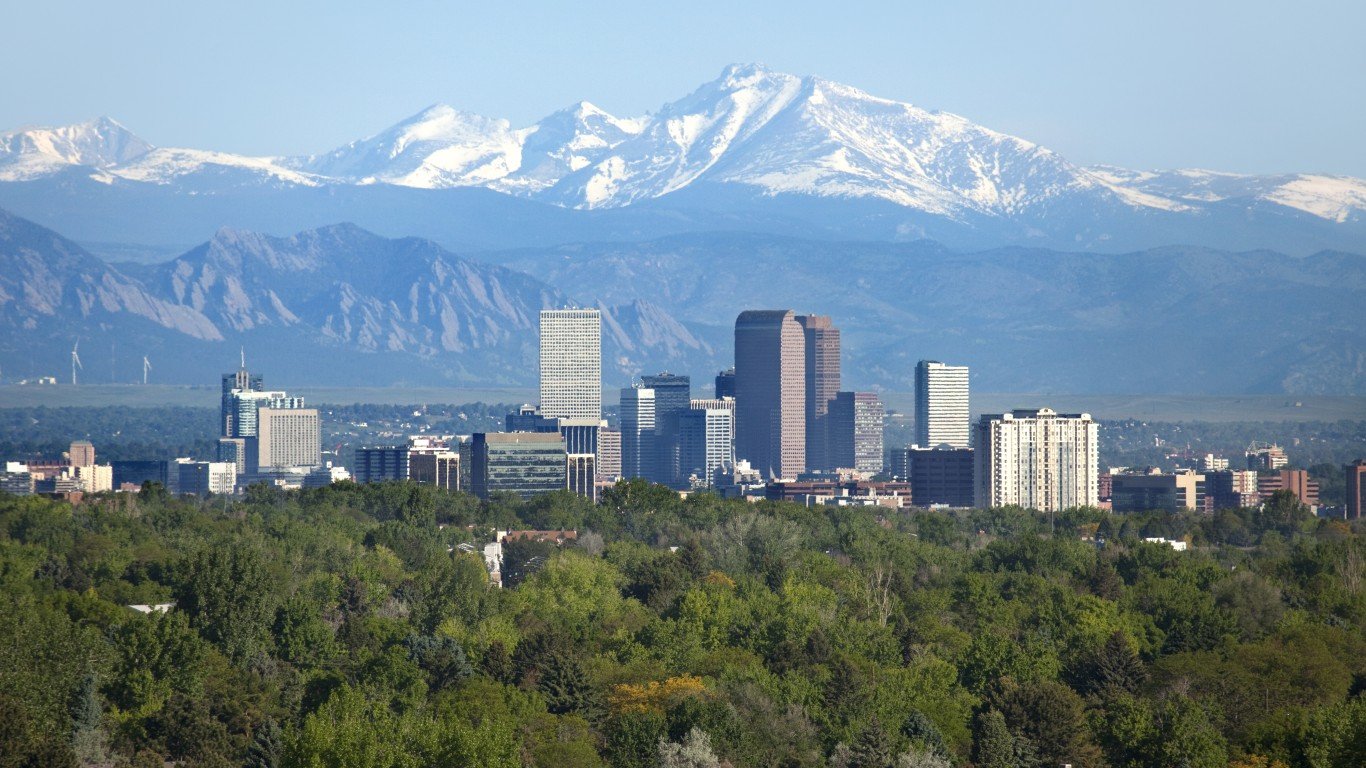
- “Creative class” as share of all jobs: 20.0%
- Avg. annual “creative class” wage: $117,727
- Avg. annual wage for all occupations: $71,790
- Most concentrated “creative class” job: Geoscientists, except hydrologists and geographers; cartographers and photogrammetrists; electronics engineers, except computer
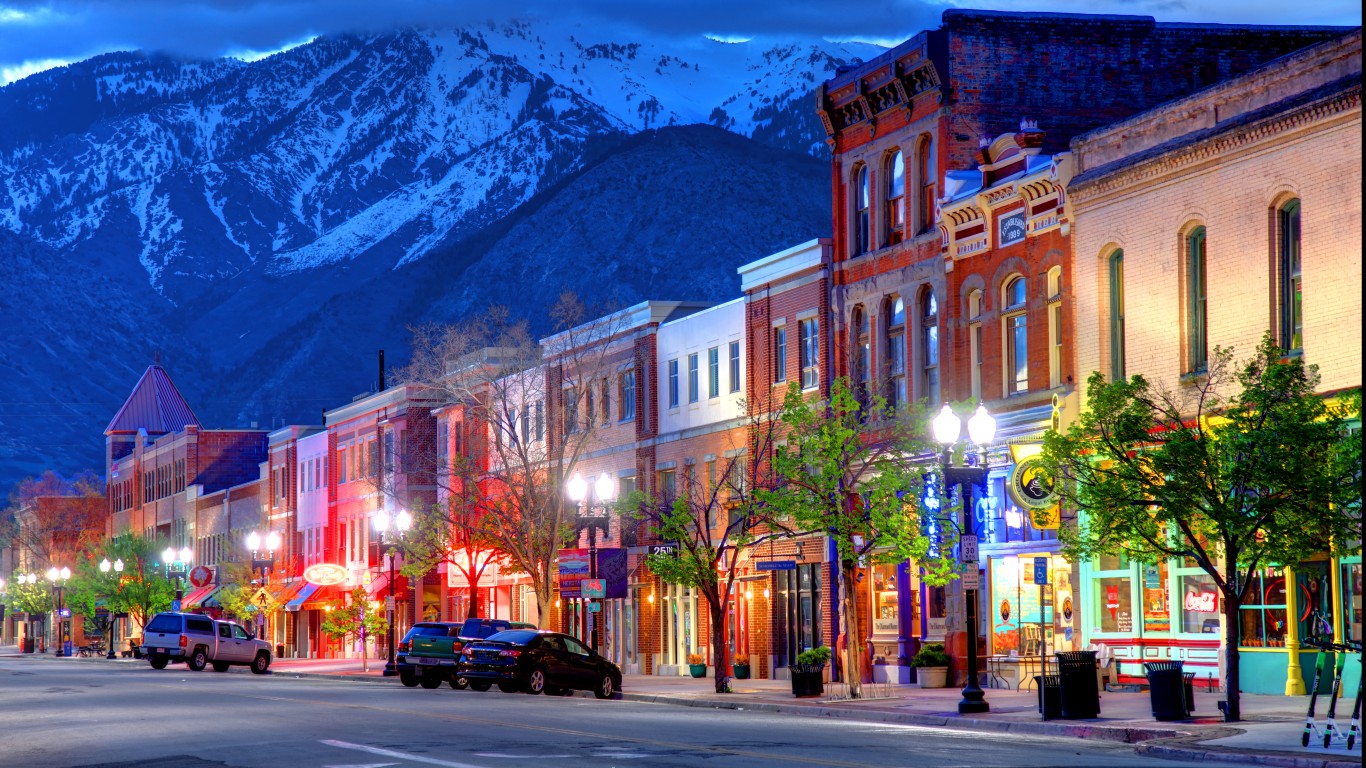
14. Salt Lake City, UT
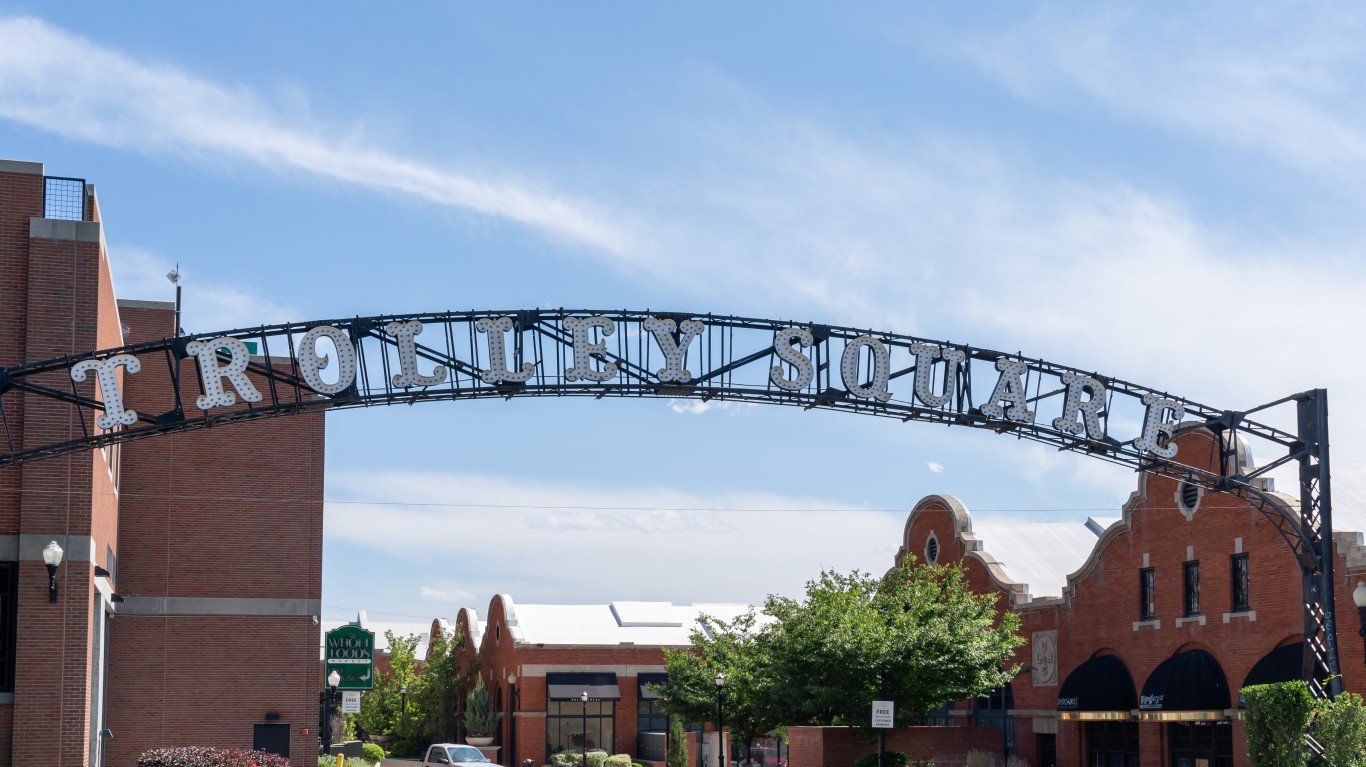
- “Creative class” as share of all jobs: 20.1%
- Avg. annual “creative class” wage: $101,218
- Avg. annual wage for all occupations: $61,970
- Most concentrated “creative class” job: Bioengineers and biomedical engineers; audio and video technicians; athletes and sports competitors
13. Raleigh, NC
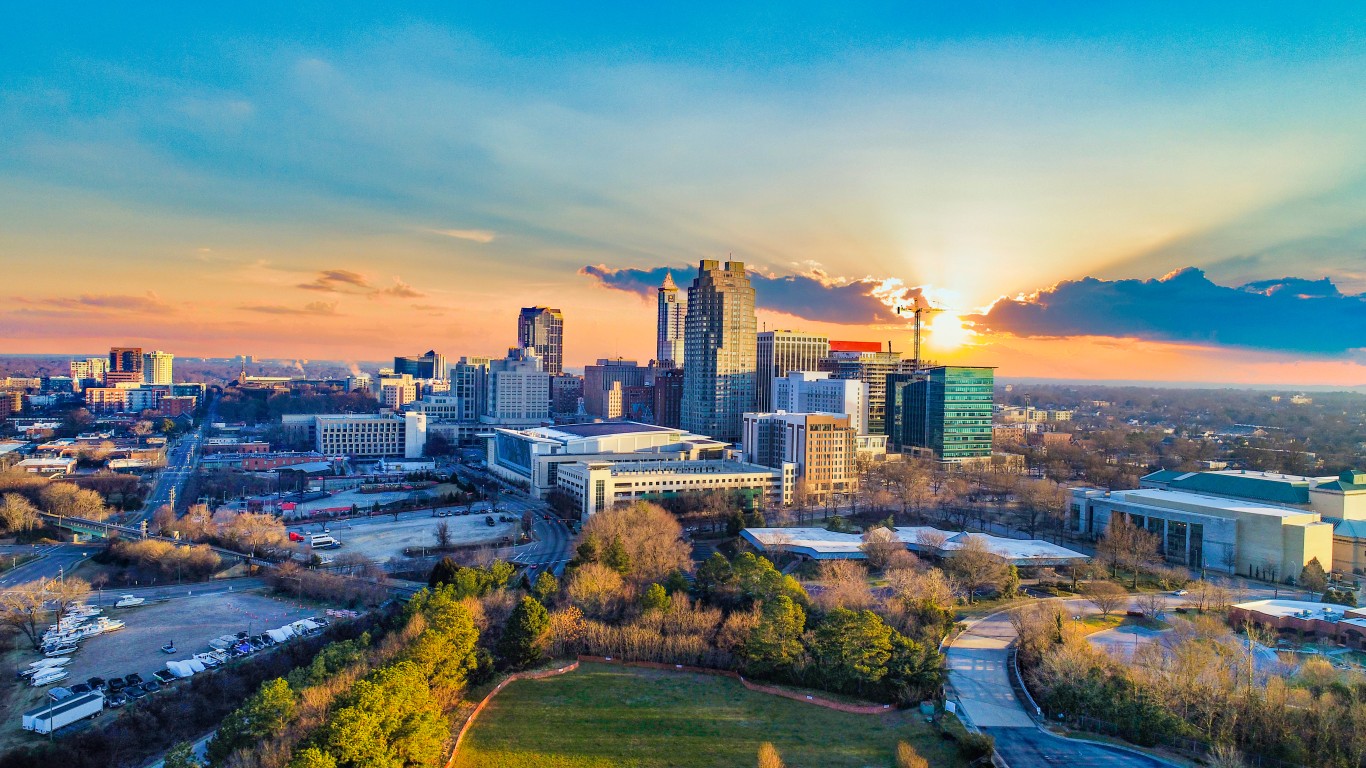
- “Creative class” as share of all jobs: 20.2%
- Avg. annual “creative class” wage: $107,597
- Avg. annual wage for all occupations: $62,500
- Most concentrated “creative class” job: Postsecondary social work teachers; soil and plant scientists; life scientists
12. Bridgeport-Stamford-Norwalk, CT
- “Creative class” as share of all jobs: 20.3%
- Avg. annual “creative class” wage: $134,854
- Avg. annual wage for all occupations: $76,410
- Most concentrated “creative class” job: Landscape architects; financial managers; editors
11. Seattle-Tacoma-Bellevue, WA
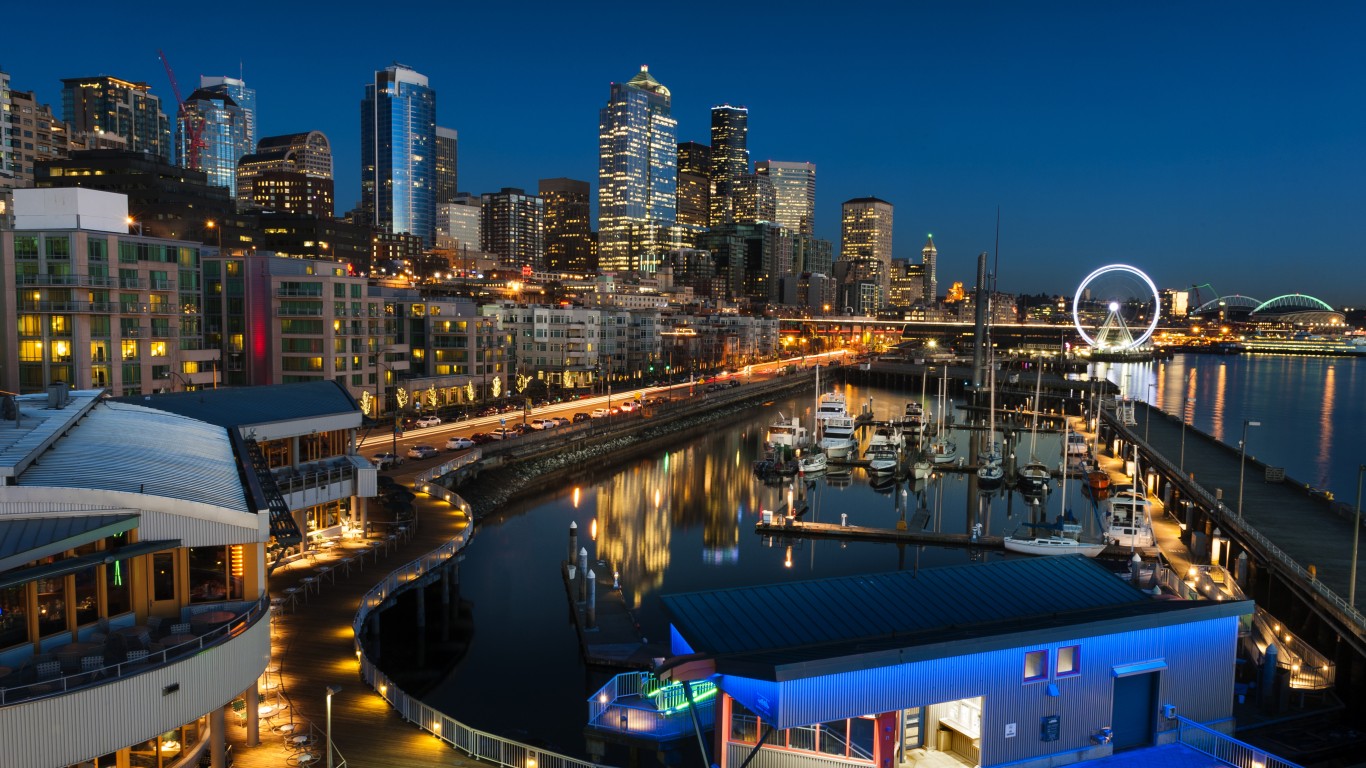
- “Creative class” as share of all jobs: 21.8%
- Avg. annual “creative class” wage: $129,088
- Avg. annual wage for all occupations: $80,020
- Most concentrated “creative class” job: Mathematical science occupations; special effects artists and animators; epidemiologists
10. Durham-Chapel Hill, NC
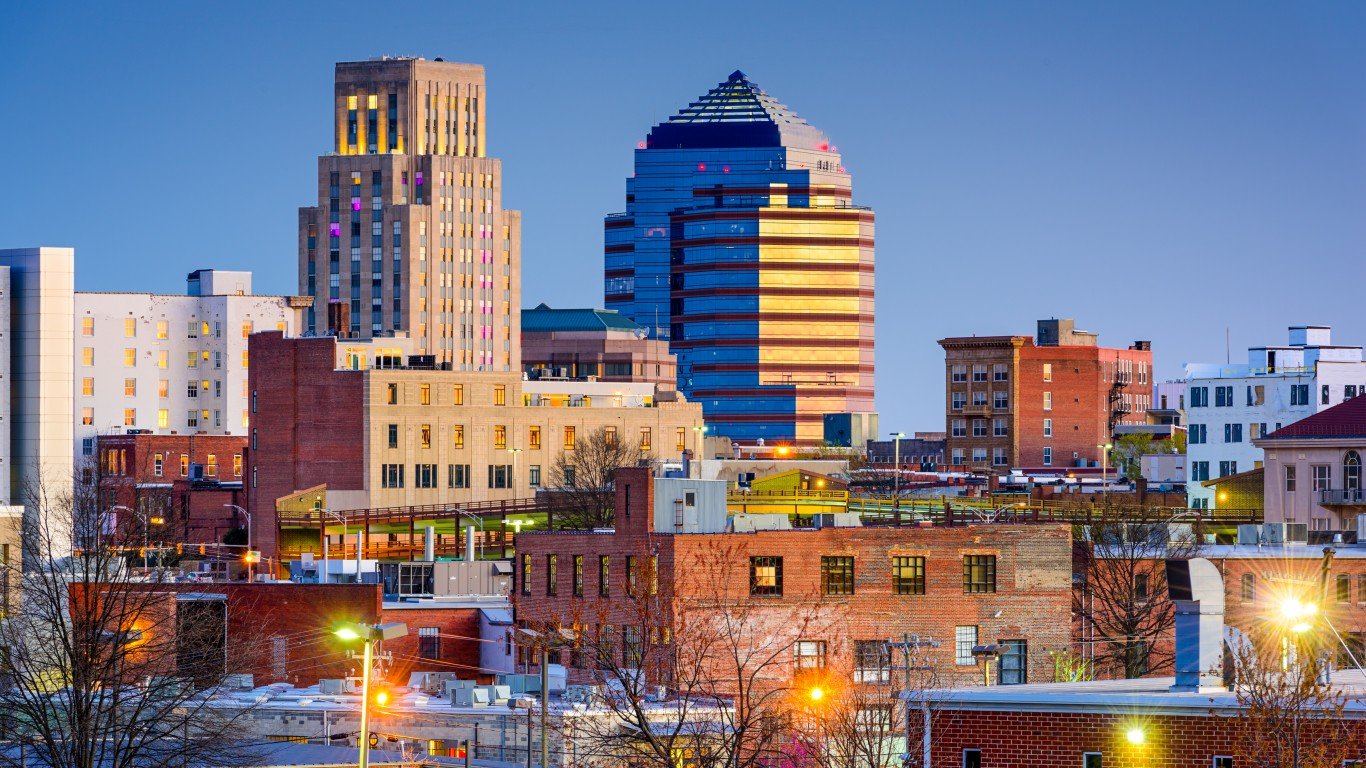
- “Creative class” as share of all jobs: 22.1%
- Avg. annual “creative class” wage: $118,789
- Avg. annual wage for all occupations: $71,720
- Most concentrated “creative class” job: Sociologists; life scientists; statisticians
9. Austin-Round Rock, TX
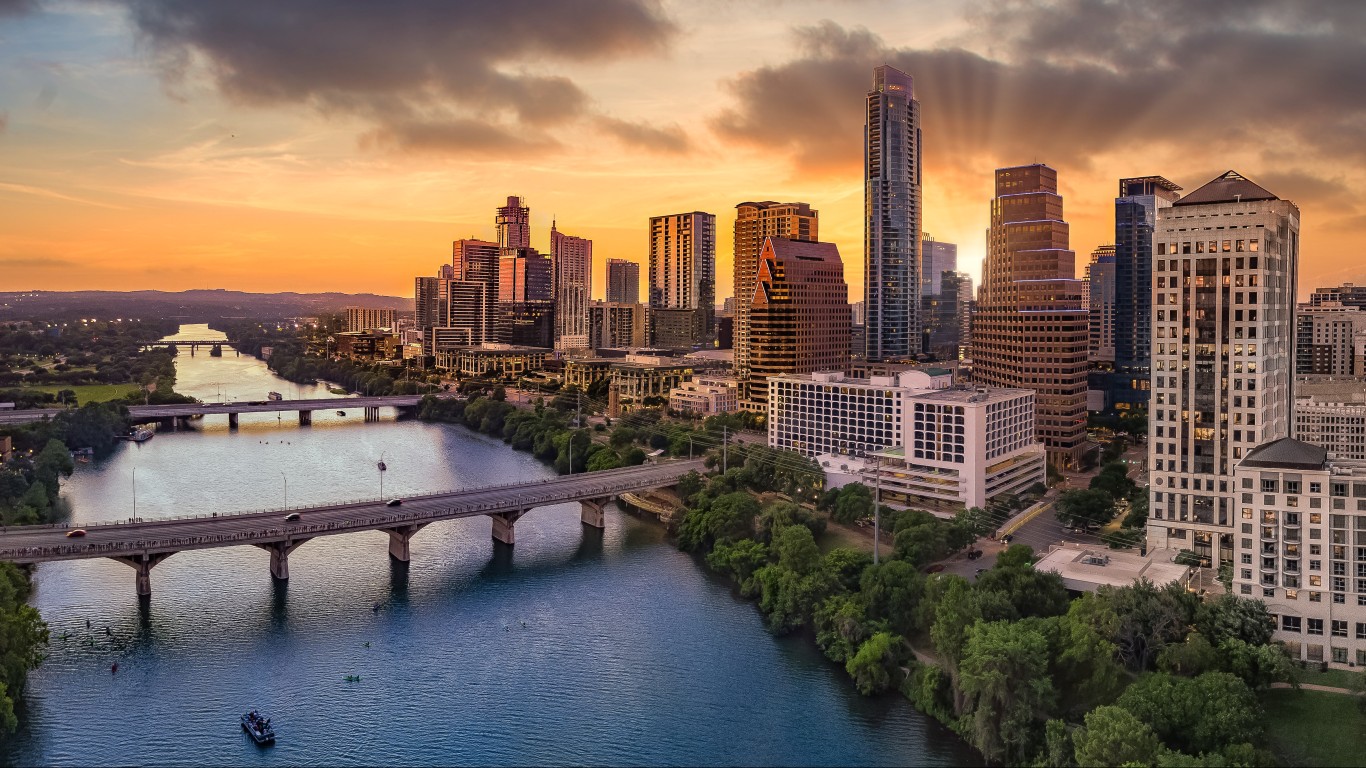
- “Creative class” as share of all jobs: 22.5%
- Avg. annual “creative class” wage: $108,298
- Avg. annual wage for all occupations: $63,890
- Most concentrated “creative class” job: Geoscientists, except hydrologists and geographers; computer occupations; sales engineers
8. Boston-Cambridge-Nashua, MA-NH
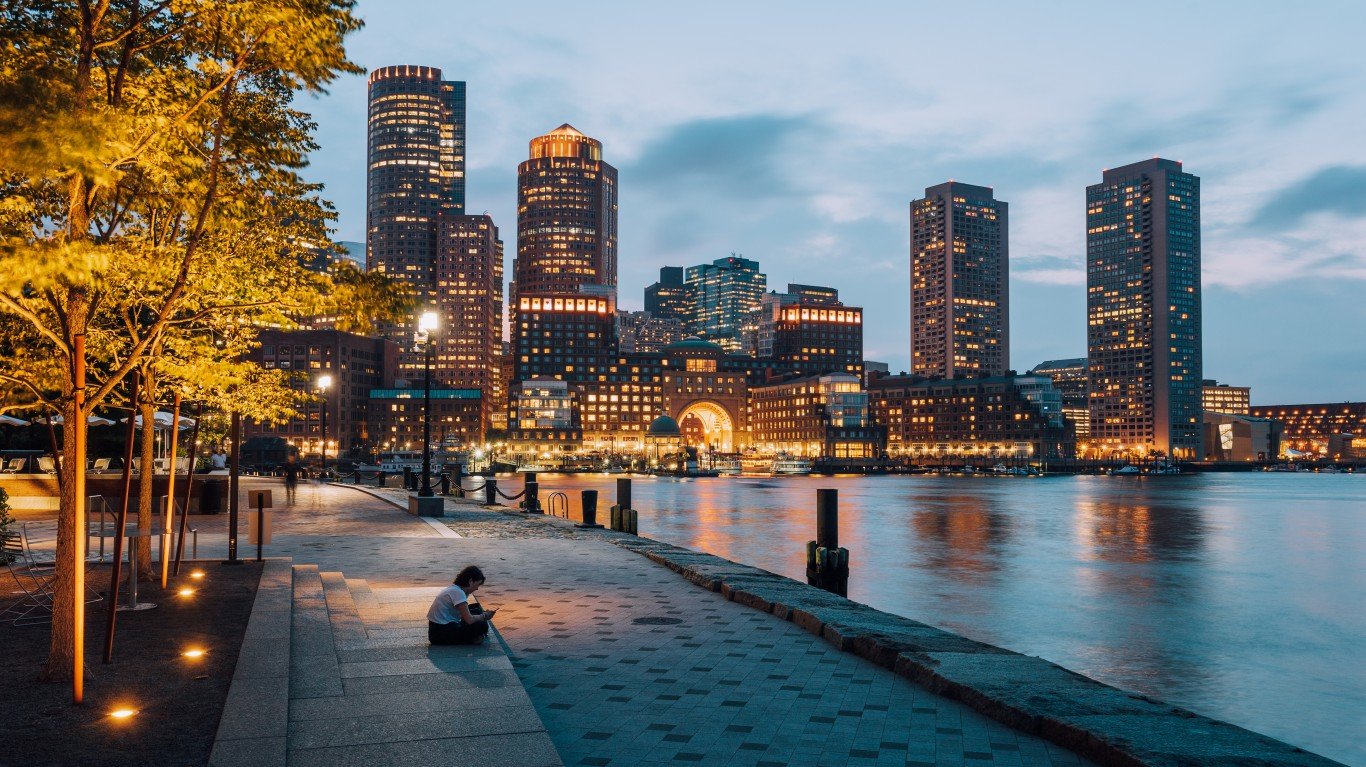
- “Creative class” as share of all jobs: 23.4%
- Avg. annual “creative class” wage: $130,809
- Avg. annual wage for all occupations: $80,810
- Most concentrated “creative class” job: Biochemists and biophysicists; microbiologists; medical scientists, except epidemiologists
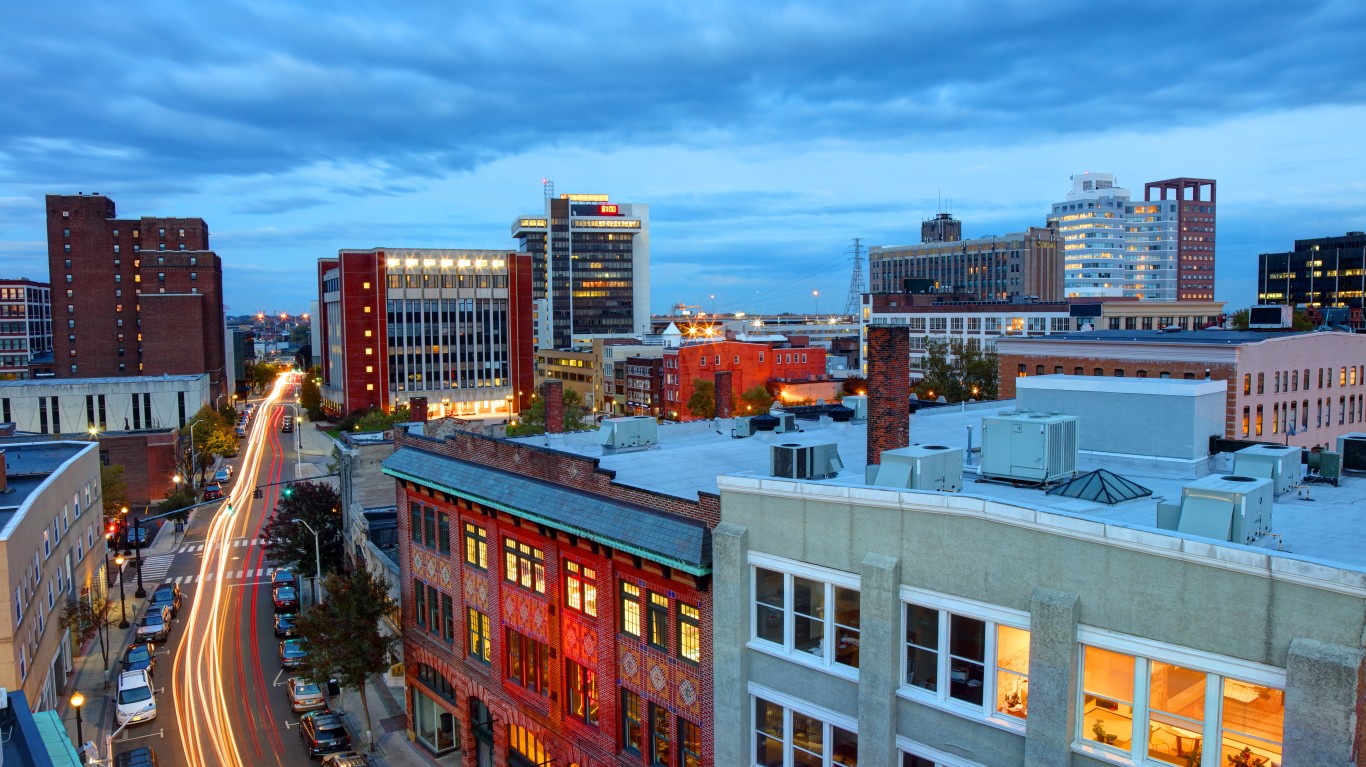
7. Trenton, NJ
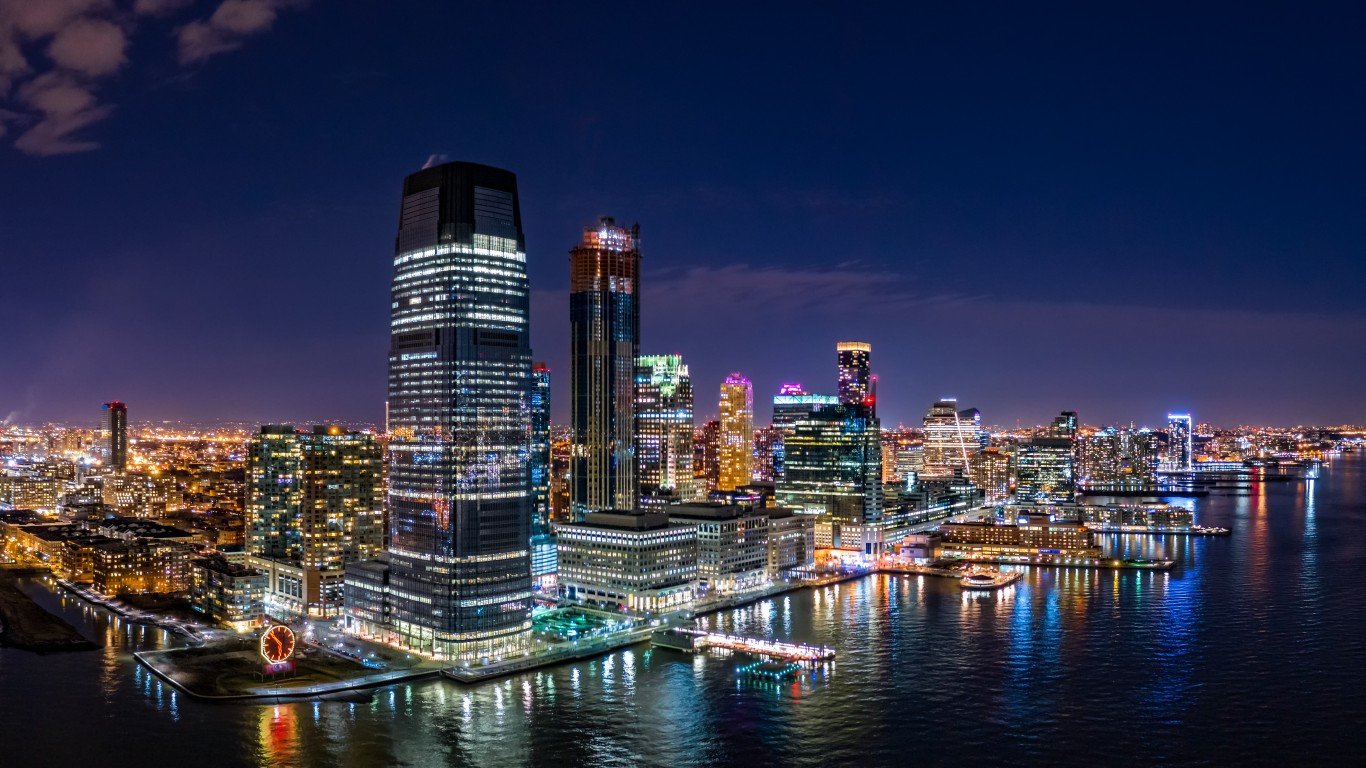
- “Creative class” as share of all jobs: 23.6%
- Avg. annual “creative class” wage: $126,968
- Avg. annual wage for all occupations: $75,100
- Most concentrated “creative class” job: Natural sciences managers; medical scientists, except epidemiologists; environmental scientists and specialists, including health
6. Huntsville, AL
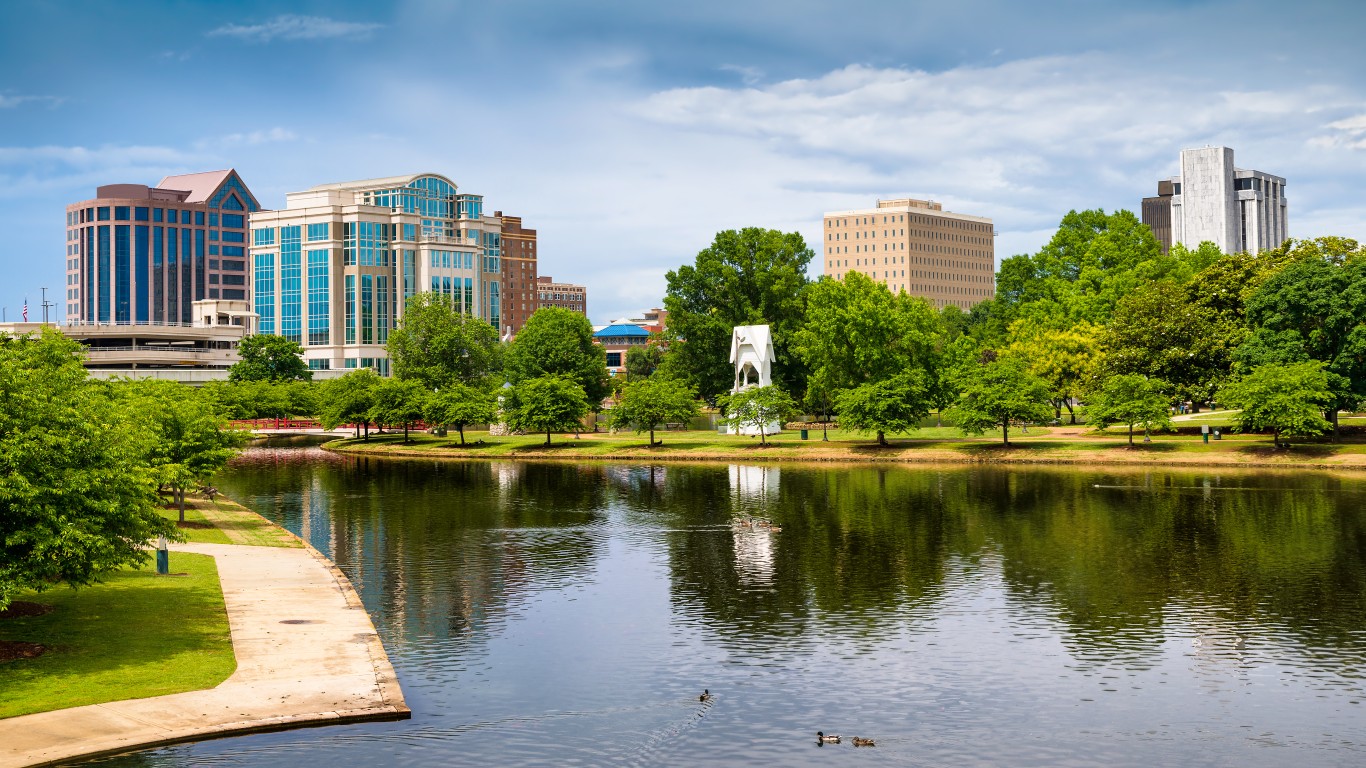
- “Creative class” as share of all jobs: 23.8%
- Avg. annual “creative class” wage: $110,918
- Avg. annual wage for all occupations: $63,790
- Most concentrated “creative class” job: Aerospace engineers; engineers; atmospheric and space scientists
5. San Francisco-Oakland-Hayward, CA
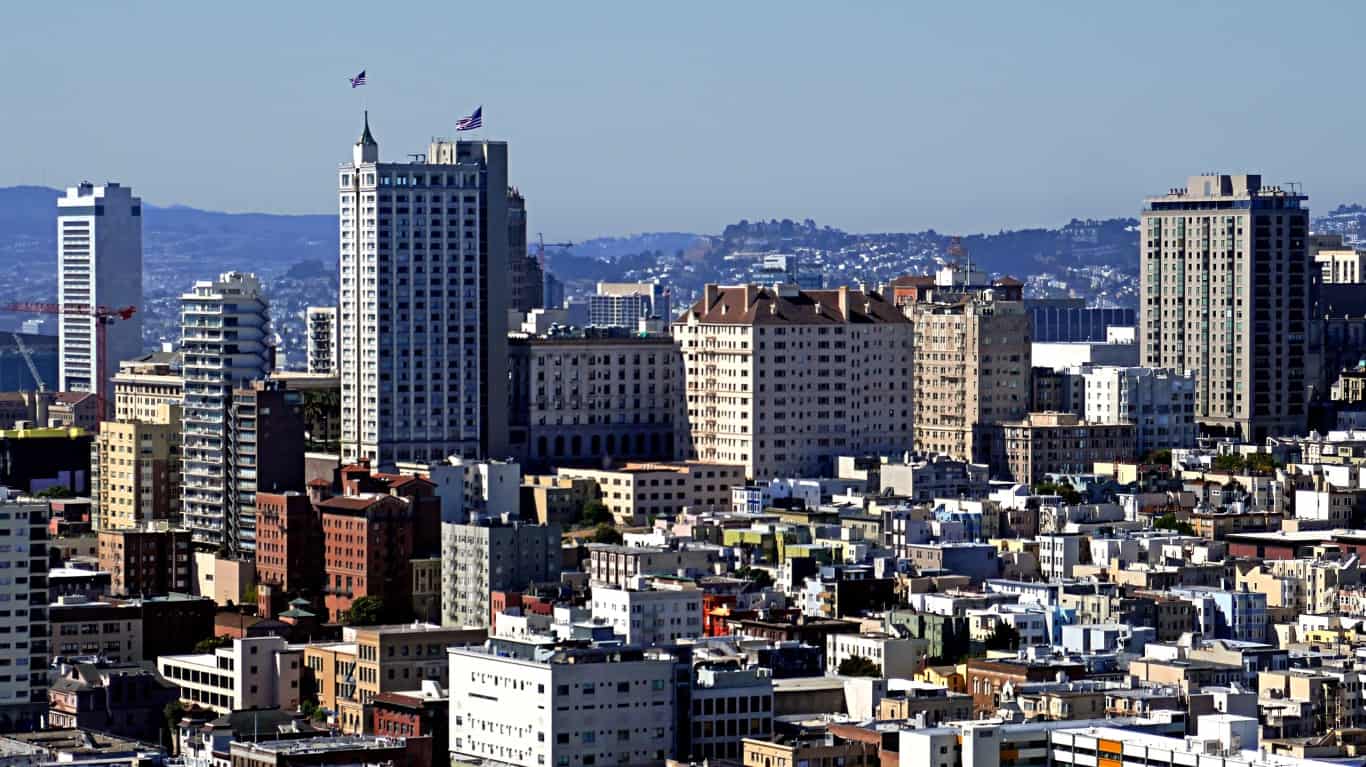
- “Creative class” as share of all jobs: 25.3%
- Avg. annual “creative class” wage: $158,176
- Avg. annual wage for all occupations: $94,370
- Most concentrated “creative class” job: Physicists; biochemists and biophysicists; biological scientists
4. California-Lexington Park, MD

- “Creative class” as share of all jobs: 26.4%
- Avg. annual “creative class” wage: $118,212
- Avg. annual wage for all occupations: $80,400
- Most concentrated “creative class” job: Aerospace engineers; computer and information research scientists; electronics engineers, except computer
3. Washington-Arlington-Alexandria, DC-VA-MD-WV

- “Creative class” as share of all jobs: 27.0%
- Avg. annual “creative class” wage: $135,108
- Avg. annual wage for all occupations: $83,900
- Most concentrated “creative class” job: Political scientists; economists; artists and related workers
2. Boulder, CO
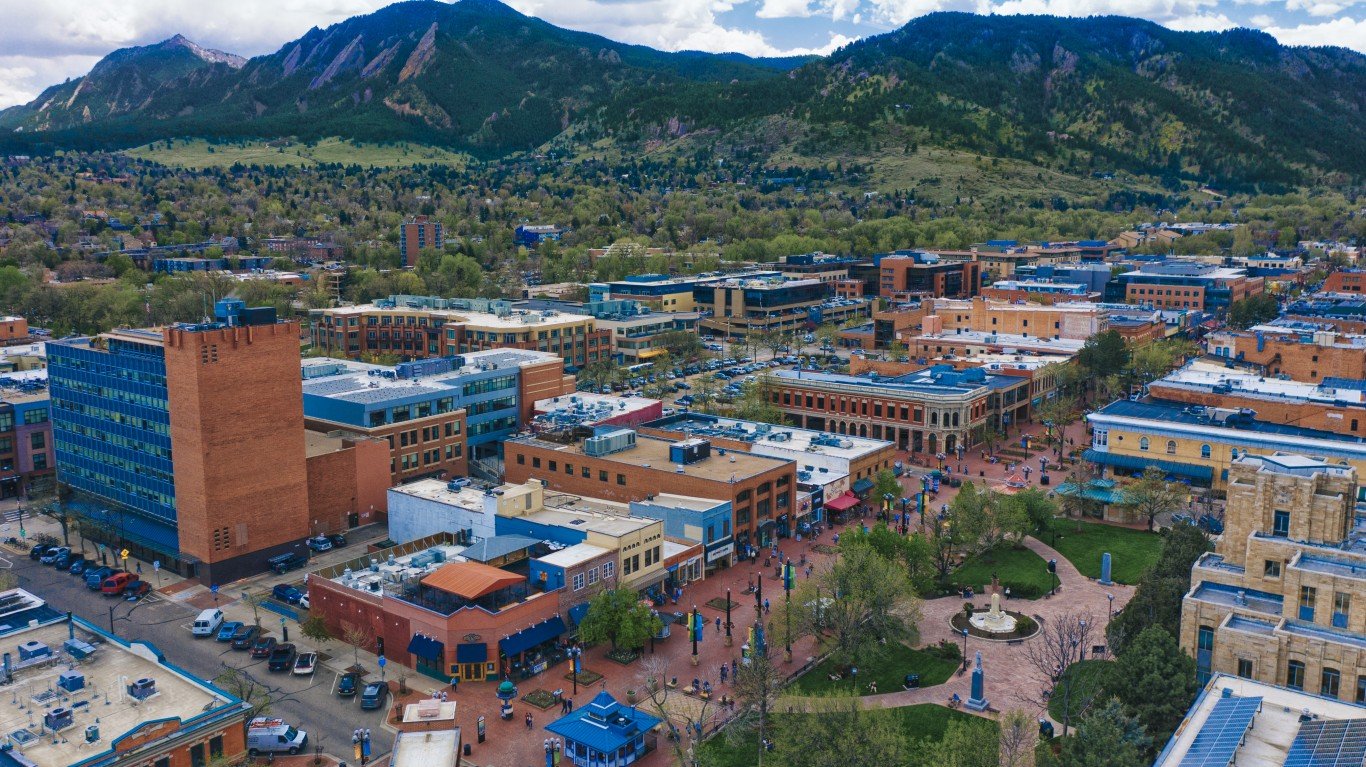
- “Creative class” as share of all jobs: 27.5%
- Avg. annual “creative class” wage: $125,303
- Avg. annual wage for all occupations: $81,530
- Most concentrated “creative class” job: Atmospheric and space scientists; physicists; aerospace engineers
1. San Jose-Sunnyvale-Santa Clara, CA
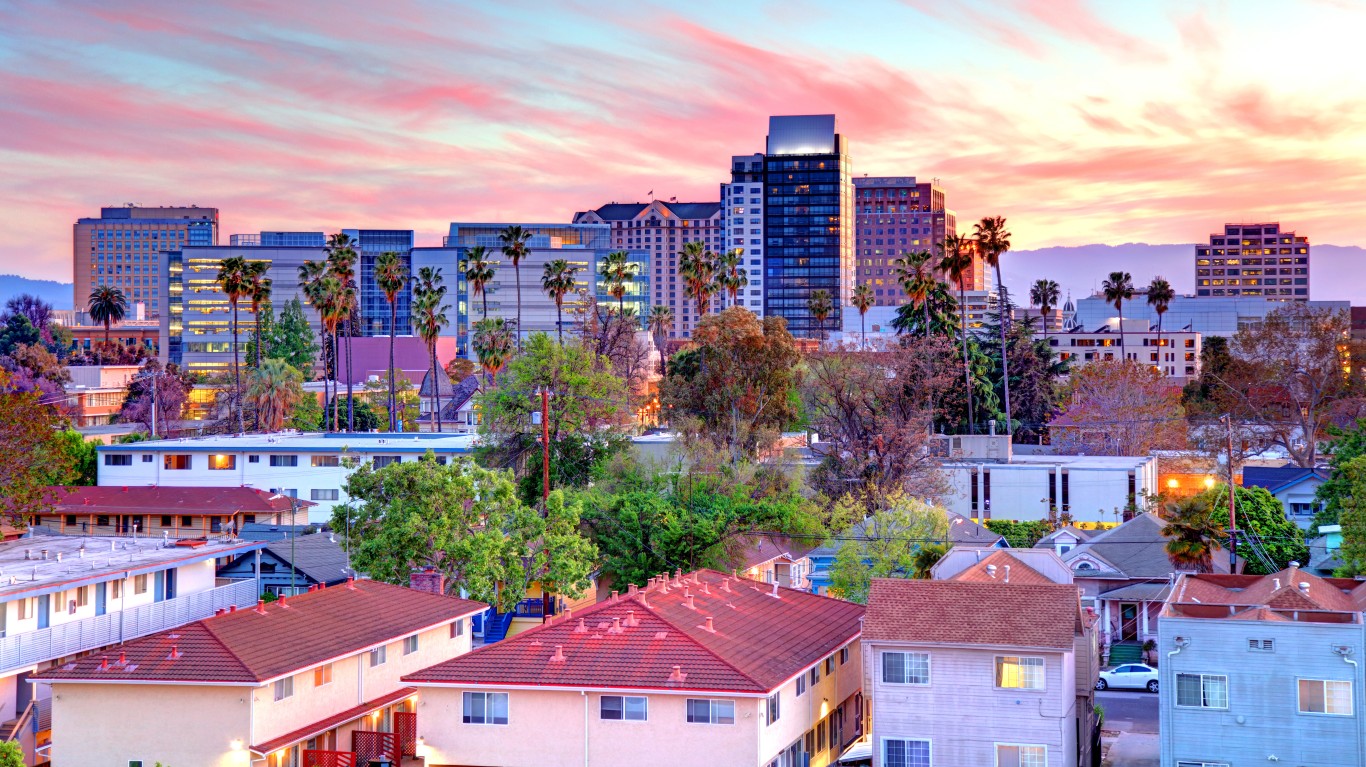
- “Creative class” as share of all jobs: 32.4%
- Avg. annual “creative class” wage: $191,391
- Avg. annual wage for all occupations: $112,460
- Most concentrated “creative class” job: Computer hardware engineers; sales engineers; computer and information research scientists
Methodology
To determine the cities with the largest creative classes, 24/7 Wall St. reviewed data on employment by detailed occupation from the Occupational Employment and Wage Statistics program of the Bureau of Labor Statistics. Metropolitan statistical areas were ranked based on employment within “creative class” occupations as a percentage of all occupations in 2022. The “creative class” includes scientists and engineers, university professors, artists, architects, and other creative occupations, and were formally classified within the federal Standard Occupation Classification system for detailed occupations by the Economic Research Service of the U.S. Department of Agriculture. Data used to calculate weighted average annual wage among “creative class” occupations, as well as the most concentrated “creative class” occupations — measured by location quotient — also came from the BLS OEWS.
Contact [email protected] for any questions or corrections.