[cnxvideo id=”1144055″ placement=”ros”]
More than 2.7 million COVID-19 cases have been confirmed in the U.S. as of July 2, as the death toll nears 130,000, by far the most cases and deaths of any country. Within the United States, the extent of the spread varies considerably from state to state, and even from county to county. As the number of daily new cases are declining in some parts of the U.S., they are spiking alarmingly in others, with a number of states putting their planned reopenings on pause.
Using data from state and local health departments, 24/7 Wall St. compiled and reviewed the average of new daily confirmed COVID-19 cases for the week ending June 29 and compared it to the average of new daily cases from the previous week to determine the county in each state where the virus is growing the fastest. We excluded counties with populations of fewer than 5,000 people, as well as those with fewer than 20 reported new cases in the past 14 days.
In the United States, the average number of new daily cases per capita has increased from 7.6 per 100,000 during the week ending June 22 to 10.5 per 100,000 in the week ending June 29, an increase of 2.9 daily new cases per 100,000 people. Some counties on this list reported relatively modest increases. In two states, all counties have recorded no meaningful change or decrease in daily new cases. At the other end of the spectrum, one county on this list reported an average of 139 daily new cases per 100,000 residents over the last week, up from an average of less than 10 per 100,000 the week before.
Generally, the counties on this list where new cases are increasing the fastest — not just in their state but also nationwide — are in states where the virus is also spreading the fastest, and vice versa. But there are some notable exceptions. In states like Washington and Oregon, where the average number of daily new cases has remained relatively flat, the counties on this list have all recorded increases of more than 10 new daily cases per 100,000 compared to the previous week. These are the states with the most and fewest COVID-19 cases.
Click here to see the counties in every state where COVID-19 is growing the fastest

Alabama: Marshall County
> Change in daily avg. new COVID-19 cases week over week: +13.7 per 100,000 people
> Avg. new daily cases in Marshall County in 7 days ending June 29: 43.5 per 100,000
> Avg. new daily cases in Marshall County in 7 days ending June 22: 29.9 per 100,000
> Avg. new daily cases in Alabama in 7 days ending June 29: 15.2 per 100,000 — 8th most
> Confirmed COVID-19 cases in Marshall County as of June 29: 1,527 per 100,000 people (total: 1,453)
> Population: 95,145
> Largest place in Marshall County: Albertville
[in-text-ad]
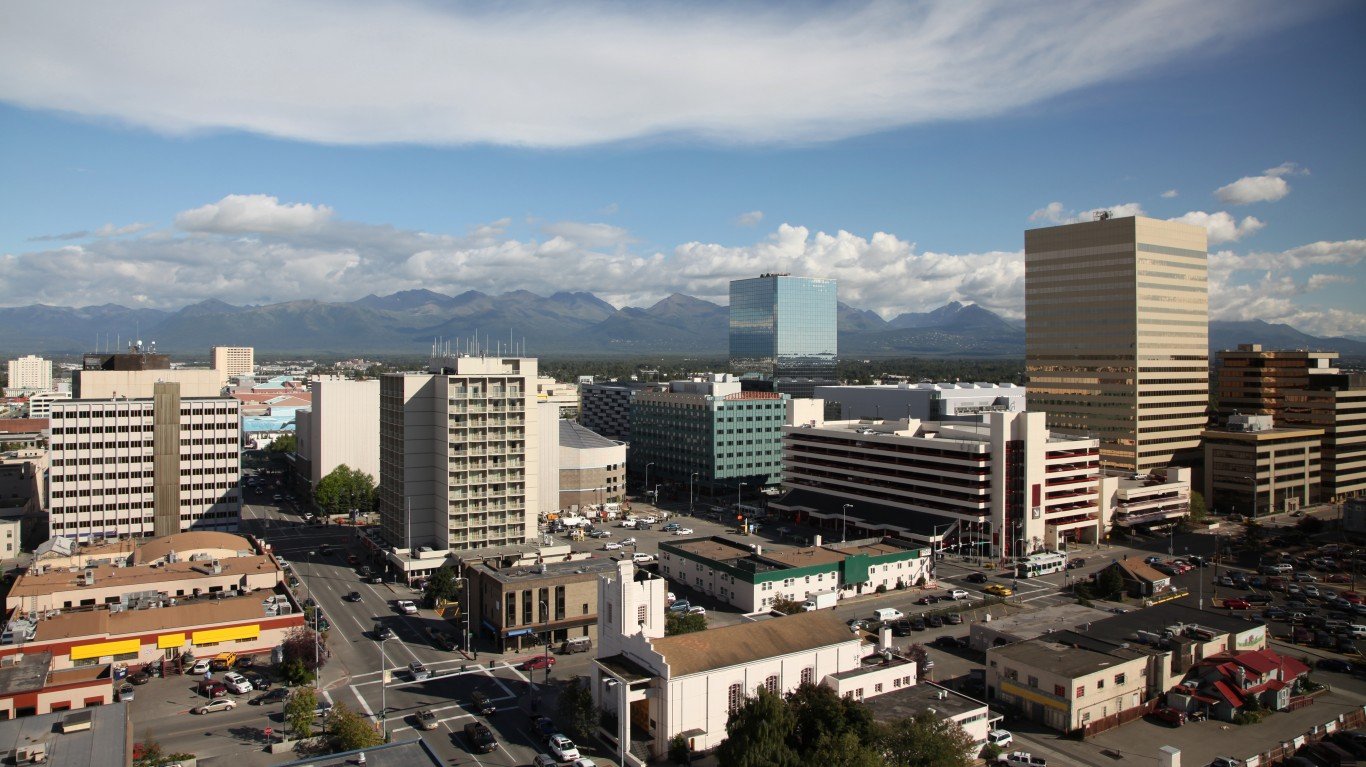
Alaska: Anchorage Municipality
> Change in daily avg. new COVID-19 cases week over week: +2.8 per 100,000 people
> Avg. new daily cases in Anchorage Municipality in 7 days ending June 29: 4.4 per 100,000
> Avg. new daily cases in Anchorage Municipality in 7 days ending June 22: 1.6 per 100,000
> Avg. new daily cases in Alaska in 7 days ending June 29: 2.2 per 100,000 — 8th fewest
> Confirmed COVID-19 cases in Anchorage Municipality as of June 29: 156 per 100,000 people (total: 463)
> Population: 296,112
> Largest place in Anchorage Municipality: Anchorage
[recirclink id=715663]

Arizona: Maricopa County
> Change in daily avg. new COVID-19 cases week over week: +13.5 per 100,000 people
> Avg. new daily cases in Maricopa County in 7 days ending June 29: 45.6 per 100,000
> Avg. new daily cases in Maricopa County in 7 days ending June 22: 32.1 per 100,000
> Avg. new daily cases in Arizona in 7 days ending June 29: 38.6 per 100,000 — the most
> Confirmed COVID-19 cases in Maricopa County as of June 29: 1,062 per 100,000 people (total: 45,178)
> Population: 4,253,913
> Largest place in Maricopa County: Phoenix

Arkansas: Hot Spring County
> Change in daily avg. new COVID-19 cases week over week: +129.2 per 100,000 people
> Avg. new daily cases in Hot Spring County in 7 days ending June 29: 138.9 per 100,000
> Avg. new daily cases in Hot Spring County in 7 days ending June 22: 9.7 per 100,000
> Avg. new daily cases in Arkansas in 7 days ending June 29: 19.0 per 100,000 — 5th most
> Confirmed COVID-19 cases in Hot Spring County as of June 29: 1,277 per 100,000 people (total: 428)
> Population: 33,520
> Largest place in Hot Spring County: Malvern
[in-text-ad-2]

California: Kings County
> Change in daily avg. new COVID-19 cases week over week: +57.4 per 100,000 people
> Avg. new daily cases in Kings County in 7 days ending June 29: 82.5 per 100,000
> Avg. new daily cases in Kings County in 7 days ending June 22: 25.0 per 100,000
> Avg. new daily cases in California in 7 days ending June 29: 12.7 per 100,000 — 12th most
> Confirmed COVID-19 cases in Kings County as of June 29: 1,519 per 100,000 people (total: 2,280)
> Population: 150,075
> Largest place in Kings County: Hanford
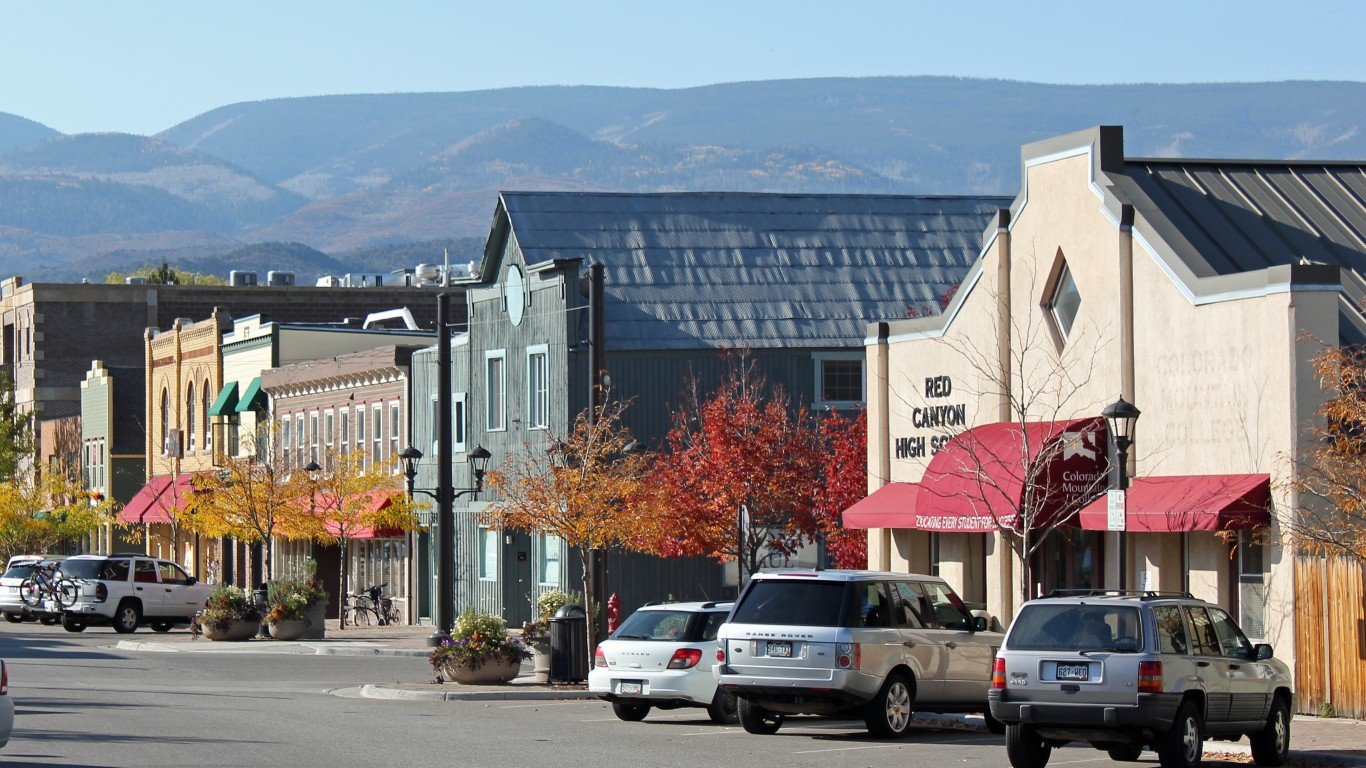
Colorado: Eagle County
> Change in daily avg. new COVID-19 cases week over week: +4.1 per 100,000 people
> Avg. new daily cases in Eagle County in 7 days ending June 29: 9.3 per 100,000
> Avg. new daily cases in Eagle County in 7 days ending June 22: 5.2 per 100,000
> Avg. new daily cases in Colorado in 7 days ending June 29: 3.8 per 100,000 — 14th fewest
> Confirmed COVID-19 cases in Eagle County as of June 29: 1,262 per 100,000 people (total: 686)
> Population: 54,357
> Largest place in Eagle County: Edwards CDP
[in-text-ad]
Connecticut: Litchfield County
> Change in daily avg. new COVID-19 cases week over week: +0.2 per 100,000 people
> Avg. new daily cases in Litchfield County in 7 days ending June 29: 1.6 per 100,000
> Avg. new daily cases in Litchfield County in 7 days ending June 22: 1.4 per 100,000
> Avg. new daily cases in Connecticut in 7 days ending June 29: 2.2 per 100,000 — 7th fewest
> Confirmed COVID-19 cases in Litchfield County as of June 29: 812 per 100,000 people (total: 1,487)
> Population: 183,031
> Largest place in Litchfield County: Torrington
[recirclink id=715584]

Delaware: Sussex County
> Change in daily avg. new COVID-19 cases week over week: +1.8 per 100,000 people
> Avg. new daily cases in Sussex County in 7 days ending June 29: 6.7 per 100,000
> Avg. new daily cases in Sussex County in 7 days ending June 22: 4.9 per 100,000
> Avg. new daily cases in Delaware in 7 days ending June 29: 7.1 per 100,000 — 20th most
> Confirmed COVID-19 cases in Sussex County as of June 29: 2,132 per 100,000 people (total: 4,681)
> Population: 219,540
> Largest place in Sussex County: Seaford

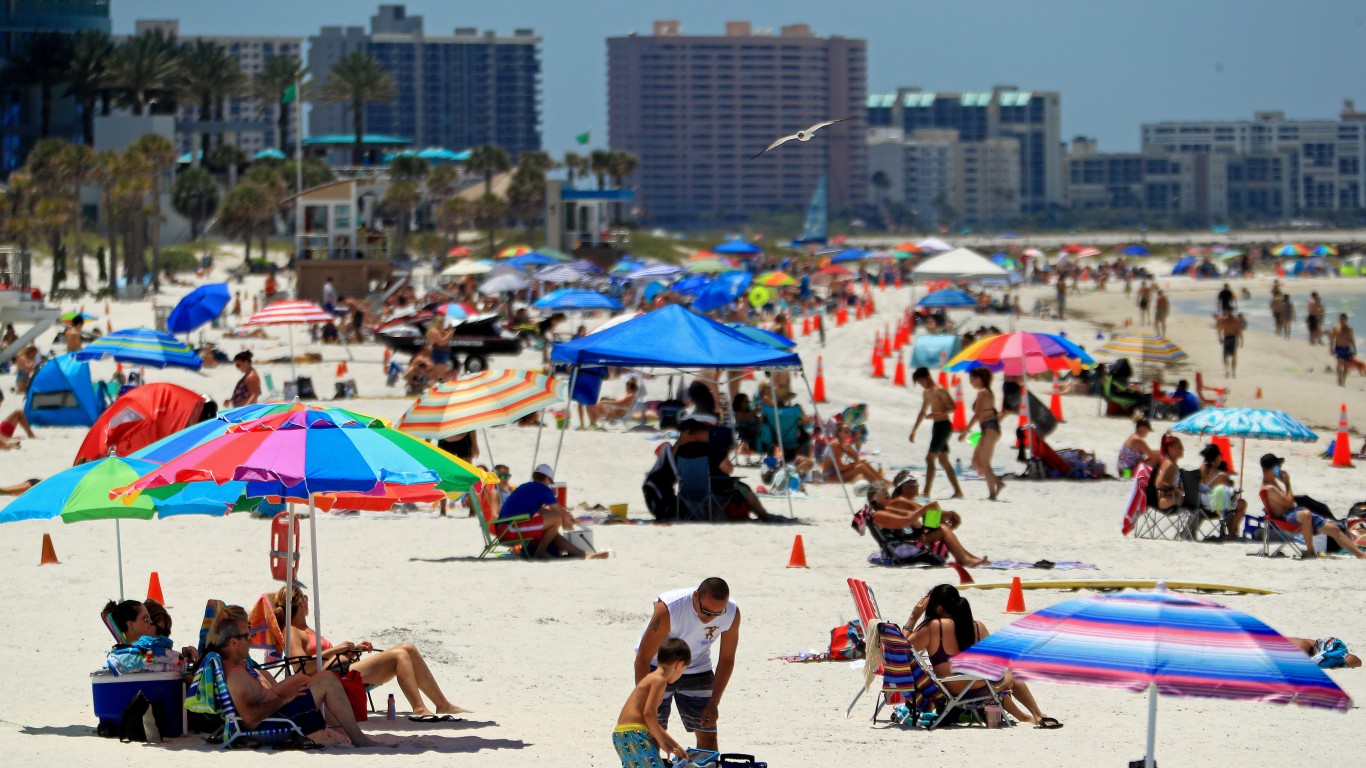
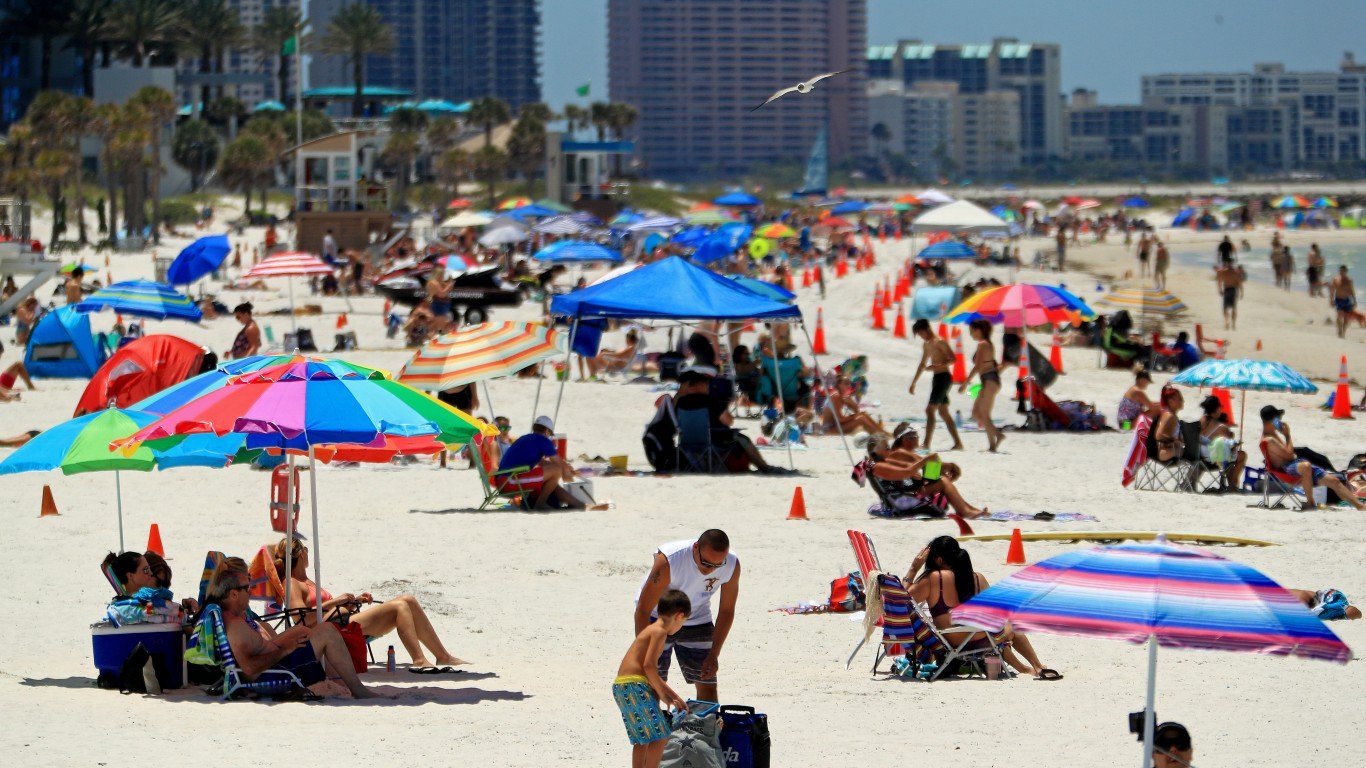
Florida: Holmes County
> Change in daily avg. new COVID-19 cases week over week: +70.2 per 100,000 people
> Avg. new daily cases in Holmes County in 7 days ending June 29: 78.3 per 100,000
> Avg. new daily cases in Holmes County in 7 days ending June 22: 8.1 per 100,000
> Avg. new daily cases in Florida in 7 days ending June 29: 23.0 per 100,000 — 2nd most
> Confirmed COVID-19 cases in Holmes County as of June 29: 829 per 100,000 people (total: 161)
> Population: 19,430
> Largest place in Holmes County: Bonifay
[in-text-ad-2]

Georgia: Glynn County
> Change in daily avg. new COVID-19 cases week over week: +28.1 per 100,000 people
> Avg. new daily cases in Glynn County in 7 days ending June 29: 40.3 per 100,000
> Avg. new daily cases in Glynn County in 7 days ending June 22: 12.3 per 100,000
> Avg. new daily cases in Georgia in 7 days ending June 29: 15.0 per 100,000 — 9th most
> Confirmed COVID-19 cases in Glynn County as of June 29: 651 per 100,000 people (total: 547)
> Population: 83,974
> Largest place in Glynn County: Brunswick

Hawaii: Honolulu County
> Change in daily avg. new COVID-19 cases week over week: +0.0 per 100,000 people
> Avg. new daily cases in Honolulu County in 7 days ending June 29: 1.0 per 100,000
> Avg. new daily cases in Honolulu County in 7 days ending June 22: 1.0 per 100,000
> Avg. new daily cases in Hawaii in 7 days ending June 29: 0.8 per 100,000 — the fewest
> Confirmed COVID-19 cases in Honolulu County as of June 29: 65 per 100,000 people (total: 638)
> Population: 987,638
> Largest place in Honolulu County: Honolulu CDP
[in-text-ad]
Idaho: Minidoka County
> Change in daily avg. new COVID-19 cases week over week: +22.5 per 100,000 people
> Avg. new daily cases in Minidoka County in 7 days ending June 29: 31.6 per 100,000
> Avg. new daily cases in Minidoka County in 7 days ending June 22: 9.1 per 100,000
> Avg. new daily cases in Idaho in 7 days ending June 29: 9.2 per 100,000 — 17th most
> Confirmed COVID-19 cases in Minidoka County as of June 29: 742 per 100,000 people (total: 153)
> Population: 20,615
> Largest place in Minidoka County: Rupert
[recirclink id=715247]

Illinois: Cass County
> Change in daily avg. new COVID-19 cases week over week: +16.6 per 100,000 people
> Avg. new daily cases in Cass County in 7 days ending June 29: 33.5 per 100,000
> Avg. new daily cases in Cass County in 7 days ending June 22: 16.9 per 100,000
> Avg. new daily cases in Illinois in 7 days ending June 29: 5.3 per 100,000 — 21st fewest
> Confirmed COVID-19 cases in Cass County as of June 29: 1,019 per 100,000 people (total: 129)
> Population: 12,665
> Largest place in Cass County: Beardstown

Indiana: Noble County
> Change in daily avg. new COVID-19 cases week over week: +3.1 per 100,000 people
> Avg. new daily cases in Noble County in 7 days ending June 29: 14.4 per 100,000
> Avg. new daily cases in Noble County in 7 days ending June 22: 11.3 per 100,000
> Avg. new daily cases in Indiana in 7 days ending June 29: 5.0 per 100,000 — 20th fewest
> Confirmed COVID-19 cases in Noble County as of June 29: 908 per 100,000 people (total: 431)
> Population: 47,451
> Largest place in Noble County: Kendallville
[in-text-ad-2]

Iowa: Pocahontas County
> Change in daily avg. new COVID-19 cases week over week: +25.1 per 100,000 people
> Avg. new daily cases in Pocahontas County in 7 days ending June 29: 37.6 per 100,000
> Avg. new daily cases in Pocahontas County in 7 days ending June 22: 12.4 per 100,000
> Avg. new daily cases in Iowa in 7 days ending June 29: 11.0 per 100,000 — 15th most
> Confirmed COVID-19 cases in Pocahontas County as of June 29: 1,015 per 100,000 people (total: 70)
> Population: 6,898
> Largest place in Pocahontas County: Pocahontas

Kansas: Grant County
> Change in daily avg. new COVID-19 cases week over week: +24.4 per 100,000 people
> Avg. new daily cases in Grant County in 7 days ending June 29: 29.5 per 100,000
> Avg. new daily cases in Grant County in 7 days ending June 22: 5.1 per 100,000
> Avg. new daily cases in Kansas in 7 days ending June 29: 6.4 per 100,000 — 22nd most
> Confirmed COVID-19 cases in Grant County as of June 29: 512 per 100,000 people (total: 39)
> Population: 7,616
> Largest place in Grant County: Ulysses
[in-text-ad]

Kentucky: Knox County
> Change in daily avg. new COVID-19 cases week over week: +9.9 per 100,000 people
> Avg. new daily cases in Knox County in 7 days ending June 29: 10.8 per 100,000
> Avg. new daily cases in Knox County in 7 days ending June 22: 0.9 per 100,000
> Avg. new daily cases in Kentucky in 7 days ending June 29: 4.6 per 100,000 — 17th fewest
> Confirmed COVID-19 cases in Knox County as of June 29: 203 per 100,000 people (total: 64)
> Population: 31,467
> Largest place in Knox County: Corbin
[recirclink id=714364]
Louisiana: East Carroll Parish
> Change in daily avg. new COVID-19 cases week over week: +122.3 per 100,000 people
> Avg. new daily cases in East Carroll Parish in 7 days ending June 29: 243.5 per 100,000
> Avg. new daily cases in East Carroll Parish in 7 days ending June 22: 121.2 per 100,000
> Avg. new daily cases in Louisiana in 7 days ending June 29: 16.4 per 100,000 — 7th most
> Confirmed COVID-19 cases in East Carroll Parish as of June 29: 5,979 per 100,000 people (total: 432)
> Population: 7,225
> Largest place in East Carroll Parish: Lake Providence
Maine: York County
> Change in daily avg. new COVID-19 cases week over week: +1.0 per 100,000 people
> Avg. new daily cases in York County in 7 days ending June 29: 2.4 per 100,000
> Avg. new daily cases in York County in 7 days ending June 22: 1.4 per 100,000
> Avg. new daily cases in Maine in 7 days ending June 29: 2.1 per 100,000 — 6th fewest
> Confirmed COVID-19 cases in York County as of June 29: 246 per 100,000 people (total: 499)
> Population: 203,102
> Largest place in York County: Biddeford
[in-text-ad-2]
Maryland: Caroline County
> Change in daily avg. new COVID-19 cases week over week: +4.2 per 100,000 people
> Avg. new daily cases in Caroline County in 7 days ending June 29: 8.3 per 100,000
> Avg. new daily cases in Caroline County in 7 days ending June 22: 4.0 per 100,000
> Avg. new daily cases in Maryland in 7 days ending June 29: 6.0 per 100,000 — 25th fewest
> Confirmed COVID-19 cases in Caroline County as of June 29: 967 per 100,000 people (total: 318)
> Population: 32,875
> Largest place in Caroline County: Denton

Massachusetts: Hampden County
> Change in daily avg. new COVID-19 cases week over week: +0.4 per 100,000 people
> Avg. new daily cases in Hampden County in 7 days ending June 29: 4.1 per 100,000
> Avg. new daily cases in Hampden County in 7 days ending June 22: 3.7 per 100,000
> Avg. new daily cases in Massachusetts in 7 days ending June 29: 3.1 per 100,000 — 10th fewest
> Confirmed COVID-19 cases in Hampden County as of June 29: 1,442 per 100,000 people (total: 6,765)
> Population: 469,116
> Largest place in Hampden County: Springfield
[in-text-ad]

Michigan: Oceana County
> Change in daily avg. new COVID-19 cases week over week: +19.3 per 100,000 people
> Avg. new daily cases in Oceana County in 7 days ending June 29: 43.7 per 100,000
> Avg. new daily cases in Oceana County in 7 days ending June 22: 24.4 per 100,000
> Avg. new daily cases in Michigan in 7 days ending June 29: 3.1 per 100,000 — 9th fewest
> Confirmed COVID-19 cases in Oceana County as of June 29: 996 per 100,000 people (total: 263)
> Population: 26,417
> Largest place in Oceana County: Hart
[recirclink id=713961]

Minnesota: Watonwan County
> Change in daily avg. new COVID-19 cases week over week: +29.0 per 100,000 people
> Avg. new daily cases in Watonwan County in 7 days ending June 29: 74.0 per 100,000
> Avg. new daily cases in Watonwan County in 7 days ending June 22: 45.0 per 100,000
> Avg. new daily cases in Minnesota in 7 days ending June 29: 6.5 per 100,000 — 21st most
> Confirmed COVID-19 cases in Watonwan County as of June 29: 1,823 per 100,000 people (total: 200)
> Population: 10,973
> Largest place in Watonwan County: St. James

Mississippi: Claiborne County
> Change in daily avg. new COVID-19 cases week over week: +63.1 per 100,000 people
> Avg. new daily cases in Claiborne County in 7 days ending June 29: 82.1 per 100,000
> Avg. new daily cases in Claiborne County in 7 days ending June 22: 19.0 per 100,000
> Avg. new daily cases in Mississippi in 7 days ending June 29: 19.3 per 100,000 — 4th most
> Confirmed COVID-19 cases in Claiborne County as of June 29: 2,412 per 100,000 people (total: 220)
> Population: 9,120
> Largest place in Claiborne County: Port Gibson
[in-text-ad-2]

Missouri: McDonald County
> Change in daily avg. new COVID-19 cases week over week: +80.3 per 100,000 people
> Avg. new daily cases in McDonald County in 7 days ending June 29: 166.8 per 100,000
> Avg. new daily cases in McDonald County in 7 days ending June 22: 86.5 per 100,000
> Avg. new daily cases in Missouri in 7 days ending June 29: 5.6 per 100,000 — 22nd fewest
> Confirmed COVID-19 cases in McDonald County as of June 29: 2,182 per 100,000 people (total: 498)
> Population: 22,827
> Largest place in McDonald County: Anderson
Montana: Big Horn County
> Change in daily avg. new COVID-19 cases week over week: +6.3 per 100,000 people
> Avg. new daily cases in Big Horn County in 7 days ending June 29: 17.4 per 100,000
> Avg. new daily cases in Big Horn County in 7 days ending June 22: 11.1 per 100,000
> Avg. new daily cases in Montana in 7 days ending June 29: 2.0 per 100,000 — 4th fewest
> Confirmed COVID-19 cases in Big Horn County as of June 29: 546 per 100,000 people (total: 73)
> Population: 13,376
> Largest place in Big Horn County: Hardin
[in-text-ad]

Nebraska: Dakota County
> Change in daily avg. new COVID-19 cases week over week: +1.4 per 100,000 people
> Avg. new daily cases in Dakota County in 7 days ending June 29: 12.2 per 100,000
> Avg. new daily cases in Dakota County in 7 days ending June 22: 10.7 per 100,000
> Avg. new daily cases in Nebraska in 7 days ending June 29: 7.6 per 100,000 — 18th most
> Confirmed COVID-19 cases in Dakota County as of June 29: 8,663 per 100,000 people (total: 1,760)
> Population: 20,317
> Largest place in Dakota County: South Sioux City
[recirclink id=715663]

Nevada: Clark County
> Change in daily avg. new COVID-19 cases week over week: +6.5 per 100,000 people
> Avg. new daily cases in Clark County in 7 days ending June 29: 17.5 per 100,000
> Avg. new daily cases in Clark County in 7 days ending June 22: 11.0 per 100,000
> Avg. new daily cases in Nevada in 7 days ending June 29: 14.4 per 100,000 — 11th most
> Confirmed COVID-19 cases in Clark County as of June 29: 650 per 100,000 people (total: 13,910)
> Population: 2,141,574
> Largest place in Clark County: Las Vegas

New Hampshire: Rockingham County
> Change in daily avg. new COVID-19 cases week over week: +0.2 per 100,000 people
> Avg. new daily cases in Rockingham County in 7 days ending June 29: 1.3 per 100,000
> Avg. new daily cases in Rockingham County in 7 days ending June 22: 1.1 per 100,000
> Avg. new daily cases in New Hampshire in 7 days ending June 29: 2.0 per 100,000 — 3rd fewest
> Confirmed COVID-19 cases in Rockingham County as of June 29: 482 per 100,000 people (total: 1,470)
> Population: 305,129
> Largest place in Rockingham County: Derry CDP
[in-text-ad-2]
New Jersey: Gloucester County
> Change in daily avg. new COVID-19 cases week over week: +0.8 per 100,000 people
> Avg. new daily cases in Gloucester County in 7 days ending June 29: 4.0 per 100,000
> Avg. new daily cases in Gloucester County in 7 days ending June 22: 3.2 per 100,000
> Avg. new daily cases in New Jersey in 7 days ending June 29: 3.3 per 100,000 — 12th fewest
> Confirmed COVID-19 cases in Gloucester County as of June 29: 881 per 100,000 people (total: 2,563)
> Population: 290,852
> Largest place in Gloucester County: Glassboro

New Mexico: McKinley County
> Change in daily avg. new COVID-19 cases week over week: +15.8 per 100,000 people
> Avg. new daily cases in McKinley County in 7 days ending June 29: 47.5 per 100,000
> Avg. new daily cases in McKinley County in 7 days ending June 22: 31.7 per 100,000
> Avg. new daily cases in New Mexico in 7 days ending June 29: 7.5 per 100,000 — 19th most
> Confirmed COVID-19 cases in McKinley County as of June 29: 4,594 per 100,000 people (total: 3,347)
> Population: 72,849
> Largest place in McKinley County: Gallup
[in-text-ad]

New York: Herkimer County
> Change in daily avg. new COVID-19 cases week over week: +2.5 per 100,000 people
> Avg. new daily cases in Herkimer County in 7 days ending June 29: 3.7 per 100,000
> Avg. new daily cases in Herkimer County in 7 days ending June 22: 1.2 per 100,000
> Avg. new daily cases in New York in 7 days ending June 29: 3.2 per 100,000 — 11th fewest
> Confirmed COVID-19 cases in Herkimer County as of June 29: 253 per 100,000 people (total: 158)
> Population: 62,505
> Largest place in Herkimer County: Ilion
[recirclink id=715584]

North Carolina: Stanly County
> Change in daily avg. new COVID-19 cases week over week: +13.3 per 100,000 people
> Avg. new daily cases in Stanly County in 7 days ending June 29: 28.1 per 100,000
> Avg. new daily cases in Stanly County in 7 days ending June 22: 14.7 per 100,000
> Avg. new daily cases in North Carolina in 7 days ending June 29: 12.6 per 100,000 — 13th most
> Confirmed COVID-19 cases in Stanly County as of June 29: 610 per 100,000 people (total: 373)
> Population: 61,114
> Largest place in Stanly County: Albemarle
North Dakota: Burleigh County
> Change in daily avg. new COVID-19 cases week over week: +0.8 per 100,000 people
> Avg. new daily cases in Burleigh County in 7 days ending June 29: 5.7 per 100,000
> Avg. new daily cases in Burleigh County in 7 days ending June 22: 5.0 per 100,000
> Avg. new daily cases in North Dakota in 7 days ending June 29: 3.8 per 100,000 — 15th fewest
> Confirmed COVID-19 cases in Burleigh County as of June 29: 266 per 100,000 people (total: 249)
> Population: 93,737
> Largest place in Burleigh County: Bismarck
[in-text-ad-2]

Ohio: Columbiana County
> Change in daily avg. new COVID-19 cases week over week: +13.7 per 100,000 people
> Avg. new daily cases in Columbiana County in 7 days ending June 29: 18.6 per 100,000
> Avg. new daily cases in Columbiana County in 7 days ending June 22: 4.9 per 100,000
> Avg. new daily cases in Ohio in 7 days ending June 29: 6.0 per 100,000 — 24th fewest
> Confirmed COVID-19 cases in Columbiana County as of June 29: 1,156 per 100,000 people (total: 1,202)
> Population: 104,003
> Largest place in Columbiana County: Salem
Oklahoma: McCurtain County
> Change in daily avg. new COVID-19 cases week over week: +30.9 per 100,000 people
> Avg. new daily cases in McCurtain County in 7 days ending June 29: 72.0 per 100,000
> Avg. new daily cases in McCurtain County in 7 days ending June 22: 41.1 per 100,000
> Avg. new daily cases in Oklahoma in 7 days ending June 29: 9.3 per 100,000 — 16th most
> Confirmed COVID-19 cases in McCurtain County as of June 29: 1,323 per 100,000 people (total: 436)
> Population: 32,966
> Largest place in McCurtain County: Idabel
[in-text-ad]

Oregon: Umatilla County
> Change in daily avg. new COVID-19 cases week over week: +14.3 per 100,000 people
> Avg. new daily cases in Umatilla County in 7 days ending June 29: 26.4 per 100,000
> Avg. new daily cases in Umatilla County in 7 days ending June 22: 12.1 per 100,000
> Avg. new daily cases in Oregon in 7 days ending June 29: 4.3 per 100,000 — 16th fewest
> Confirmed COVID-19 cases in Umatilla County as of June 29: 627 per 100,000 people (total: 482)
> Population: 76,898
> Largest place in Umatilla County: Hermiston
[recirclink id=715247]

Pennsylvania: Lancaster County
> Change in daily avg. new COVID-19 cases week over week: +2.5 per 100,000 people
> Avg. new daily cases in Lancaster County in 7 days ending June 29: 8.9 per 100,000
> Avg. new daily cases in Lancaster County in 7 days ending June 22: 6.3 per 100,000
> Avg. new daily cases in Pennsylvania in 7 days ending June 29: 3.7 per 100,000 — 13th fewest
> Confirmed COVID-19 cases in Lancaster County as of June 29: 820 per 100,000 people (total: 4,414)
> Population: 538,347
> Largest place in Lancaster County: Lancaster
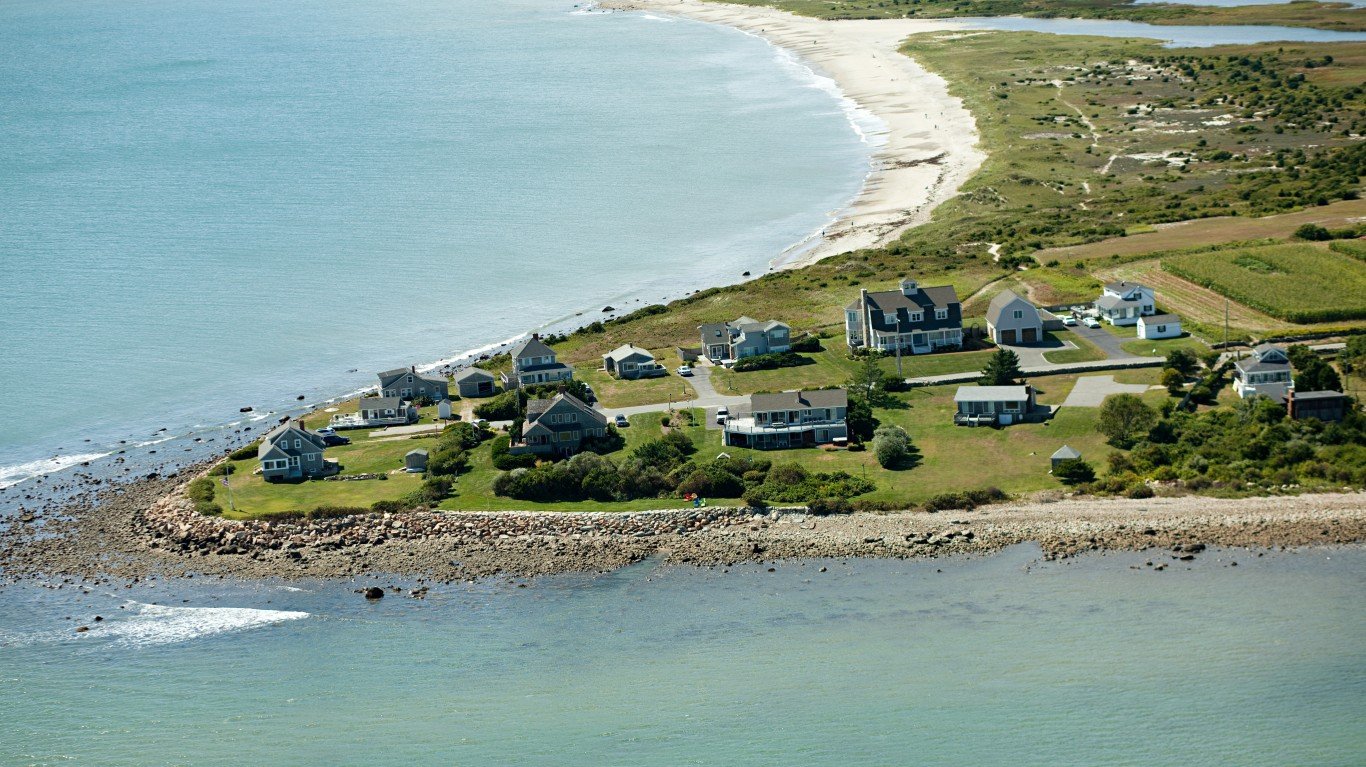
Rhode Island: Newport County
> Change in daily avg. new COVID-19 cases week over week: +1.3 per 100,000 people
> Avg. new daily cases in Newport County in 7 days ending June 29: 2.8 per 100,000
> Avg. new daily cases in Newport County in 7 days ending June 22: 1.6 per 100,000
> Avg. new daily cases in Rhode Island in 7 days ending June 29: 4.7 per 100,000 — 19th fewest
> Confirmed COVID-19 cases in Newport County as of June 29: 371 per 100,000 people (total: 308)
> Population: 83,075
> Largest place in Newport County: Newport
[in-text-ad-2]

South Carolina: Charleston County
> Change in daily avg. new COVID-19 cases week over week: +26.2 per 100,000 people
> Avg. new daily cases in Charleston County in 7 days ending June 29: 48.0 per 100,000
> Avg. new daily cases in Charleston County in 7 days ending June 22: 21.8 per 100,000
> Avg. new daily cases in South Carolina in 7 days ending June 29: 22.0 per 100,000 — 3rd most
> Confirmed COVID-19 cases in Charleston County as of June 29: 926 per 100,000 people (total: 3,654)
> Population: 394,708
> Largest place in Charleston County: Charleston
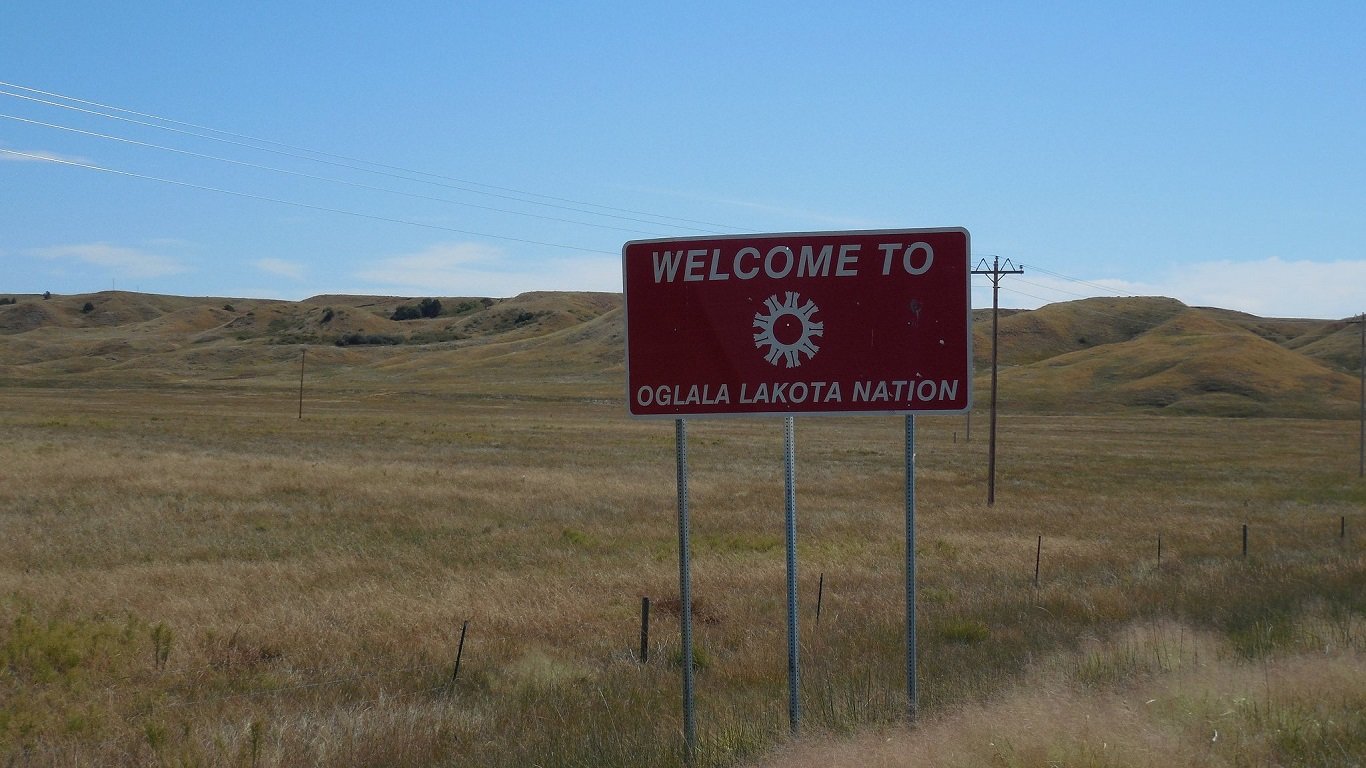
South Dakota: Oglala Lakota County
> Change in daily avg. new COVID-19 cases week over week: +11.0 per 100,000 people
> Avg. new daily cases in Oglala Lakota County in 7 days ending June 29: 19.1 per 100,000
> Avg. new daily cases in Oglala Lakota County in 7 days ending June 22: 8.1 per 100,000
> Avg. new daily cases in South Dakota in 7 days ending June 29: 6.3 per 100,000 — 24th most
> Confirmed COVID-19 cases in Oglala Lakota County as of June 29: 586 per 100,000 people (total: 84)
> Population: 14,335
> Largest place in Oglala Lakota County: N/A
[in-text-ad]
Tennessee: Macon County
> Change in daily avg. new COVID-19 cases week over week: +22.7 per 100,000 people
> Avg. new daily cases in Macon County in 7 days ending June 29: 36.6 per 100,000
> Avg. new daily cases in Macon County in 7 days ending June 22: 13.9 per 100,000
> Avg. new daily cases in Tennessee in 7 days ending June 29: 11.3 per 100,000 — 14th most
> Confirmed COVID-19 cases in Macon County as of June 29: 1,537 per 100,000 people (total: 361)
> Population: 23,487
> Largest place in Macon County: Lafayette
[recirclink id=714364]

Texas: Brewster County
> Change in daily avg. new COVID-19 cases week over week: +48.7 per 100,000 people
> Avg. new daily cases in Brewster County in 7 days ending June 29: 79.3 per 100,000
> Avg. new daily cases in Brewster County in 7 days ending June 22: 30.6 per 100,000
> Avg. new daily cases in Texas in 7 days ending June 29: 16.6 per 100,000 — 6th most
> Confirmed COVID-19 cases in Brewster County as of June 29: 922 per 100,000 people (total: 85)
> Population: 9,216
> Largest place in Brewster County: Alpine

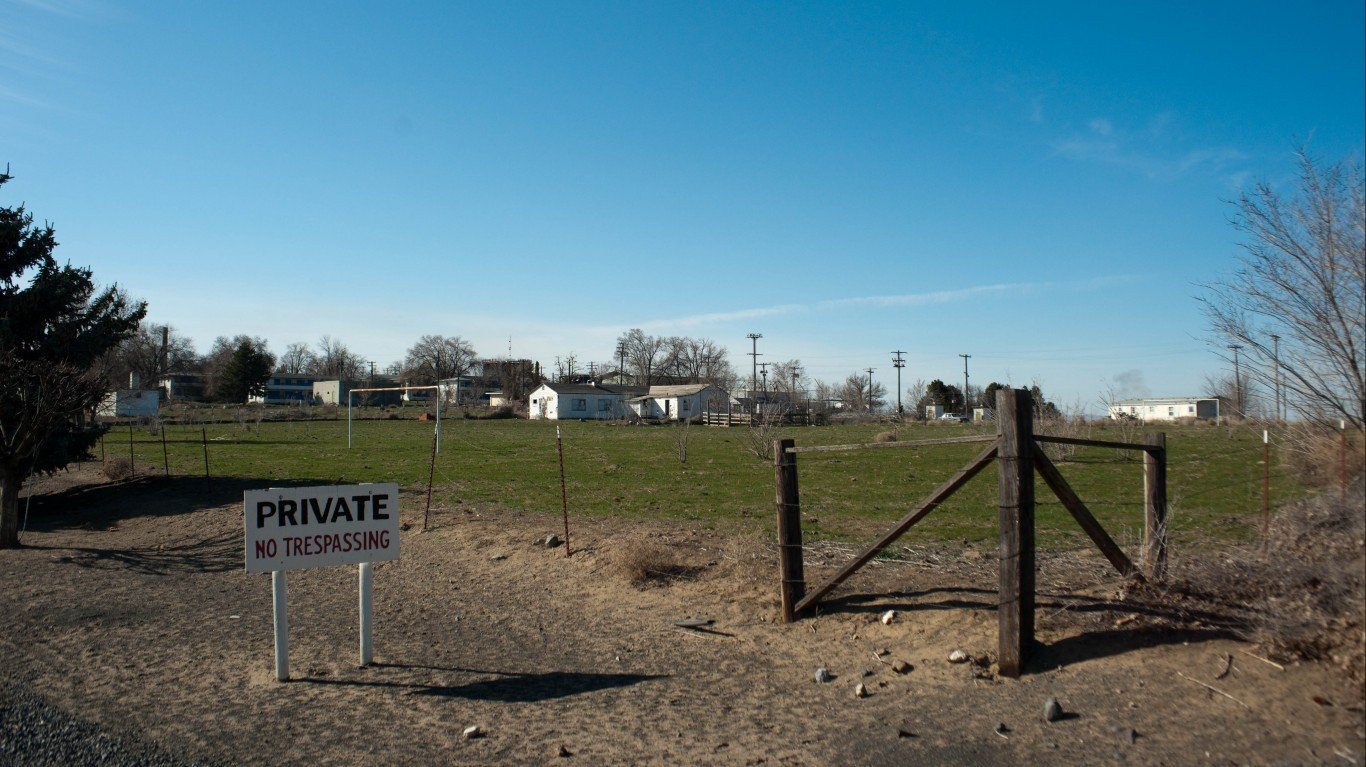
Utah: Utah County
> Change in daily avg. new COVID-19 cases week over week: +4.1 per 100,000 people
> Avg. new daily cases in Utah County in 7 days ending June 29: 15.5 per 100,000
> Avg. new daily cases in Utah County in 7 days ending June 22: 11.4 per 100,000
> Avg. new daily cases in Utah in 7 days ending June 29: 14.9 per 100,000 — 10th most
> Confirmed COVID-19 cases in Utah County as of June 29: 652 per 100,000 people (total: 3,850)
> Population: 590,440
> Largest place in Utah County: Provo
[in-text-ad-2]

Vermont: Chittenden County
> Change in daily avg. new COVID-19 cases week over week: +0.0 per 100,000 people
> Avg. new daily cases in Chittenden County in 7 days ending June 29: 1.8 per 100,000
> Avg. new daily cases in Chittenden County in 7 days ending June 22: 1.8 per 100,000
> Avg. new daily cases in Vermont in 7 days ending June 29: 1.1 per 100,000 — 2nd fewest
> Confirmed COVID-19 cases in Chittenden County as of June 29: 375 per 100,000 people (total: 607)
> Population: 162,052
> Largest place in Chittenden County: Burlington

Virginia: Nottoway County
> Change in daily avg. new COVID-19 cases week over week: +9.9 per 100,000 people
> Avg. new daily cases in Nottoway County in 7 days ending June 29: 26.6 per 100,000
> Avg. new daily cases in Nottoway County in 7 days ending June 22: 16.7 per 100,000
> Avg. new daily cases in Virginia in 7 days ending June 29: 6.3 per 100,000 — 25th most
> Confirmed COVID-19 cases in Nottoway County as of June 29: 710 per 100,000 people (total: 110)
> Population: 15,500
> Largest place in Nottoway County: Blackstone
[in-text-ad]
Washington: Franklin County
> Change in daily avg. new COVID-19 cases week over week: +14.6 per 100,000 people
> Avg. new daily cases in Franklin County in 7 days ending June 29: 57.0 per 100,000
> Avg. new daily cases in Franklin County in 7 days ending June 22: 42.4 per 100,000
> Avg. new daily cases in Washington in 7 days ending June 29: 5.9 per 100,000 — 23rd fewest
> Confirmed COVID-19 cases in Franklin County as of June 29: 1,741 per 100,000 people (total: 1,578)
> Population: 90,660
> Largest place in Franklin County: Pasco
[recirclink id=713961]
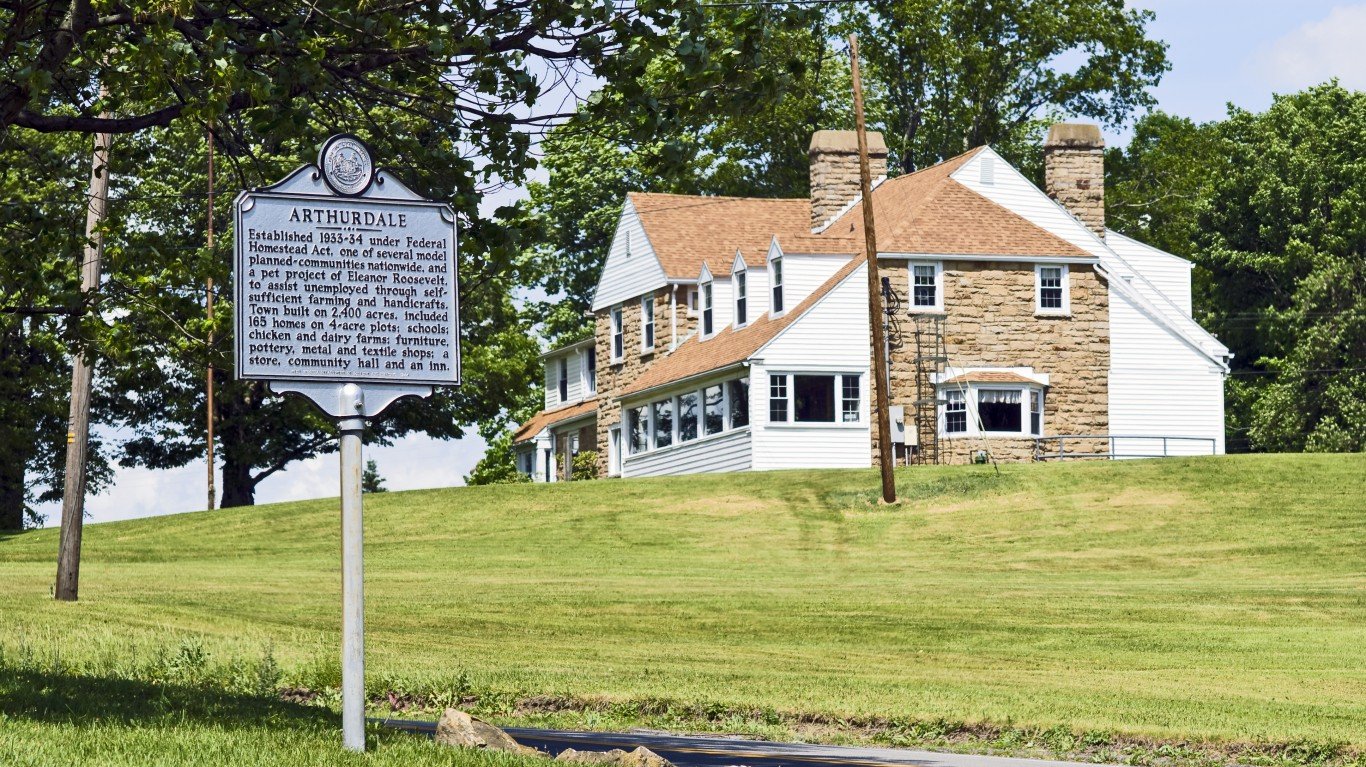
West Virginia: Preston County
> Change in daily avg. new COVID-19 cases week over week: +4.2 per 100,000 people
> Avg. new daily cases in Preston County in 7 days ending June 29: 11.9 per 100,000
> Avg. new daily cases in Preston County in 7 days ending June 22: 7.7 per 100,000
> Avg. new daily cases in West Virginia in 7 days ending June 29: 2.1 per 100,000 — 5th fewest
> Confirmed COVID-19 cases in Preston County as of June 29: 222 per 100,000 people (total: 75)
> Population: 33,837
> Largest place in Preston County: Kingwood

Wisconsin: Dane County
> Change in daily avg. new COVID-19 cases week over week: +7.2 per 100,000 people
> Avg. new daily cases in Dane County in 7 days ending June 29: 10.6 per 100,000
> Avg. new daily cases in Dane County in 7 days ending June 22: 3.4 per 100,000
> Avg. new daily cases in Wisconsin in 7 days ending June 29: 6.3 per 100,000 — 23rd most
> Confirmed COVID-19 cases in Dane County as of June 29: 326 per 100,000 people (total: 1,727)
> Population: 529,843
> Largest place in Dane County: Madison
[in-text-ad-2]
Wyoming: Sweetwater County
> Change in daily avg. new COVID-19 cases week over week: +5.1 per 100,000 people
> Avg. new daily cases in Sweetwater County in 7 days ending June 29: 8.3 per 100,000
> Avg. new daily cases in Sweetwater County in 7 days ending June 22: 3.1 per 100,000
> Avg. new daily cases in Wyoming in 7 days ending June 29: 4.6 per 100,000 — 18th fewest
> Confirmed COVID-19 cases in Sweetwater County as of June 29: 186 per 100,000 people (total: 82)
> Population: 44,117
> Largest place in Sweetwater County: Rock Springs
Contact [email protected] for any questions or corrections.