The first Russians living on U.S. territory did not have to travel at all. They were the people who lived in Alaska at the time it was sold to the United States in 1867. The first actual wave of Russian immigrants came in the early 20th century when over 30,000 people moved to the U.S. during Russia’s regime change from a tsarist empire to the communist Soviet Union.
A new wave of immigrants from Russia is underway, and it started before the Russian invasion of Ukraine. In fact, there are more Russians seeking asylum in the United States now than at any other time in recorded history. Since Oct. 1, 2021, 6,420 have applied, compared to 4,100 in the 12 months before that. (This is how many refugees the U.S. has accepted every year since 1980.)
To determine the number of Russian-born people in every state, 24/7 Tempo reviewed 2020 five-year population estimates from the U.S. Census Bureau.
In 1910, only about 65,000 Russians lived in the U.S. Today, they number nearly 400,000, according to the 2020 Census, and Russian is one of the 10 most common non-English languages spoken in the U.S. (As of 2019, there were also at least 800,000 non-Russian immigrants from various republics of the Soviet Union, including Ukraine, in America, according to figures tabulated by the Migration Policy Institute. These are all the former Soviet republics and what they’re called today.)
New York and California are home to the most Russian-born immigrants, though Wyoming has the most as a percentage of the foreign-born state population. Wyoming and Russia have shared interests in oil, gas, and uranium, and there are substantial Russian-speaking communities in Casper, Cheyenne, and Gillette.
Click here to see how many Russian-born people live in every state
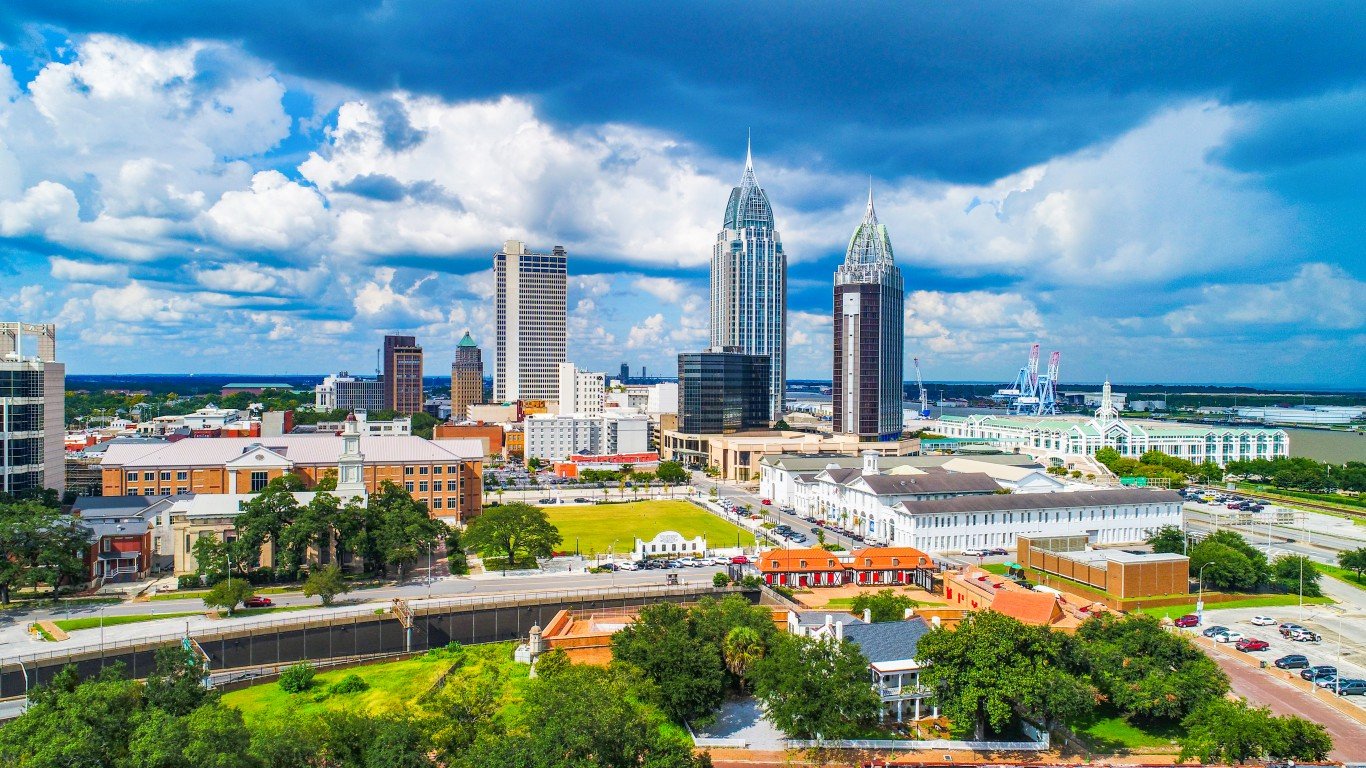
Alabama
> Russian-born residents: 1,123
> Pct. of total foreign-born residents: 0.67% (16th lowest)
> Foreign born residents: 168,053
> Total population: 4,893,186
[in-text-ad]
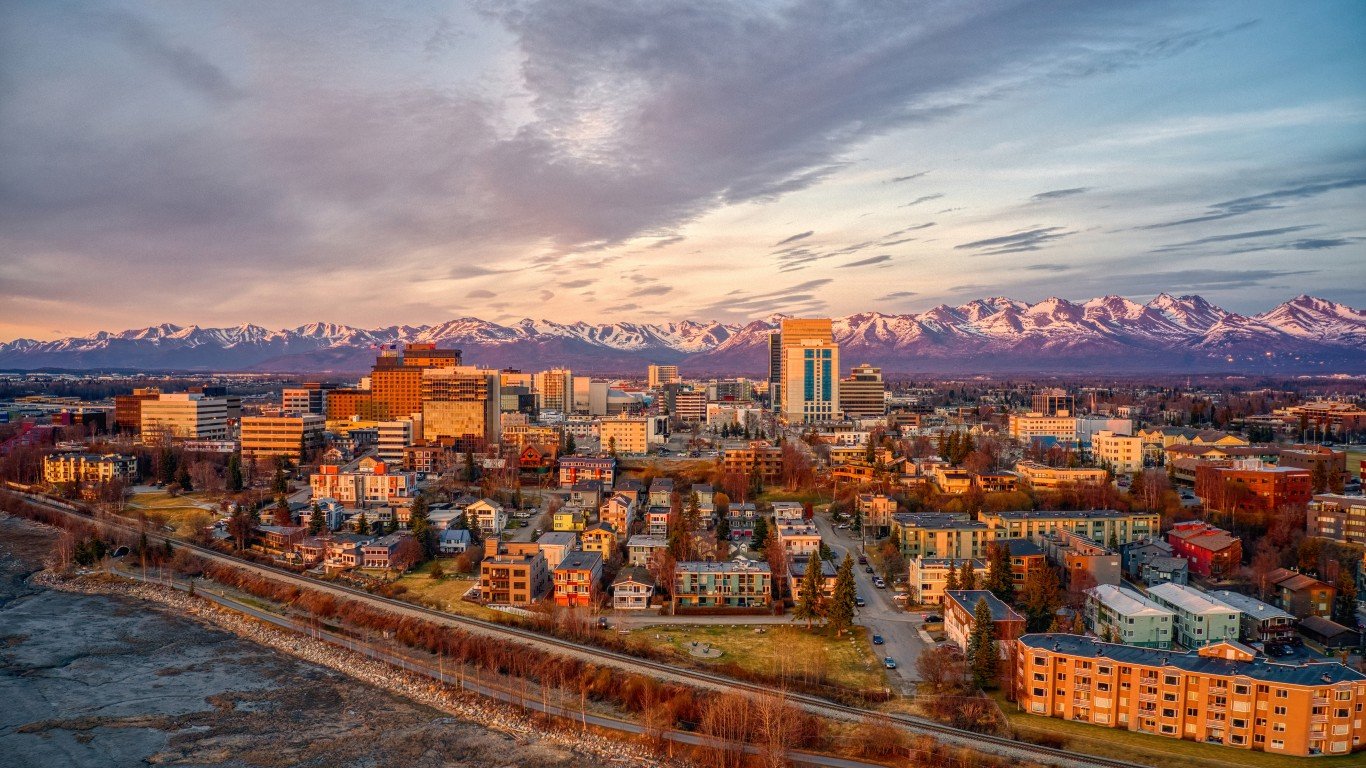
Alaska
> Russian-born residents: 1,130
> Pct. of total foreign-born residents: 1.97% (2nd highest)
> Foreign born residents: 57,342
> Total population: 736,990
[recirclink id=1090321]

Arizona
> Russian-born residents: 4,418
> Pct. of total foreign-born residents: 0.47% (7th lowest)
> Foreign born residents: 947,589
> Total population: 7,174,064

Arkansas
> Russian-born residents: 332
> Pct. of total foreign-born residents: 0.22% (the lowest)
> Foreign born residents: 148,142
> Total population: 3,011,873
[in-text-ad-2]

California
> Russian-born residents: 68,782
> Pct. of total foreign-born residents: 0.66% (15th lowest)
> Foreign born residents: 10,463,785
> Total population: 39,346,023

Colorado
> Russian-born residents: 7,127
> Pct. of total foreign-born residents: 1.32% (15th highest)
> Foreign born residents: 539,514
> Total population: 5,684,926
[in-text-ad]

Connecticut
> Russian-born residents: 5,874
> Pct. of total foreign-born residents: 1.13% (18th highest)
> Foreign born residents: 521,372
> Total population: 3,570,549
[recirclink id=1093853]

Delaware
> Russian-born residents: 744
> Pct. of total foreign-born residents: 0.82% (22nd lowest)
> Foreign born residents: 91,133
> Total population: 967,679

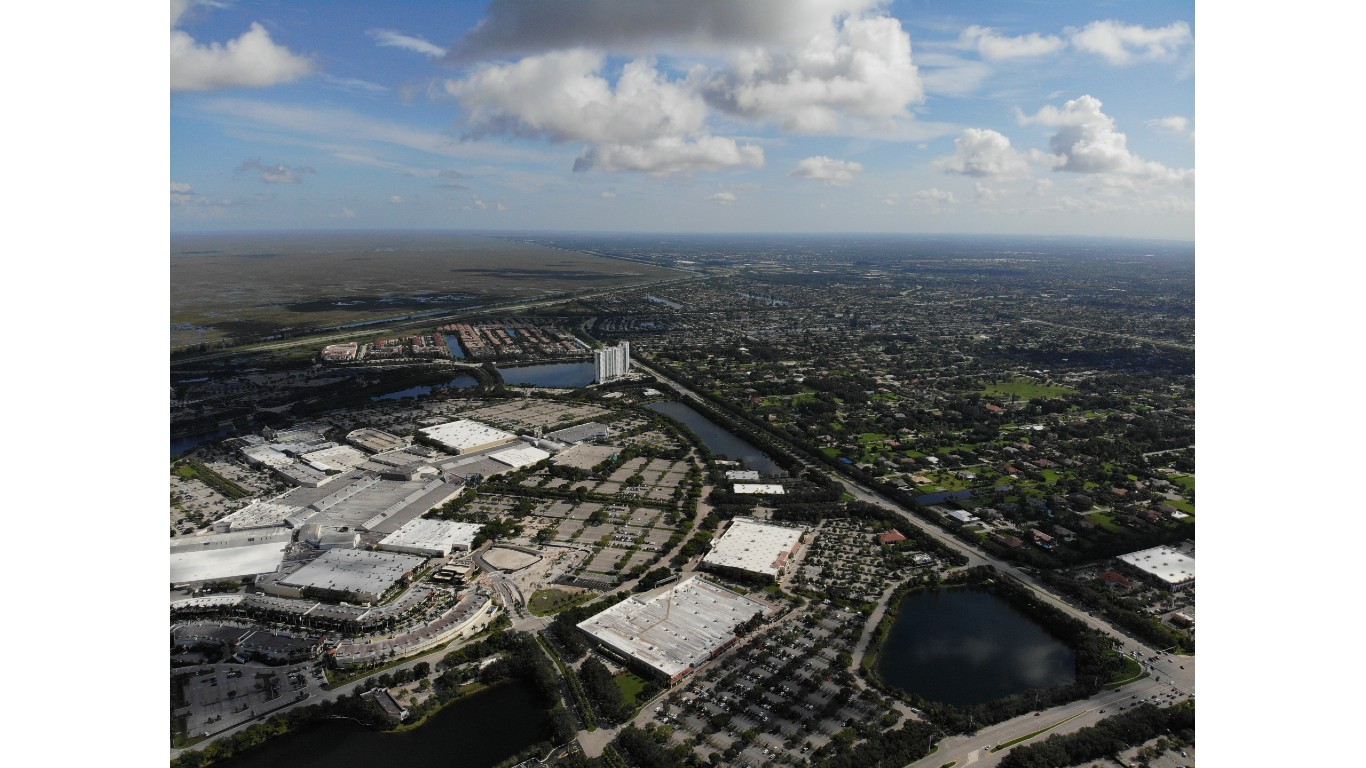
Florida
> Russian-born residents: 28,157
> Pct. of total foreign-born residents: 0.64% (13th lowest)
> Foreign born residents: 4,410,199
> Total population: 21,216,924
[in-text-ad-2]

Georgia
> Russian-born residents: 7,174
> Pct. of total foreign-born residents: 0.67% (17th lowest)
> Foreign born residents: 1,068,027
> Total population: 10,516,579

Hawaii
> Russian-born residents: 663
> Pct. of total foreign-born residents: 0.26% (2nd lowest)
> Foreign born residents: 259,672
> Total population: 1,420,074
[in-text-ad]

Idaho
> Russian-born residents: 836
> Pct. of total foreign-born residents: 0.81% (20th lowest)
> Foreign born residents: 103,021
> Total population: 1,754,367
[recirclink id=1088663]

Illinois
> Russian-born residents: 17,583
> Pct. of total foreign-born residents: 0.99% (24th highest)
> Foreign born residents: 1,773,067
> Total population: 12,716,164

Indiana
> Russian-born residents: 3,278
> Pct. of total foreign-born residents: 0.92% (25th highest)
> Foreign born residents: 355,838
> Total population: 6,696,893
[in-text-ad-2]

Iowa
> Russian-born residents: 1,289
> Pct. of total foreign-born residents: 0.76% (19th lowest)
> Foreign born residents: 170,325
> Total population: 3,150,011
Kansas
> Russian-born residents: 1,010
> Pct. of total foreign-born residents: 0.50% (8th lowest)
> Foreign born residents: 204,026
> Total population: 2,912,619
[in-text-ad]

Kentucky
> Russian-born residents: 2,055
> Pct. of total foreign-born residents: 1.17% (17th highest)
> Foreign born residents: 176,323
> Total population: 4,461,952
[recirclink id=1083287]

Louisiana
> Russian-born residents: 1,169
> Pct. of total foreign-born residents: 0.61% (11th lowest)
> Foreign born residents: 193,041
> Total population: 4,664,616

Maine
> Russian-born residents: 425
> Pct. of total foreign-born residents: 0.88% (24th lowest)
> Foreign born residents: 48,139
> Total population: 1,340,825
[in-text-ad-2]

Maryland
> Russian-born residents: 9,555
> Pct. of total foreign-born residents: 1.04% (20th highest)
> Foreign born residents: 915,996
> Total population: 6,037,624

Massachusetts
> Russian-born residents: 18,175
> Pct. of total foreign-born residents: 1.57% (9th highest)
> Foreign born residents: 1,158,909
> Total population: 6,873,003
[in-text-ad]
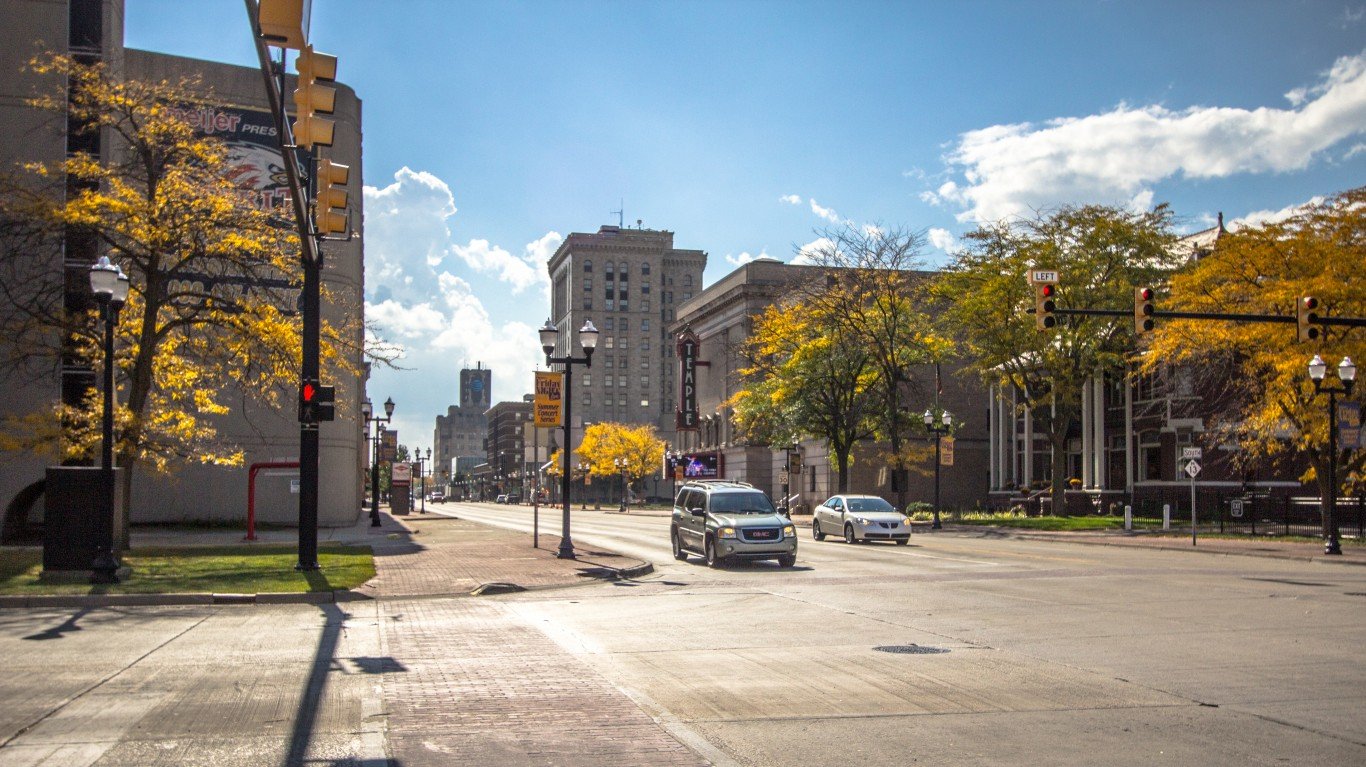
Michigan
> Russian-born residents: 6,864
> Pct. of total foreign-born residents: 1.00% (23rd highest)
> Foreign born residents: 686,637
> Total population: 9,973,907
[recirclink id=1054912]

Minnesota
> Russian-born residents: 6,325
> Pct. of total foreign-born residents: 1.34% (14th highest)
> Foreign born residents: 470,687
> Total population: 5,600,166

Mississippi
> Russian-born residents: 450
> Pct. of total foreign-born residents: 0.65% (14th lowest)
> Foreign born residents: 69,211
> Total population: 2,981,835
[in-text-ad-2]
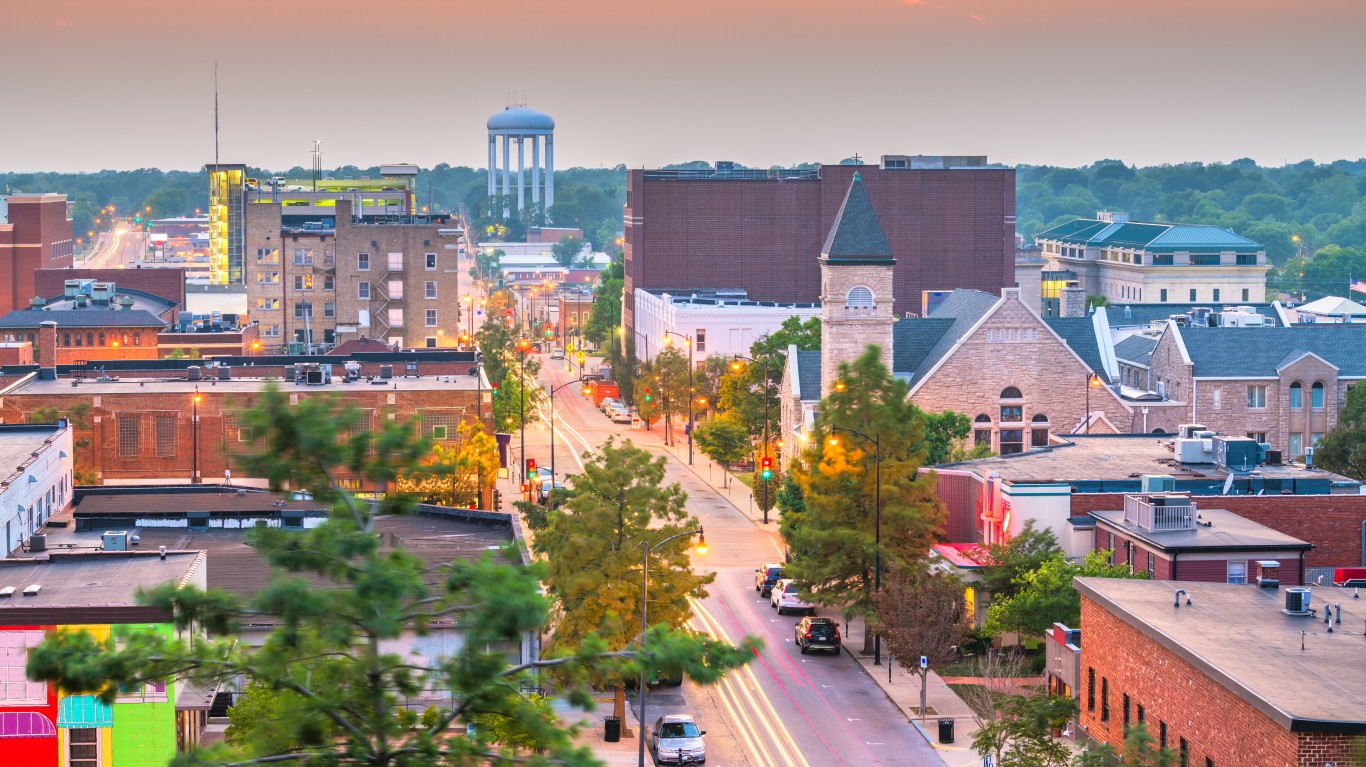
Missouri
> Russian-born residents: 3,780
> Pct. of total foreign-born residents: 1.47% (11th highest)
> Foreign born residents: 256,336
> Total population: 6,124,160

Montana
> Russian-born residents: 370
> Pct. of total foreign-born residents: 1.59% (8th highest)
> Foreign born residents: 23,321
> Total population: 1,061,705
[in-text-ad]
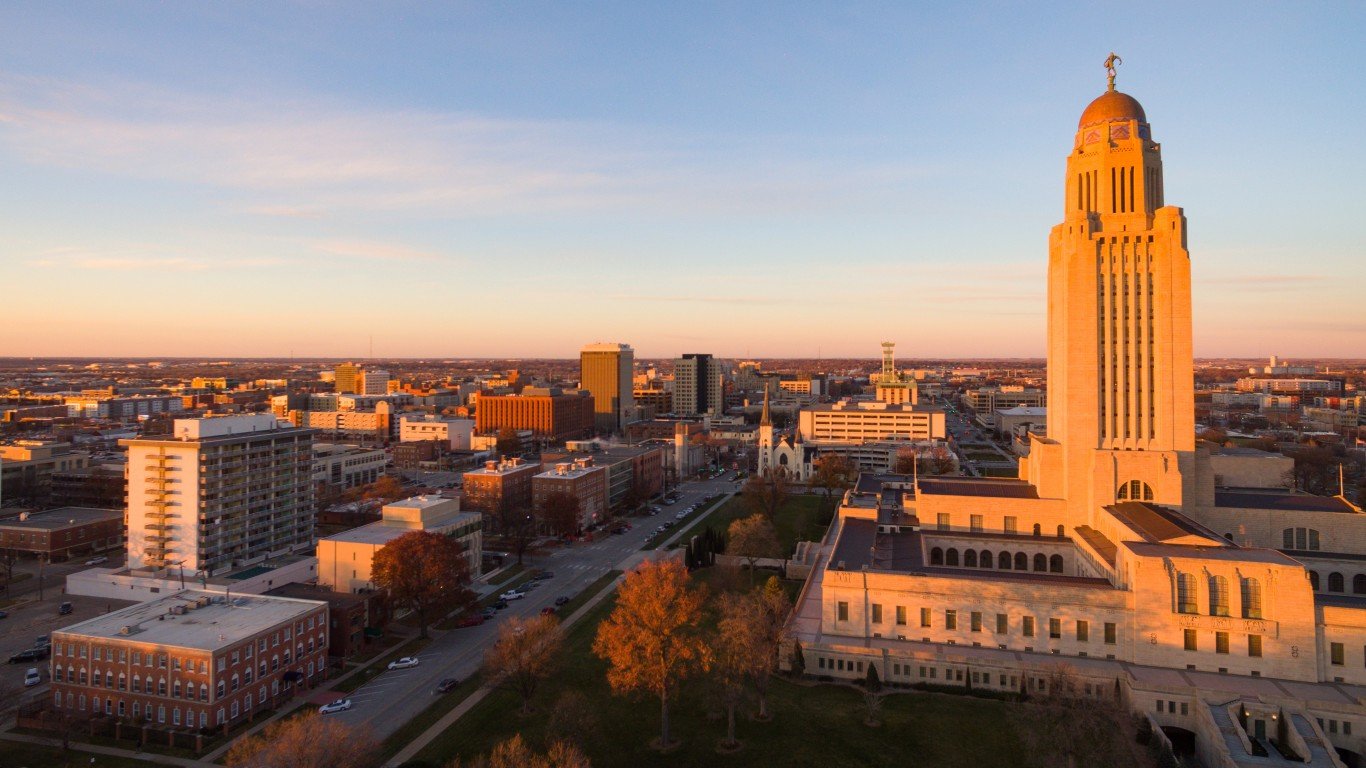
Nebraska
> Russian-born residents: 615
> Pct. of total foreign-born residents: 0.43% (6th lowest)
> Foreign born residents: 142,616
> Total population: 1,923,826
[recirclink id=1090321]

Nevada
> Russian-born residents: 2,411
> Pct. of total foreign-born residents: 0.41% (5th lowest)
> Foreign born residents: 587,797
> Total population: 3,030,281

New Hampshire
> Russian-born residents: 1,254
> Pct. of total foreign-born residents: 1.52% (10th highest)
> Foreign born residents: 82,622
> Total population: 1,355,244
[in-text-ad-2]
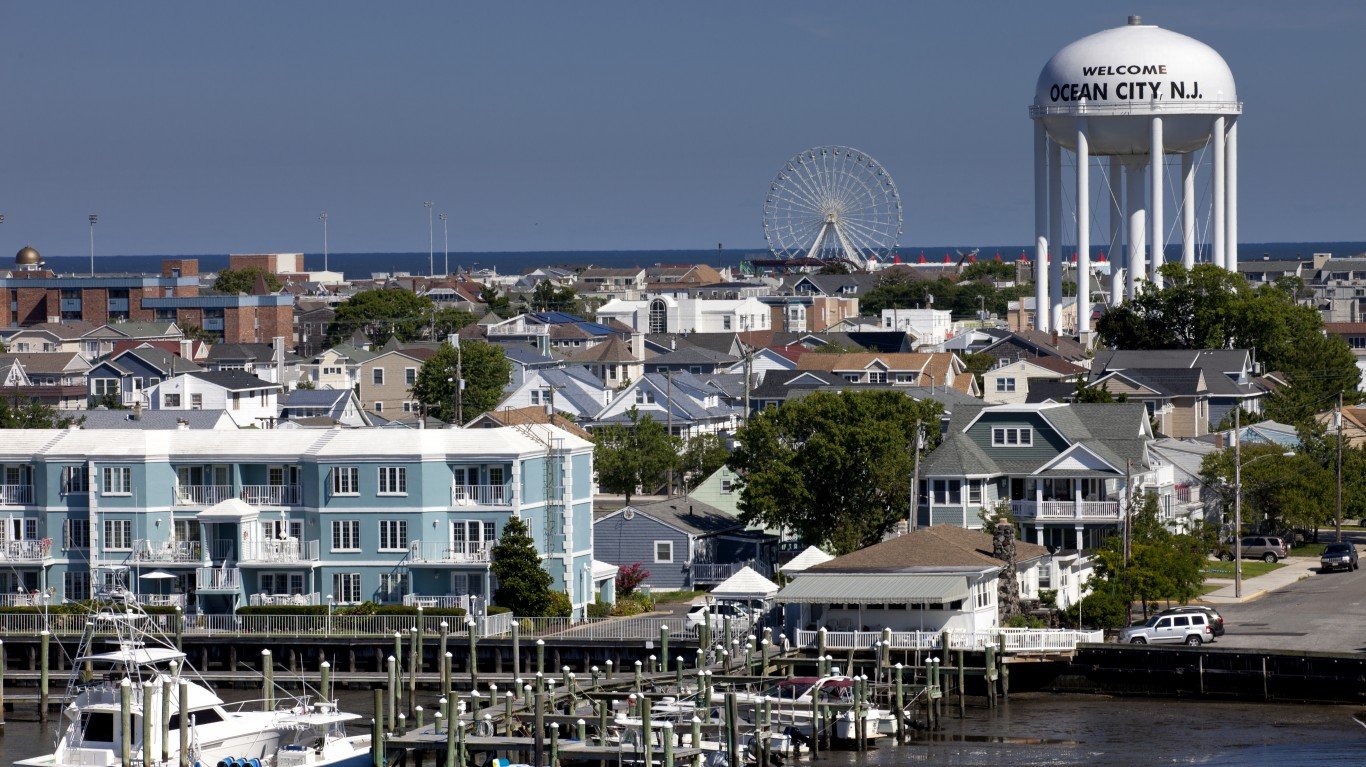
New Jersey
> Russian-born residents: 20,902
> Pct. of total foreign-born residents: 1.04% (21st highest)
> Foreign born residents: 2,012,872
> Total population: 8,885,418
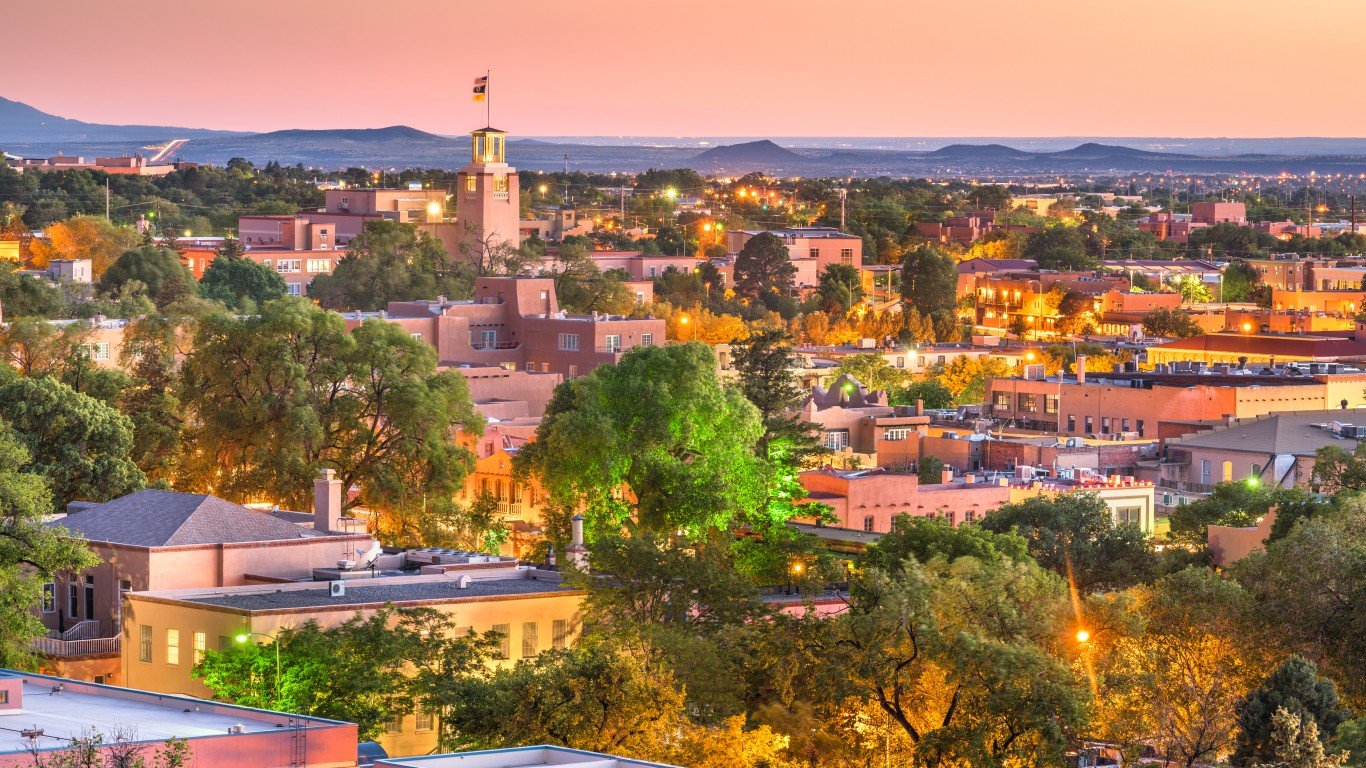
New Mexico
> Russian-born residents: 547
> Pct. of total foreign-born residents: 0.28% (3rd lowest)
> Foreign born residents: 193,223
> Total population: 2,097,021
[in-text-ad]

New York
> Russian-born residents: 74,600
> Pct. of total foreign-born residents: 1.71% (5th highest)
> Foreign born residents: 4,372,163
> Total population: 19,514,849
[recirclink id=1093853]

North Carolina
> Russian-born residents: 6,794
> Pct. of total foreign-born residents: 0.82% (21st lowest)
> Foreign born residents: 832,602
> Total population: 10,386,227

North Dakota
> Russian-born residents: 338
> Pct. of total foreign-born residents: 1.04% (19th highest)
> Foreign born residents: 32,389
> Total population: 760,394
[in-text-ad-2]

Ohio
> Russian-born residents: 9,038
> Pct. of total foreign-born residents: 1.67% (6th highest)
> Foreign born residents: 542,658
> Total population: 11,675,275

Oklahoma
> Russian-born residents: 1,303
> Pct. of total foreign-born residents: 0.55% (10th lowest)
> Foreign born residents: 237,812
> Total population: 3,949,342
[in-text-ad]

Oregon
> Russian-born residents: 6,027
> Pct. of total foreign-born residents: 1.47% (12th highest)
> Foreign born residents: 409,867
> Total population: 4,176,346
[recirclink id=1088663]

Pennsylvania
> Russian-born residents: 14,583
> Pct. of total foreign-born residents: 1.63% (7th highest)
> Foreign born residents: 896,848
> Total population: 12,794,885

Rhode Island
> Russian-born residents: 1,097
> Pct. of total foreign-born residents: 0.74% (18th lowest)
> Foreign born residents: 148,305
> Total population: 1,057,798
[in-text-ad-2]

South Carolina
> Russian-born residents: 3,563
> Pct. of total foreign-born residents: 1.35% (13th highest)
> Foreign born residents: 263,203
> Total population: 5,091,517

South Dakota
> Russian-born residents: 182
> Pct. of total foreign-born residents: 0.52% (9th lowest)
> Foreign born residents: 34,911
> Total population: 879,336
[in-text-ad]

Tennessee
> Russian-born residents: 3,017
> Pct. of total foreign-born residents: 0.87% (23rd lowest)
> Foreign born residents: 347,210
> Total population: 6,772,268
[recirclink id=1083287]

Texas
> Russian-born residents: 14,875
> Pct. of total foreign-born residents: 0.31% (4th lowest)
> Foreign born residents: 4,822,952
> Total population: 28,635,442

Utah
> Russian-born residents: 1,625
> Pct. of total foreign-born residents: 0.61% (12th lowest)
> Foreign born residents: 264,538
> Total population: 3,151,239
[in-text-ad-2]

Vermont
> Russian-born residents: 560
> Pct. of total foreign-born residents: 1.97% (3rd highest)
> Foreign born residents: 28,468
> Total population: 624,340

Virginia
> Russian-born residents: 9,445
> Pct. of total foreign-born residents: 0.88% (25th lowest)
> Foreign born residents: 1,068,470
> Total population: 8,509,358
[in-text-ad]

Washington
> Russian-born residents: 20,046
> Pct. of total foreign-born residents: 1.84% (4th highest)
> Foreign born residents: 1,089,651
> Total population: 7,512,465
[recirclink id=1054912]
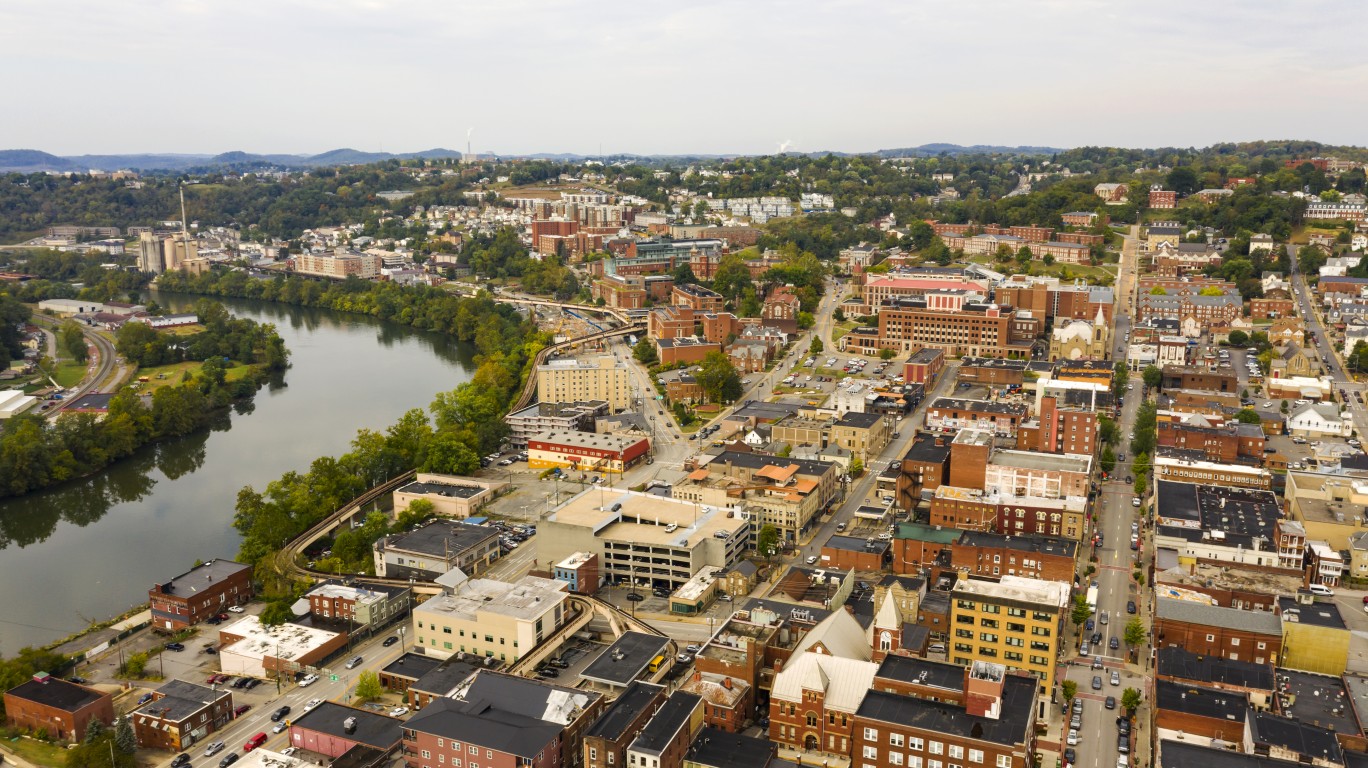
West Virginia
> Russian-born residents: 301
> Pct. of total foreign-born residents: 1.02% (22nd highest)
> Foreign born residents: 29,584
> Total population: 1,807,426
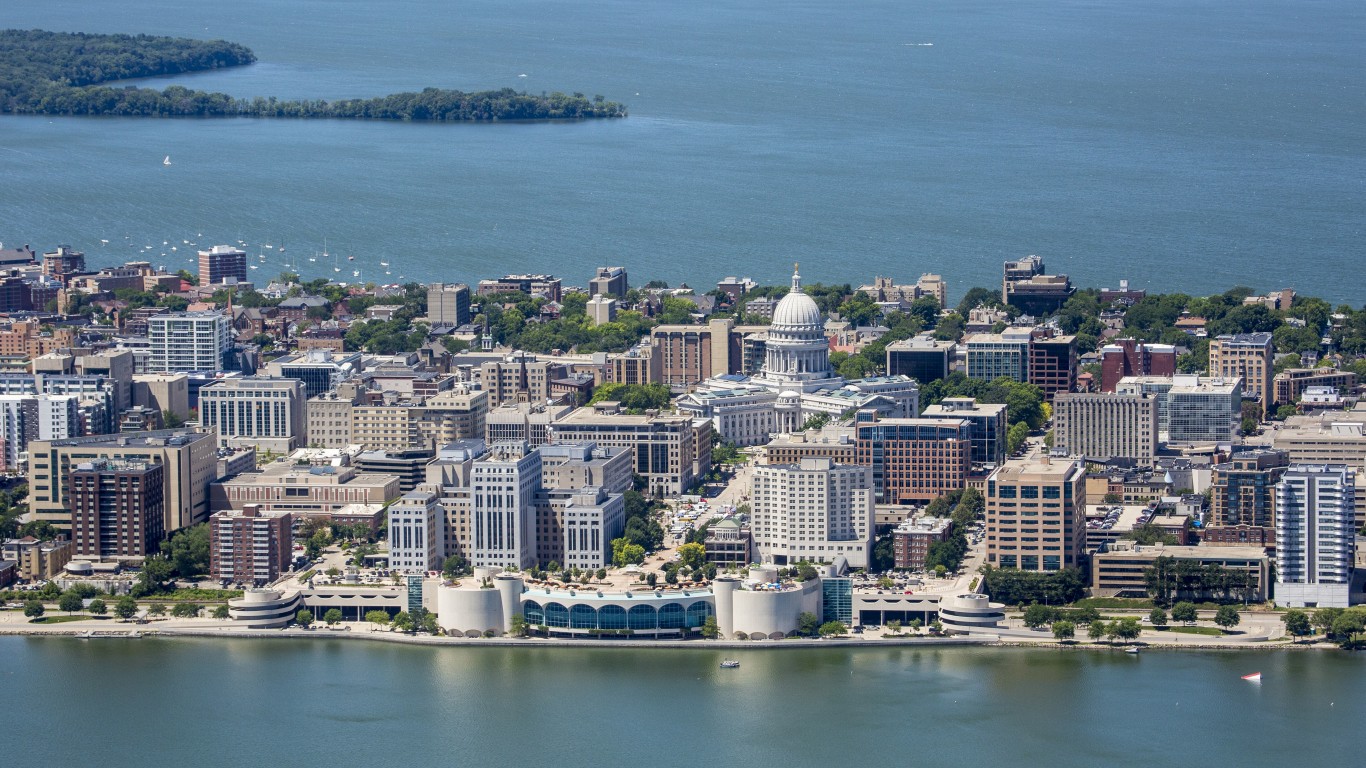
Wisconsin
> Russian-born residents: 3,836
> Pct. of total foreign-born residents: 1.32% (16th highest)
> Foreign born residents: 291,187
> Total population: 5,806,975
[in-text-ad-2]
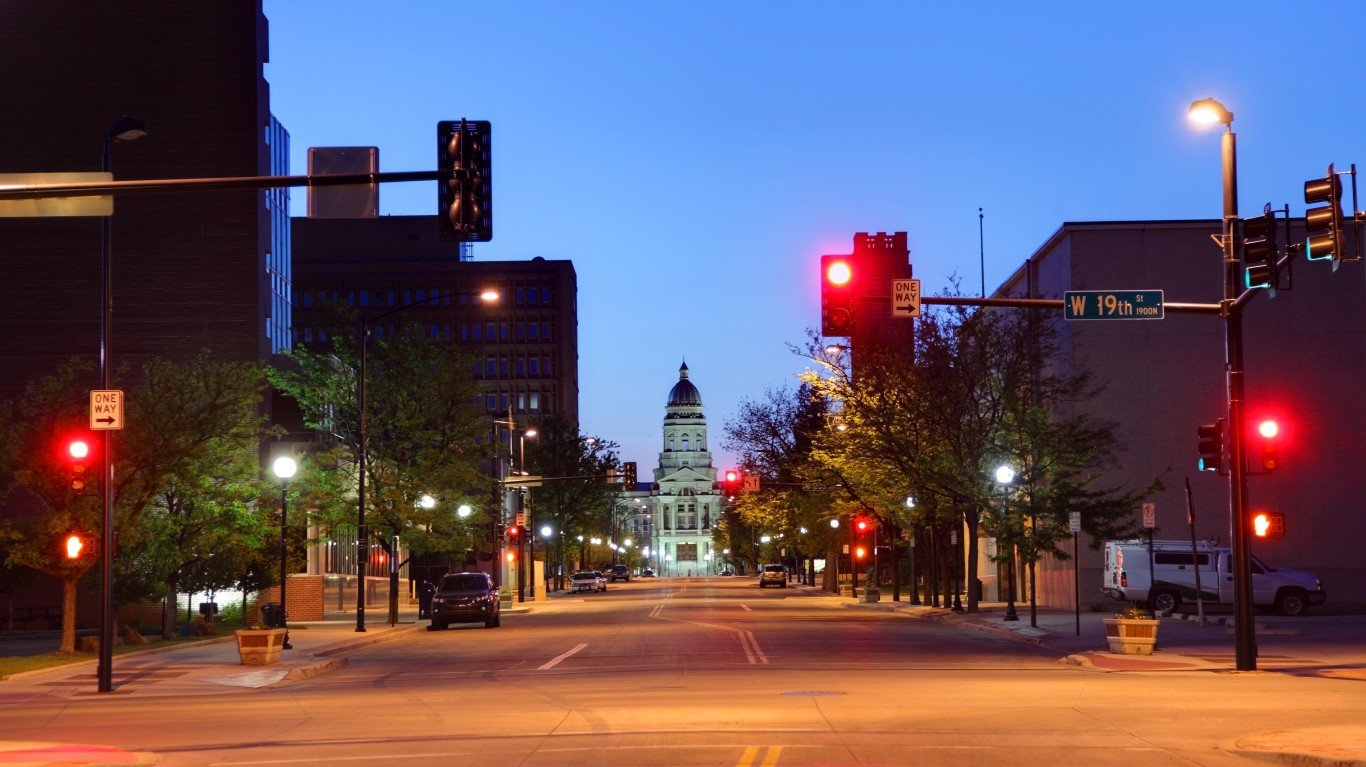
Wyoming
> Russian-born residents: 404
> Pct. of total foreign-born residents: 2.10% (the highest)
> Foreign born residents: 19,274
> Total population: 581,348
Contact [email protected] for any questions or corrections.