Sunlight is essential for human life. Without it, we couldn’t grow or raise food to fuel our bodies. We also need the vitamin D the sun produces to strengthen our bodies, and a sunless world would quickly grow too cold to sustain existence.
As long as we protect ourselves from the intense ultraviolet (UV) radiation that’s part of sunlight — which can cause skin cancer and other health problems — we can enjoy the sun’s rays without any harm. (Before you lather on the high-SPF lotion, though, read these 18 myths about sunscreen and sun protection.)
The sun burns at a temperature of about 10,000 degrees Fahrenheit. Thankfully, not all that heat reaches the earth’s surface because it’s absorbed by the ozone layer. So is all type C UV radiation and most of type B. It’s type A that reaches us at full strength.
When the sun directly hits the top of the atmosphere, the average intensity of solar energy is 1,360 watts per square meter. By way of comparison, a microwave uses 1,000 watts and an incandescent light bulb 40 to 100 watts. Solar energy is also measured in joules. One joule equals one watt of power radiated or dissipated for one second over the earth’s surface.
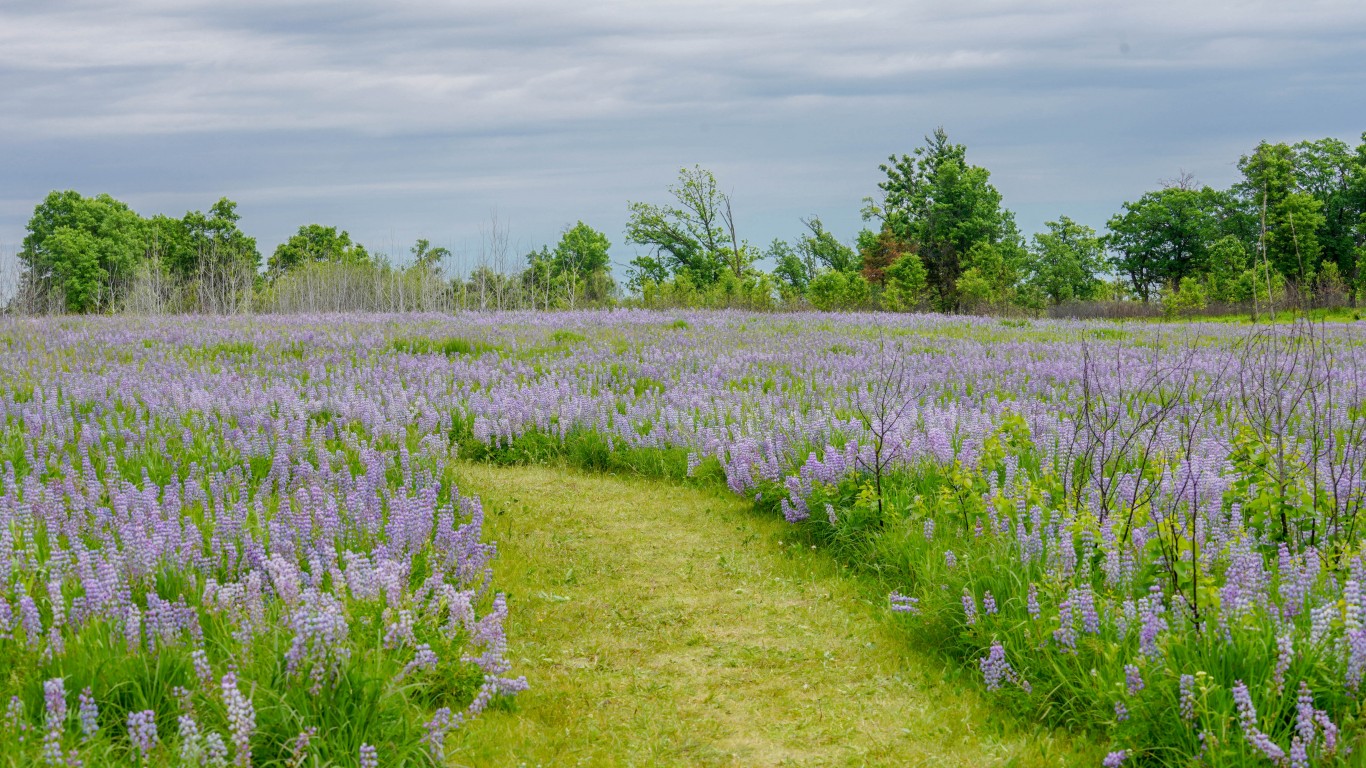
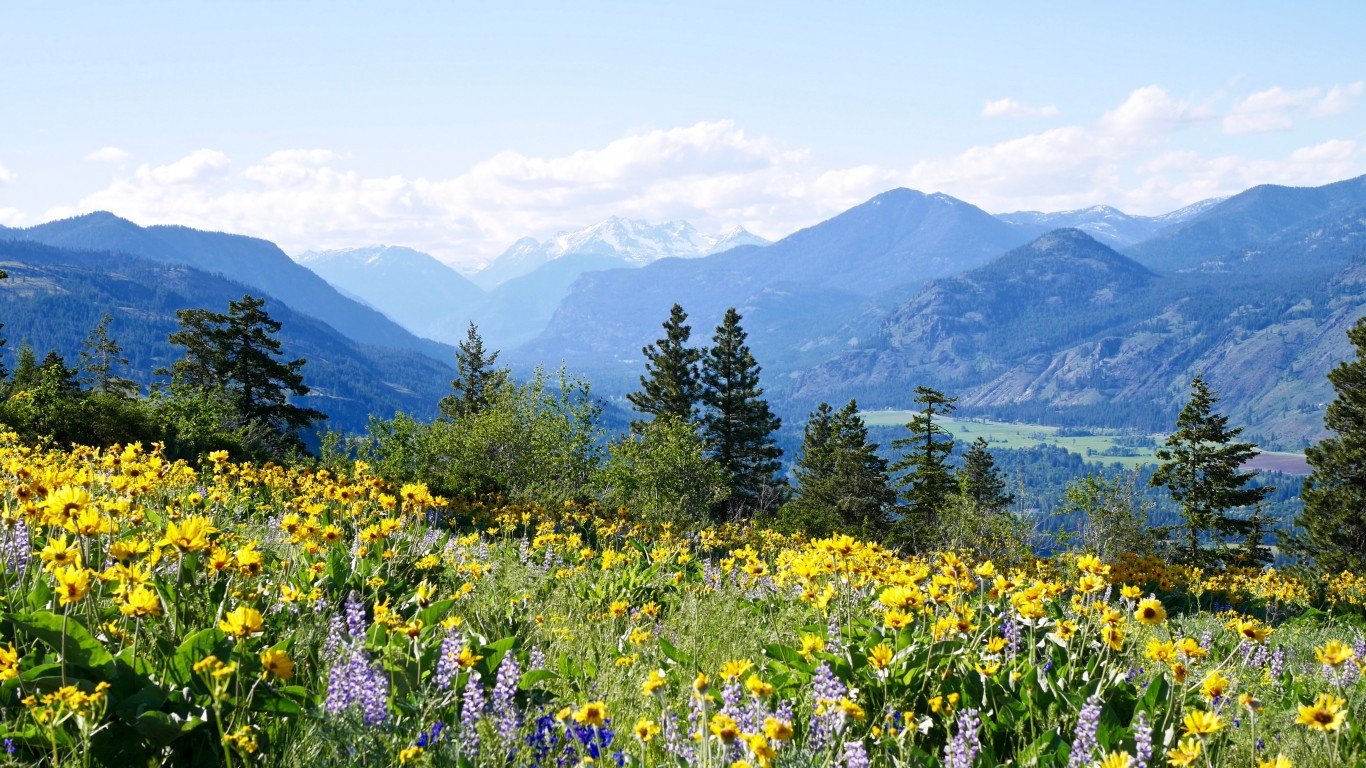
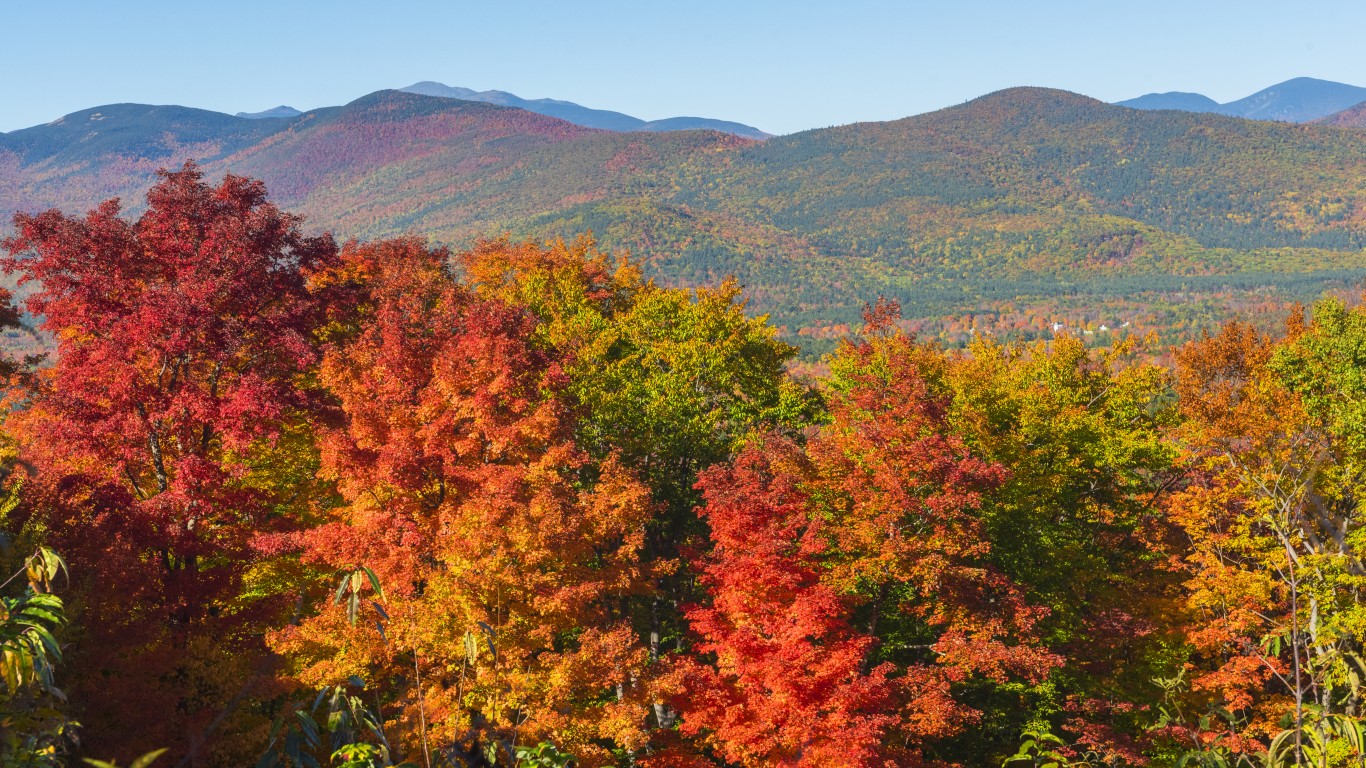
But that’s the science of sunlight. For most of us, what’s important is whether we want to live in a place that receives abundant sunlight or one that gets a little less. Some desire endless summer, while others crave a change of seasons.
The spherical shape of earth means sunlight disperses unevenly across the globe, and of course across America. Using data from the Centers for Disease Control and Prevention (CDC) for 2015, the latest year for which information is available, 24/7 Wall St. has ranked 48 states and the District of Columbia based on their annual average daily dose of UV irradiance, or the output of light energy from the sun, as measured on earth. (Data was not available for Alaska and Hawaii.) All measurements are in joules per square meter.
Click here to see the states with the strongest sunlight
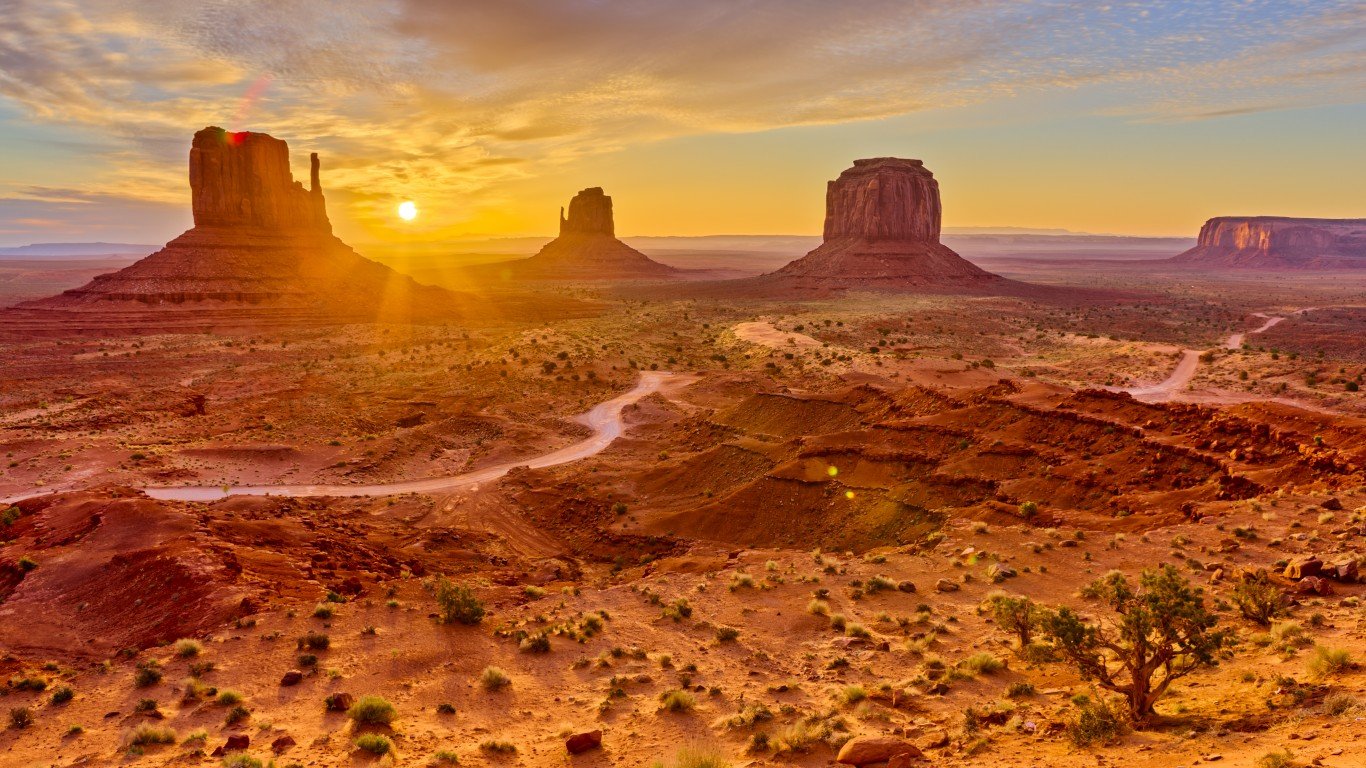
For sun worshippers, the place to be is probably what you’d expect — Arizona. It’s followed by its Sunbelt neighbor, New Mexico, and then the Sunshine State itself, Florida. Of the top 10 states for sunlight, all except Colorado are either Sunbelt or Southern states. (None are as consistently overheated, however, as the hottest inhabited places on earth.)
Prefer a cooler, less sunny climate? Go north to Maine or North Dakota. The 10 states with the least amount of sunlight can be found in New England or the Upper Midwest. Wherever you live, though, be sure to get out and enjoy the sunlight as much as you can.

49. Maine
> Annual avg. daily sunlight: 1,944 J/m2
> 10-yr. change in avg. daily sunlight: +7% (22nd largest)
> Avg. daily sunlight compared to sunniest state: 47.9% less
[in-text-ad]

48. North Dakota
> Annual avg. daily sunlight: 1,987 J/m2
> 10-yr. change in avg. daily sunlight: -1.7% (2nd smallest)
> Avg. daily sunlight compared to sunniest state: 46.7% less
[recirclink id=932846]

47. Vermont
> Annual avg. daily sunlight: 2,004 J/m2
> 10-yr. change in avg. daily sunlight: +12.9% (4th largest)
> Avg. daily sunlight compared to sunniest state: 46.2% less

46. Michigan
> Annual avg. daily sunlight: 2,045 J/m2
> 10-yr. change in avg. daily sunlight: +3.3% (15th smallest)
> Avg. daily sunlight compared to sunniest state: 45.1% less
[in-text-ad-2]
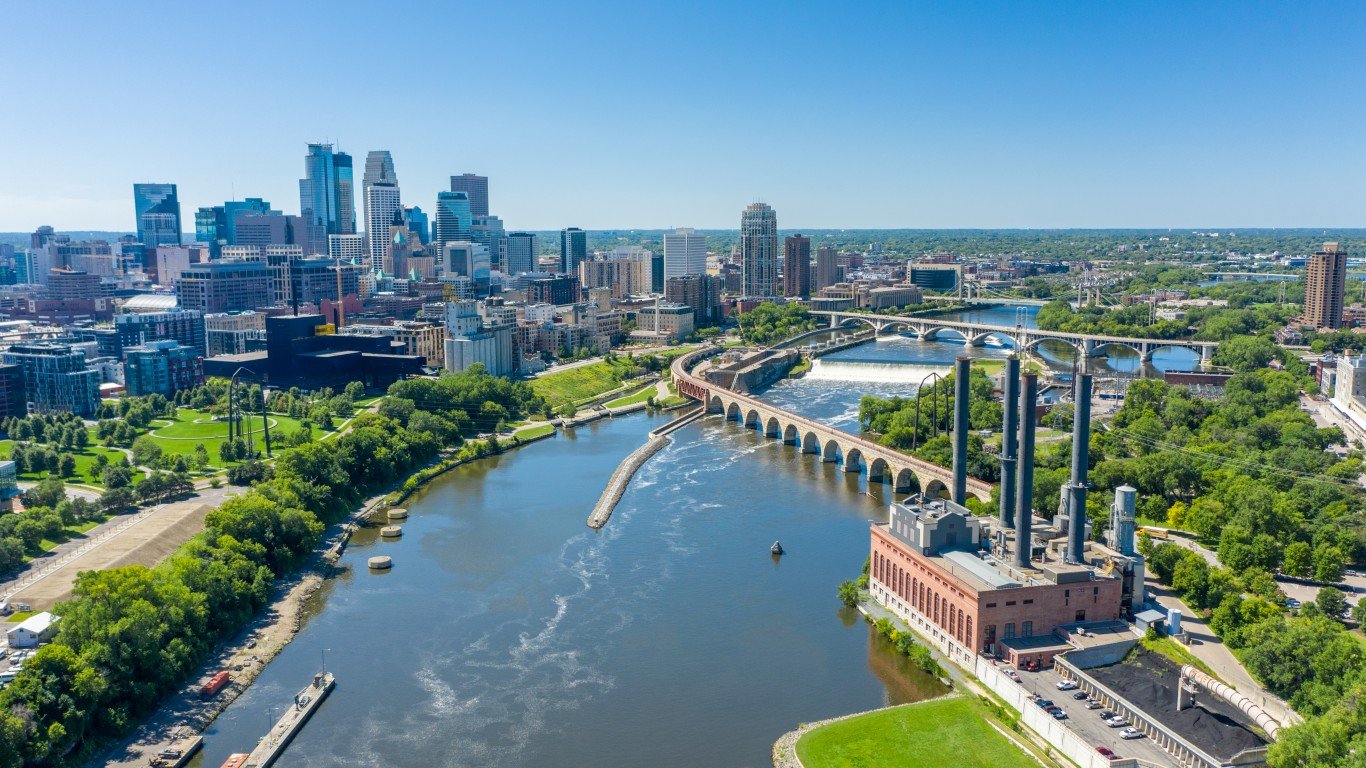
45. Minnesota
> Annual avg. daily sunlight: 2,076 J/m2
> 10-yr. change in avg. daily sunlight: +3.6% (18th smallest)
> Avg. daily sunlight compared to sunniest state: 44.3% less
44. Washington
> Annual avg. daily sunlight: 2,088 J/m2
> 10-yr. change in avg. daily sunlight: +1.7% (6th smallest)
> Avg. daily sunlight compared to sunniest state: 44% less
[in-text-ad]
43. Wisconsin
> Annual avg. daily sunlight: 2,098 J/m2
> 10-yr. change in avg. daily sunlight: +5.6% (24th largest)
> Avg. daily sunlight compared to sunniest state: 43.7% less
[recirclink id=922162]
42. New Hampshire
> Annual avg. daily sunlight: 2,107 J/m2
> 10-yr. change in avg. daily sunlight: +14.1% (2nd largest)
> Avg. daily sunlight compared to sunniest state: 43.5% less
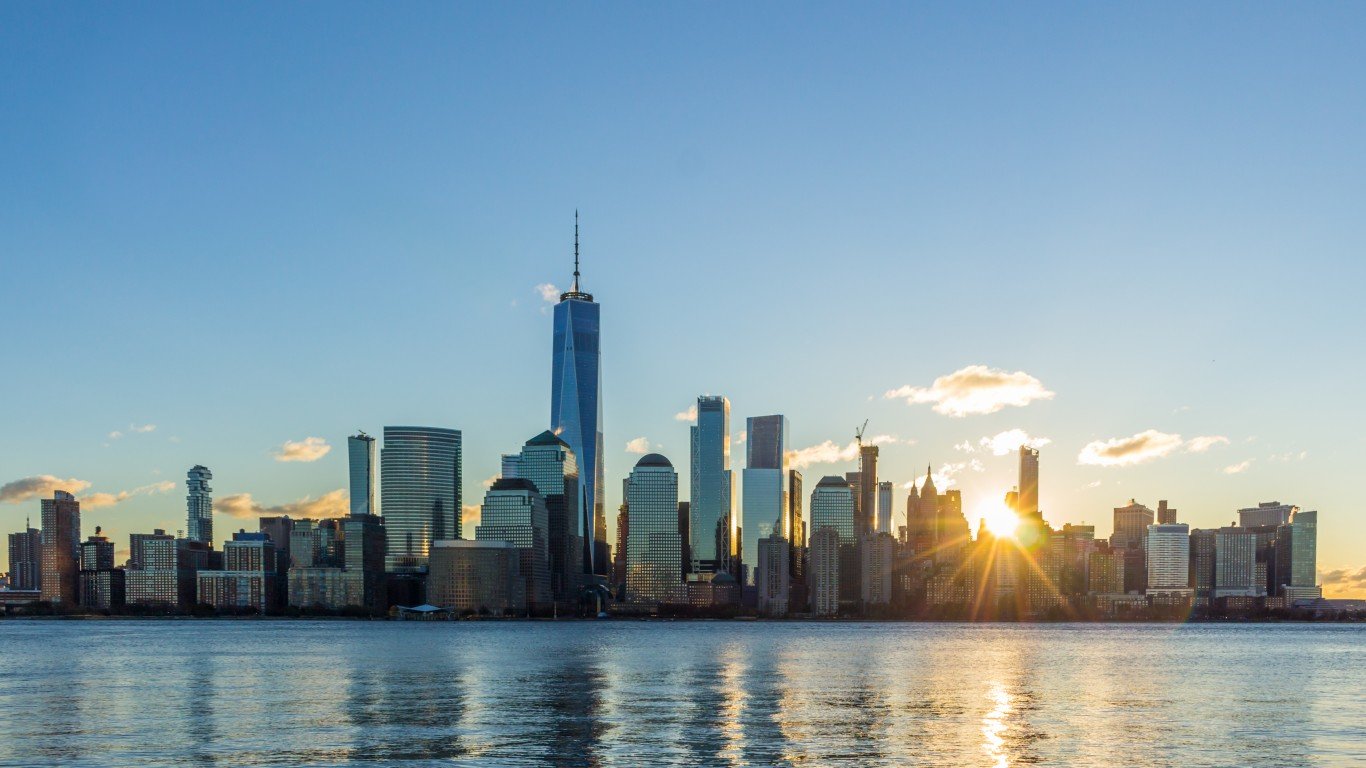
41. New York
> Annual avg. daily sunlight: 2,140 J/m2
> 10-yr. change in avg. daily sunlight: +10.7% (7th largest)
> Avg. daily sunlight compared to sunniest state: 42.6% less
[in-text-ad-2]
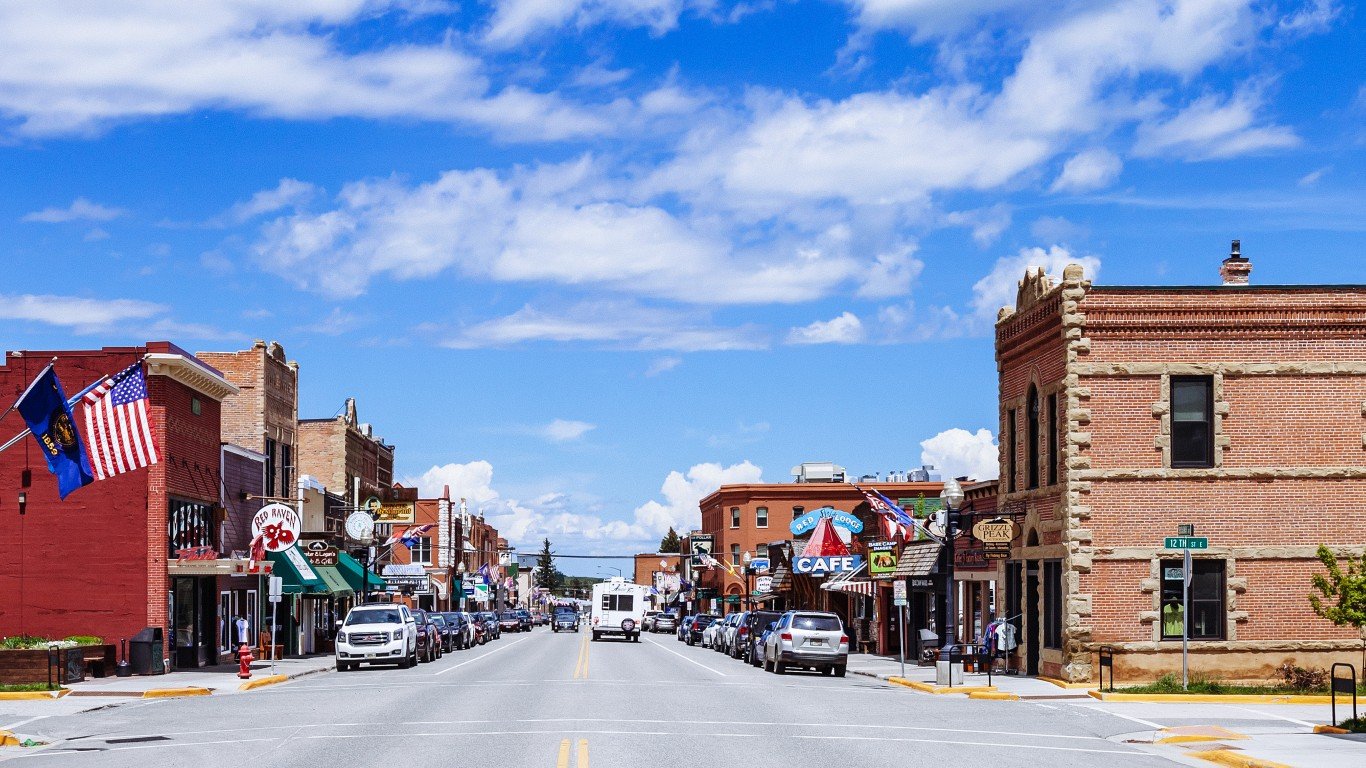
40. Montana
> Annual avg. daily sunlight: 2,174 J/m2
> 10-yr. change in avg. daily sunlight: -2.9% (the smallest)
> Avg. daily sunlight compared to sunniest state: 41.7% less
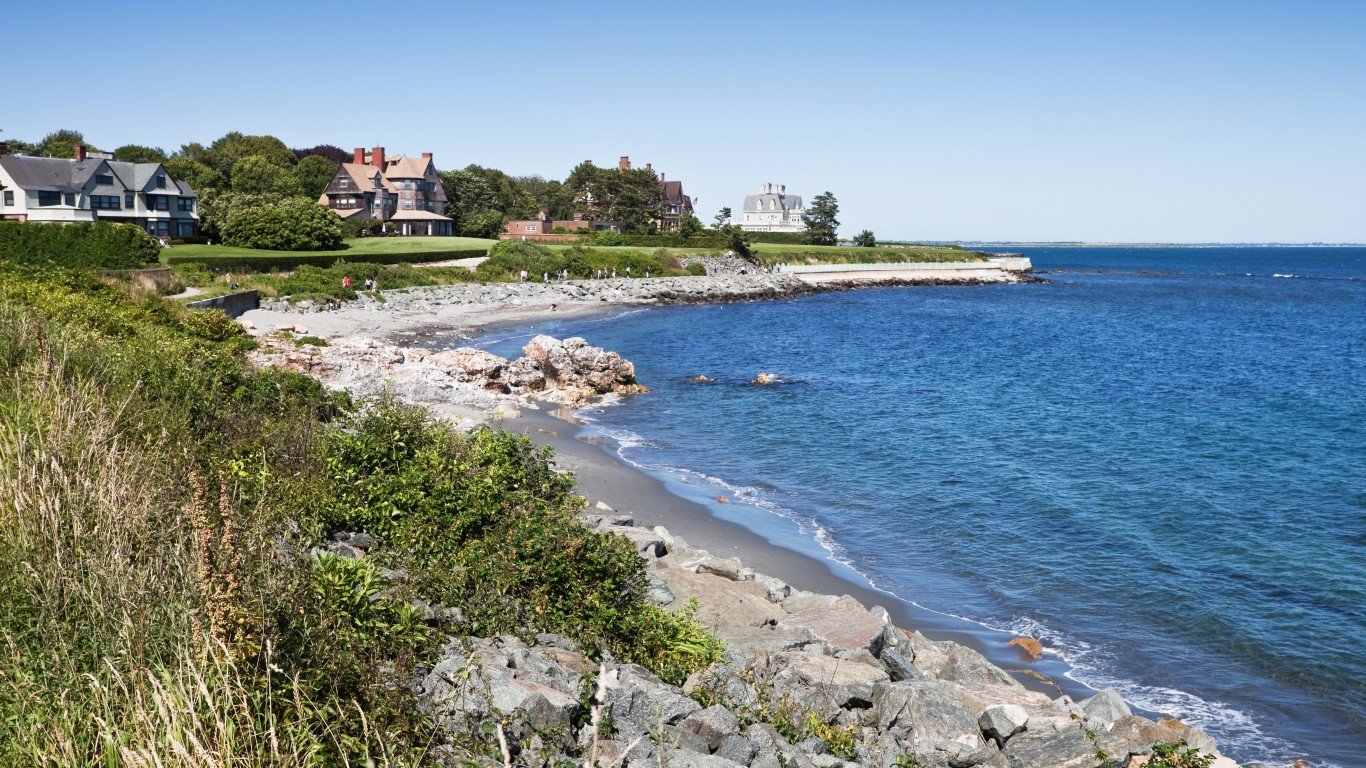
39. Rhode Island
> Annual avg. daily sunlight: 2,210 J/m2
> 10-yr. change in avg. daily sunlight: +12.1% (5th largest)
> Avg. daily sunlight compared to sunniest state: 40.7% less
[in-text-ad]

38. Massachusetts
> Annual avg. daily sunlight: 2,220 J/m2
> 10-yr. change in avg. daily sunlight: +14% (3rd largest)
> Avg. daily sunlight compared to sunniest state: 40.5% less
[recirclink id=917006]

37. Pennsylvania
> Annual avg. daily sunlight: 2,249 J/m2
> 10-yr. change in avg. daily sunlight: +7.3% (20th largest)
> Avg. daily sunlight compared to sunniest state: 39.7% less
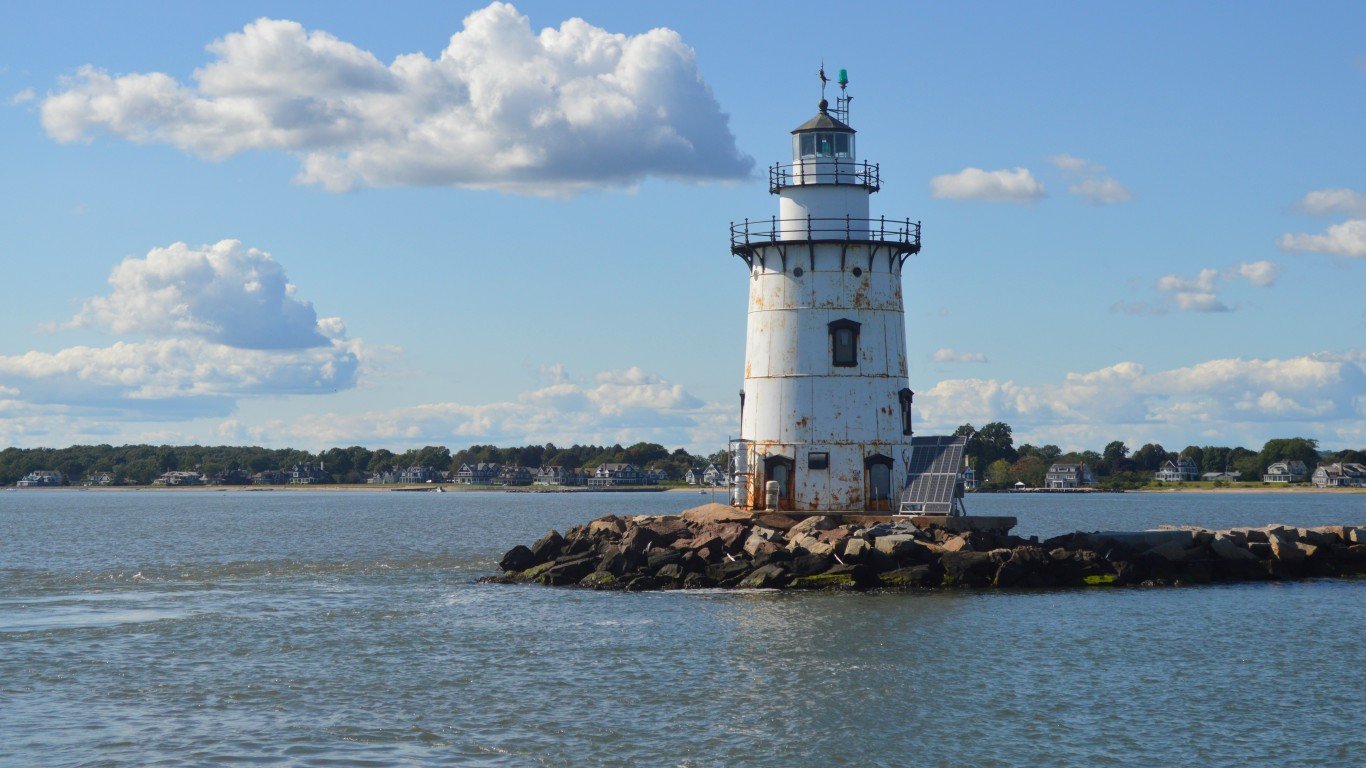
36. Connecticut
> Annual avg. daily sunlight: 2,262 J/m2
> 10-yr. change in avg. daily sunlight: +14.3% (the largest)
> Avg. daily sunlight compared to sunniest state: 39.3% less
[in-text-ad-2]
35. South Dakota
> Annual avg. daily sunlight: 2,268 J/m2
> 10-yr. change in avg. daily sunlight: +0.8% (3rd smallest)
> Avg. daily sunlight compared to sunniest state: 39.2% less

34. Ohio
> Annual avg. daily sunlight: 2,351 J/m2
> 10-yr. change in avg. daily sunlight: +8.2% (14th largest)
> Avg. daily sunlight compared to sunniest state: 36.9% less
[in-text-ad]

33. New Jersey
> Annual avg. daily sunlight: 2,372 J/m2
> 10-yr. change in avg. daily sunlight: +8.6% (13th largest)
> Avg. daily sunlight compared to sunniest state: 36.4% less
[recirclink id=909661]
32. Iowa
> Annual avg. daily sunlight: 2,375 J/m2
> 10-yr. change in avg. daily sunlight: +7.4% (19th largest)
> Avg. daily sunlight compared to sunniest state: 36.3% less
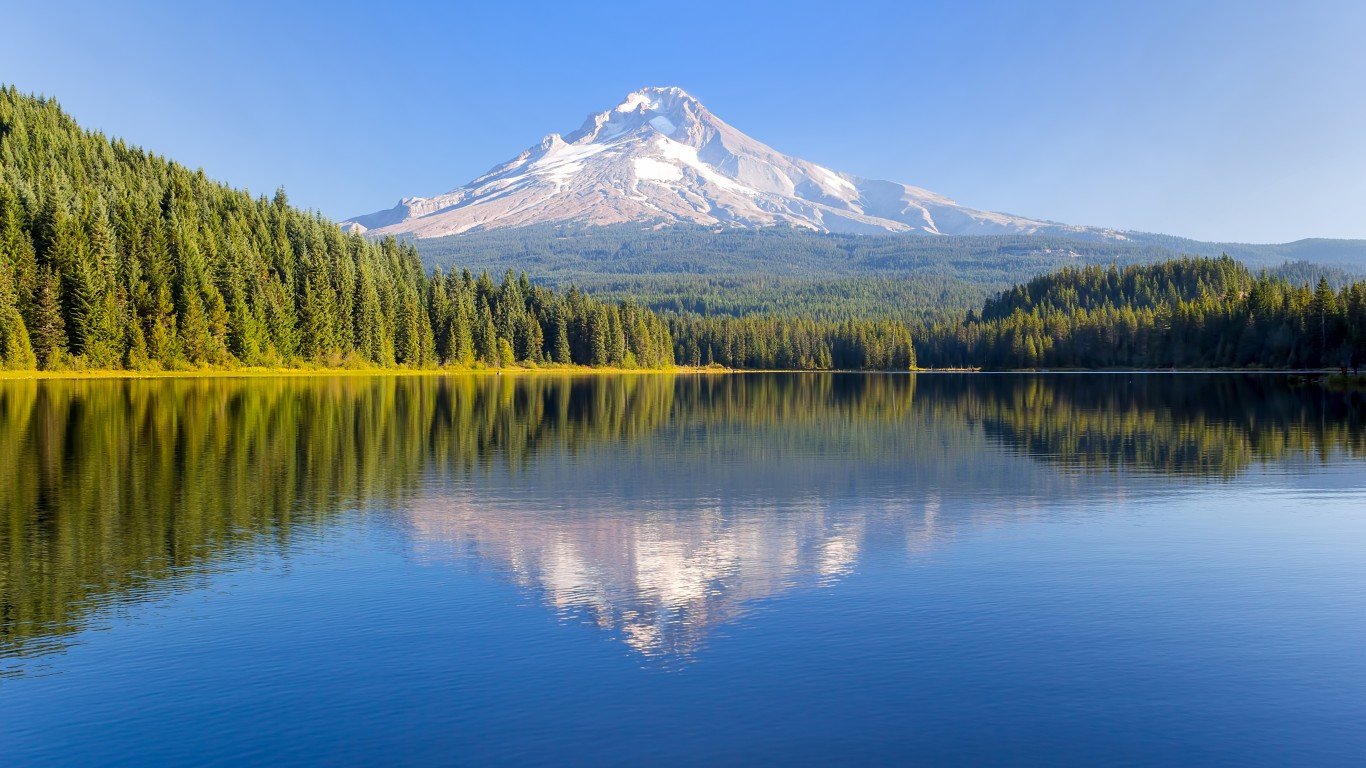
31. Oregon
> Annual avg. daily sunlight: 2,399 J/m2
> 10-yr. change in avg. daily sunlight: +3% (13th smallest)
> Avg. daily sunlight compared to sunniest state: 35.6% less
[in-text-ad-2]
30. Indiana
> Annual avg. daily sunlight: 2,427 J/m2
> 10-yr. change in avg. daily sunlight: +8.8% (11th largest)
> Avg. daily sunlight compared to sunniest state: 34.9% less

29. District of Columbia
> Annual avg. daily sunlight: 2,495 J/m2
> 10-yr. change in avg. daily sunlight: +7.5% (18th largest)
> Avg. daily sunlight compared to sunniest state: 33.1% less
[in-text-ad]

28. Maryland
> Annual avg. daily sunlight: 2,499 J/m2
> 10-yr. change in avg. daily sunlight: +7.1% (21st largest)
> Avg. daily sunlight compared to sunniest state: 33% less
[recirclink id=932846]
27. Delaware
> Annual avg. daily sunlight: 2,505 J/m2
> 10-yr. change in avg. daily sunlight: +7.7% (16th largest)
> Avg. daily sunlight compared to sunniest state: 32.8% less

26. Illinois
> Annual avg. daily sunlight: 2,506 J/m2
> 10-yr. change in avg. daily sunlight: +9.1% (9th largest)
> Avg. daily sunlight compared to sunniest state: 32.8% less
[in-text-ad-2]
25. West Virginia
> Annual avg. daily sunlight: 2,527 J/m2
> 10-yr. change in avg. daily sunlight: +10.3% (8th largest)
> Avg. daily sunlight compared to sunniest state: 32.2% less

24. Idaho
> Annual avg. daily sunlight: 2,551 J/m2
> 10-yr. change in avg. daily sunlight: +1.8% (7th smallest)
> Avg. daily sunlight compared to sunniest state: 31.6% less
[in-text-ad]

23. Nebraska
> Annual avg. daily sunlight: 2,576 J/m2
> 10-yr. change in avg. daily sunlight: +1.5% (5th smallest)
> Avg. daily sunlight compared to sunniest state: 30.9% less
[recirclink id=922162]
22. Missouri
> Annual avg. daily sunlight: 2,658 J/m2
> 10-yr. change in avg. daily sunlight: +4.8% (22nd smallest)
> Avg. daily sunlight compared to sunniest state: 28.7% less
21. Virginia
> Annual avg. daily sunlight: 2,710 J/m2
> 10-yr. change in avg. daily sunlight: +8.7% (12th largest)
> Avg. daily sunlight compared to sunniest state: 27.3% less
[in-text-ad-2]

20. Kentucky
> Annual avg. daily sunlight: 2,711 J/m2
> 10-yr. change in avg. daily sunlight: +11.7% (6th largest)
> Avg. daily sunlight compared to sunniest state: 27.3% less

19. Wyoming
> Annual avg. daily sunlight: 2,794 J/m2
> 10-yr. change in avg. daily sunlight: +2.1% (9th smallest)
> Avg. daily sunlight compared to sunniest state: 25.1% less
[in-text-ad]

18. Kansas
> Annual avg. daily sunlight: 2,892 J/m2
> 10-yr. change in avg. daily sunlight: +3.4% (16th smallest)
> Avg. daily sunlight compared to sunniest state: 22.4% less
[recirclink id=917006]
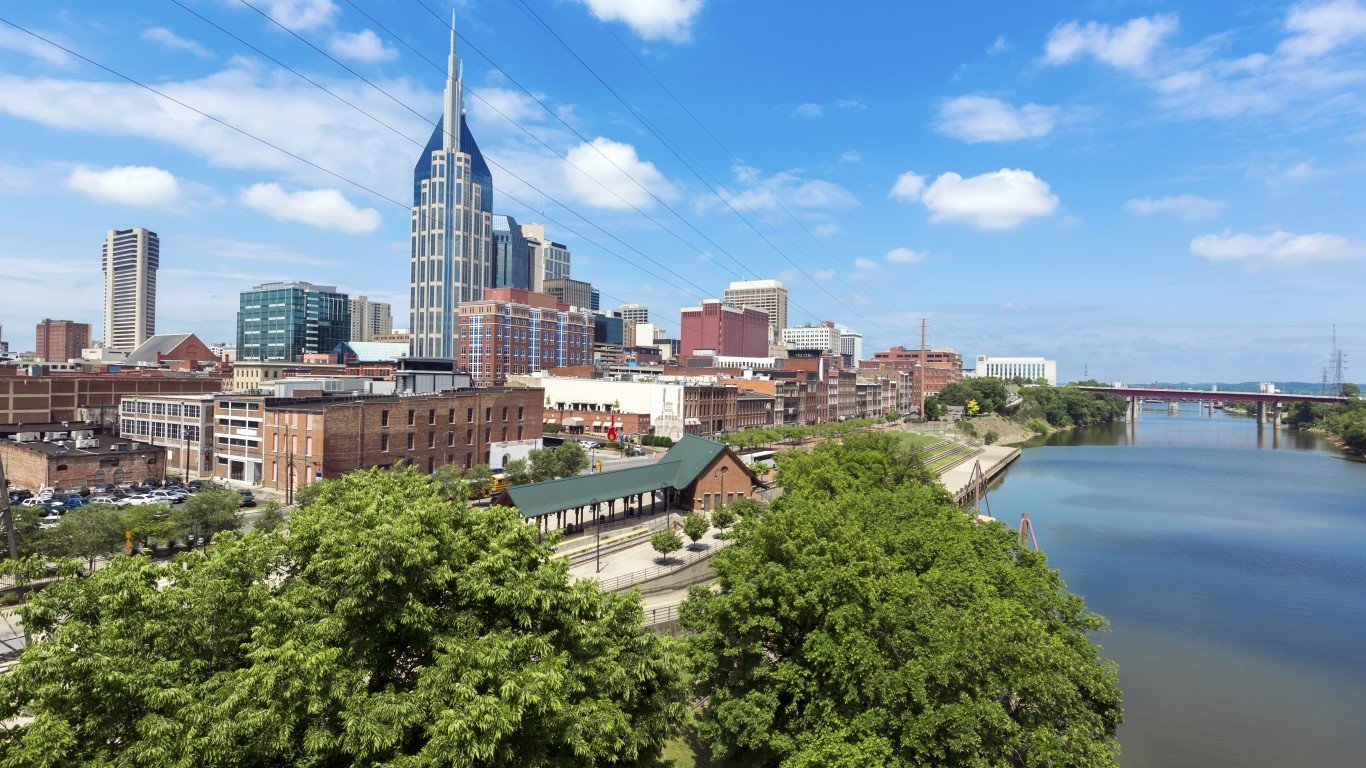
17. Tennessee
> Annual avg. daily sunlight: 2,910 J/m2
> 10-yr. change in avg. daily sunlight: +9.1% (10th largest)
> Avg. daily sunlight compared to sunniest state: 21.9% less
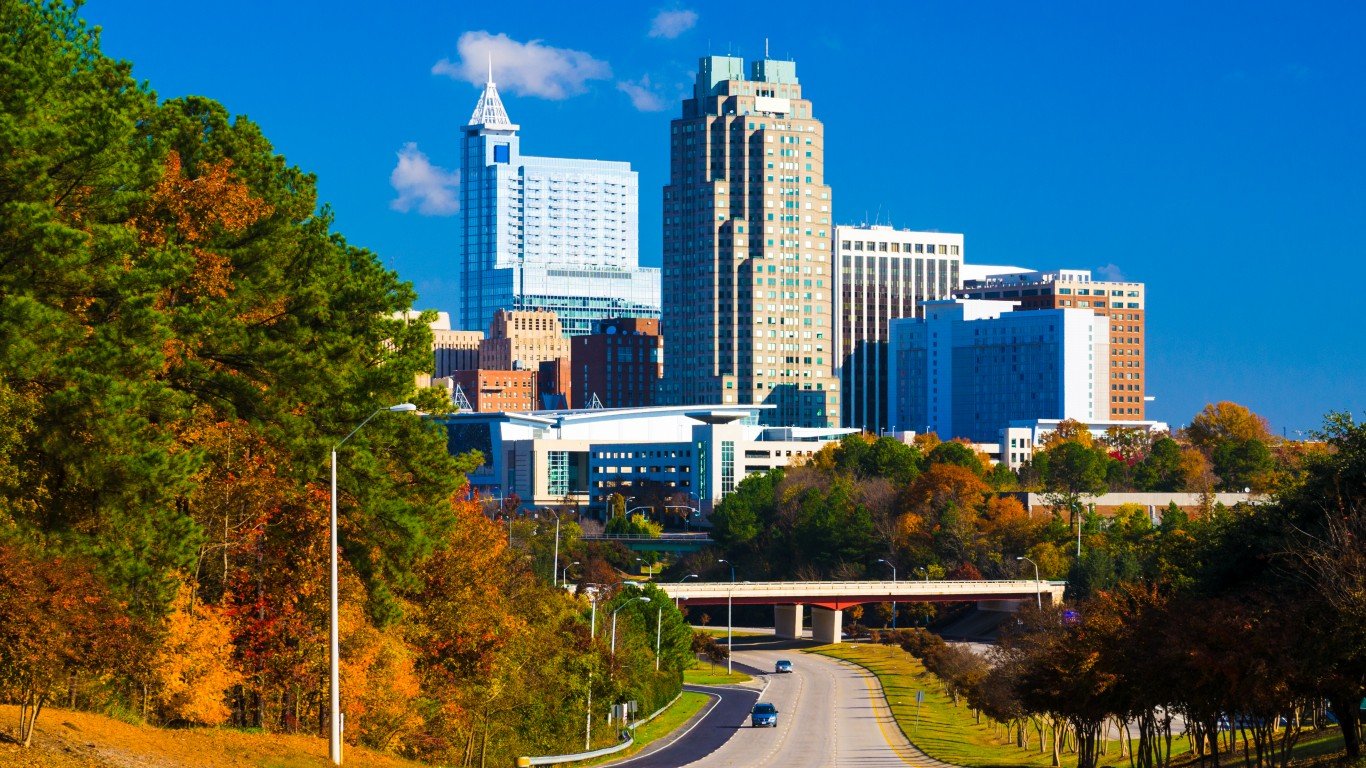
16. North Carolina
> Annual avg. daily sunlight: 2,968 J/m2
> 10-yr. change in avg. daily sunlight: +8.1% (15th largest)
> Avg. daily sunlight compared to sunniest state: 20.4% less
[in-text-ad-2]
15. Arkansas
> Annual avg. daily sunlight: 3,031 J/m2
> 10-yr. change in avg. daily sunlight: +4.9% (23rd smallest)
> Avg. daily sunlight compared to sunniest state: 18.7% less
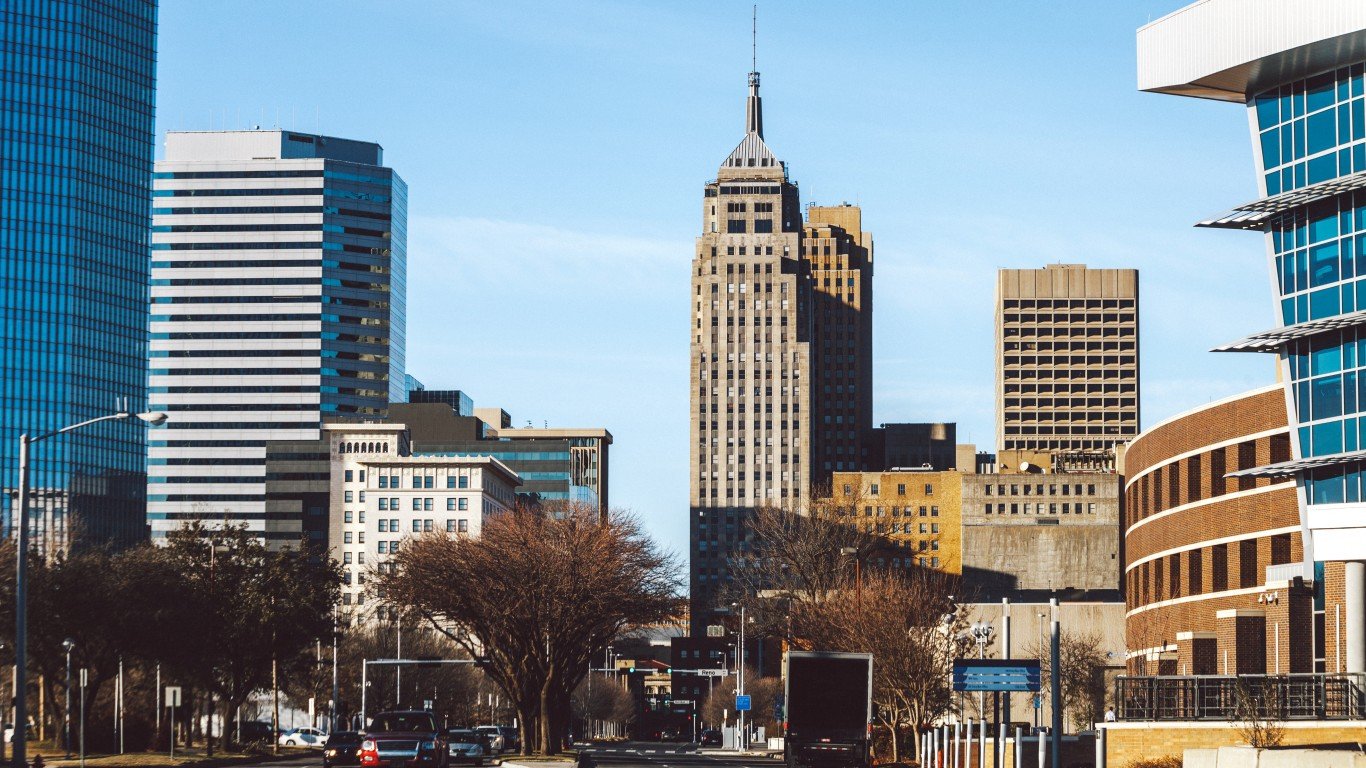
14. Oklahoma
> Annual avg. daily sunlight: 3,099 J/m2
> 10-yr. change in avg. daily sunlight: +2.2% (10th smallest)
> Avg. daily sunlight compared to sunniest state: 16.9% less
[in-text-ad]

13. South Carolina
> Annual avg. daily sunlight: 3,179 J/m2
> 10-yr. change in avg. daily sunlight: +7.5% (17th largest)
> Avg. daily sunlight compared to sunniest state: 14.7% less
[recirclink id=909661]

12. Utah
> Annual avg. daily sunlight: 3,191 J/m2
> 10-yr. change in avg. daily sunlight: +4.9% (24th smallest)
> Avg. daily sunlight compared to sunniest state: 14.4% less

11. Nevada
> Annual avg. daily sunlight: 3,197 J/m2
> 10-yr. change in avg. daily sunlight: +2.4% (12th smallest)
> Avg. daily sunlight compared to sunniest state: 14.2% less
[in-text-ad-2]
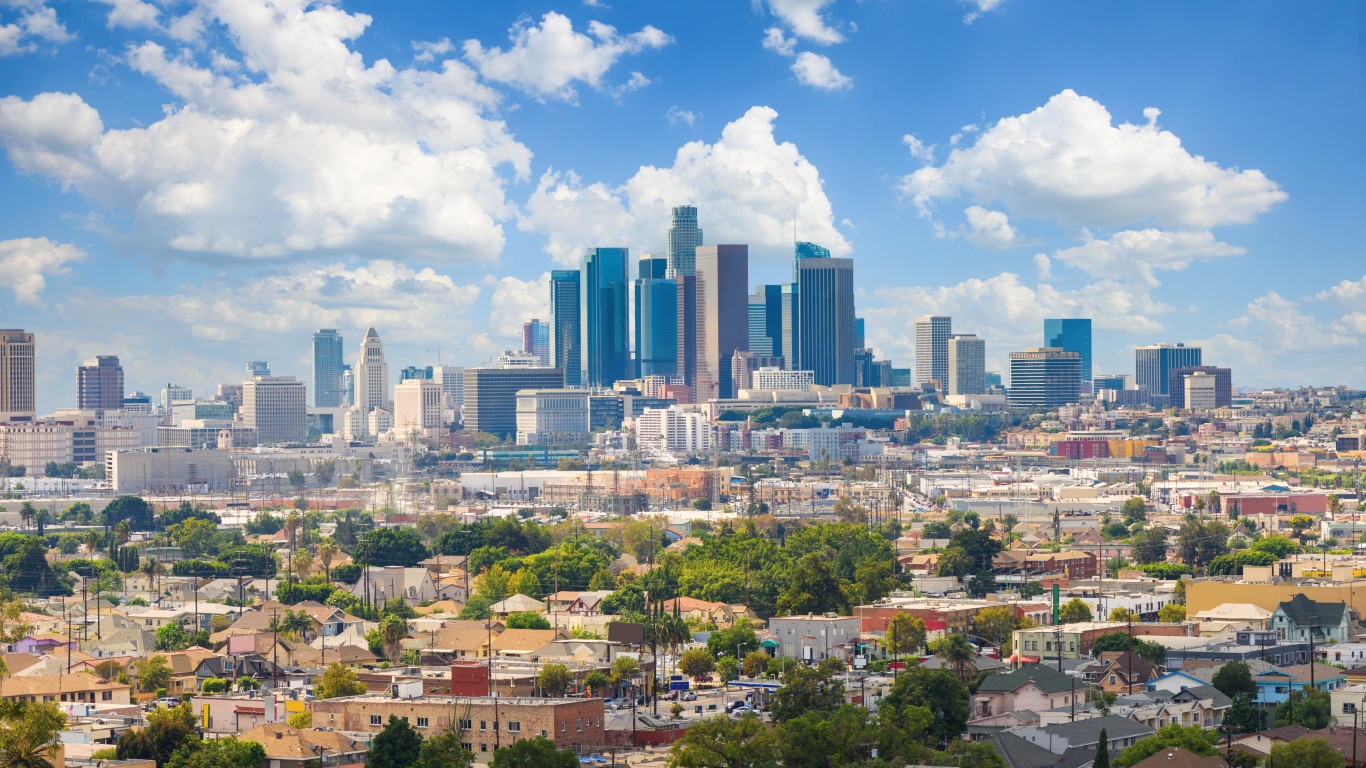
10. California
> Annual avg. daily sunlight: 3,216 J/m2
> 10-yr. change in avg. daily sunlight: +6.8% (23rd largest)
> Avg. daily sunlight compared to sunniest state: 13.7% less
9. Mississippi
> Annual avg. daily sunlight: 3,221 J/m2
> 10-yr. change in avg. daily sunlight: +3.1% (14th smallest)
> Avg. daily sunlight compared to sunniest state: 13.6% less
[in-text-ad]

8. Alabama
> Annual avg. daily sunlight: 3,225 J/m2
> 10-yr. change in avg. daily sunlight: +3.6% (17th smallest)
> Avg. daily sunlight compared to sunniest state: 13.5% less
[recirclink id=922162]

7. Georgia
> Annual avg. daily sunlight: 3,277 J/m2
> 10-yr. change in avg. daily sunlight: +5.5% (25th largest)
> Avg. daily sunlight compared to sunniest state: 12.1% less

6. Louisiana
> Annual avg. daily sunlight: 3,346 J/m2
> 10-yr. change in avg. daily sunlight: +1.9% (8th smallest)
> Avg. daily sunlight compared to sunniest state: 10.2% less
[in-text-ad-2]
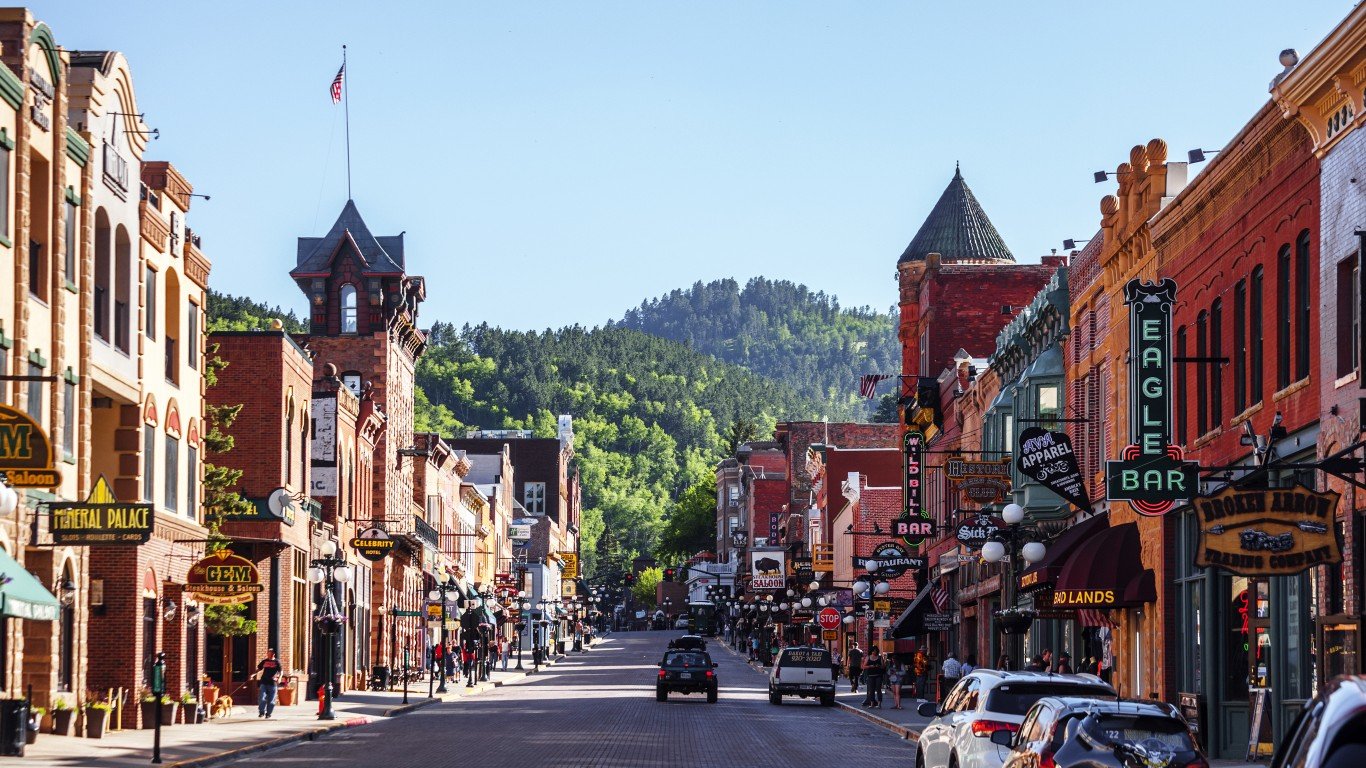
5. Colorado
> Annual avg. daily sunlight: 3,535 J/m2
> 10-yr. change in avg. daily sunlight: +4.3% (20th smallest)
> Avg. daily sunlight compared to sunniest state: 5.2% less

4. Texas
> Annual avg. daily sunlight: 3,538 J/m2
> 10-yr. change in avg. daily sunlight: +2.2% (11th smallest)
> Avg. daily sunlight compared to sunniest state: 5.1% less
[in-text-ad]
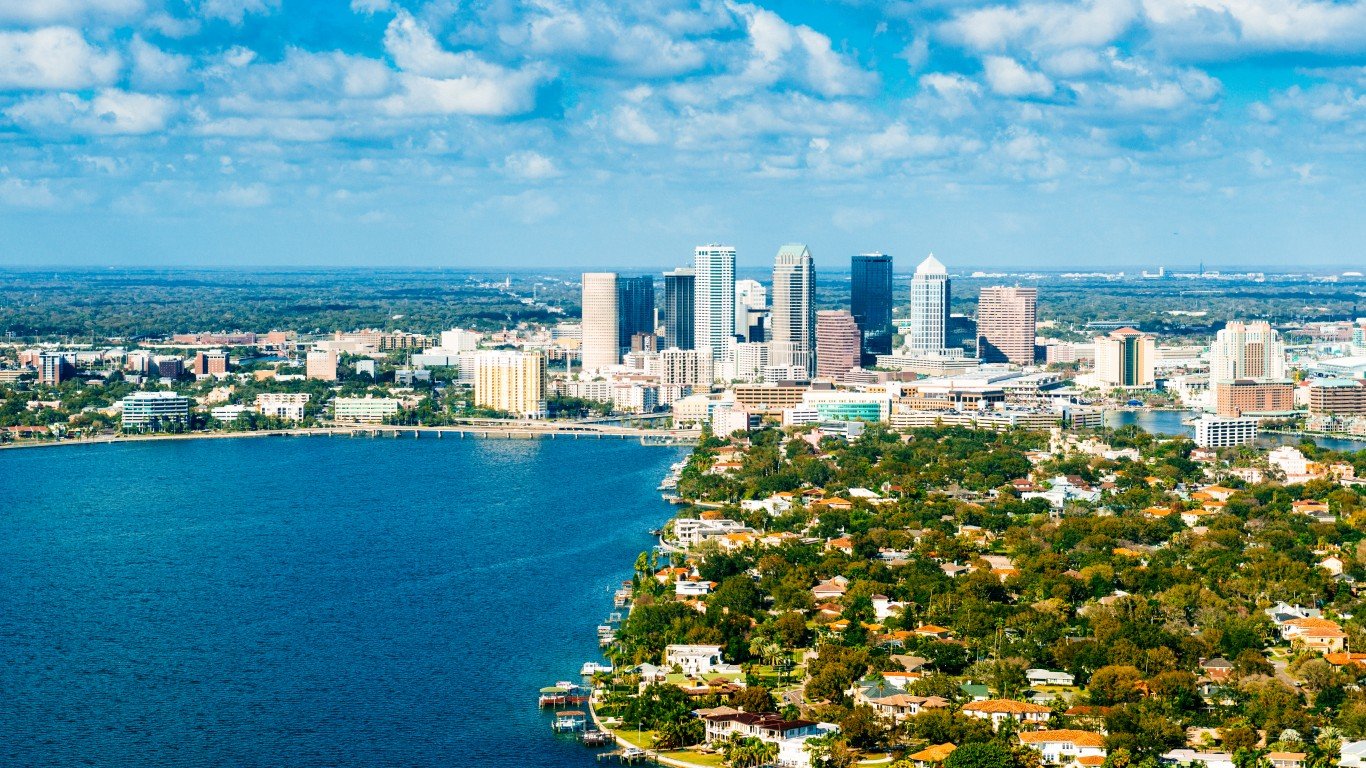
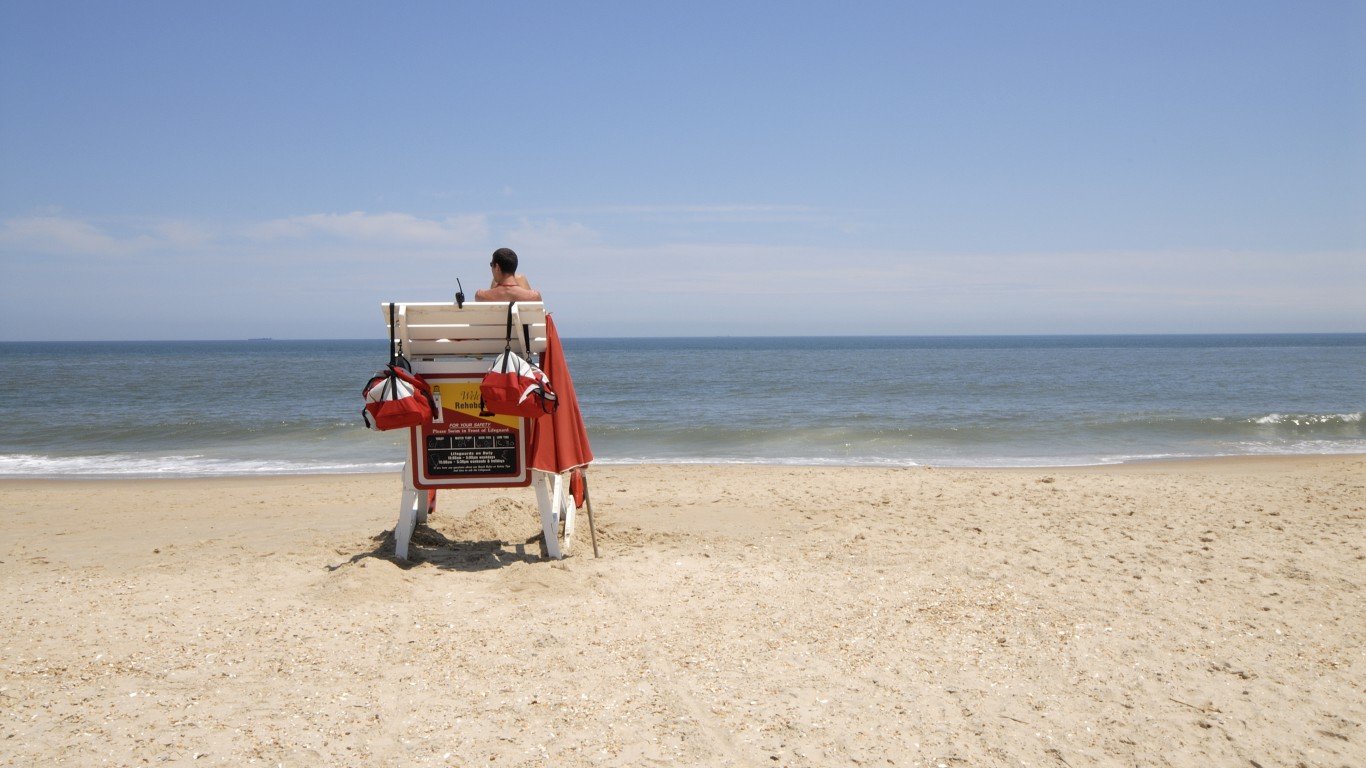
3. Florida
> Annual avg. daily sunlight: 3,636 J/m2
> 10-yr. change in avg. daily sunlight: +0.9% (4th smallest)
> Avg. daily sunlight compared to sunniest state: 2.5% less
[recirclink id=932846]

2. New Mexico
> Annual avg. daily sunlight: 3,723 J/m2
> 10-yr. change in avg. daily sunlight: +4.3% (21st smallest)
> Avg. daily sunlight compared to sunniest state: 0.1% less
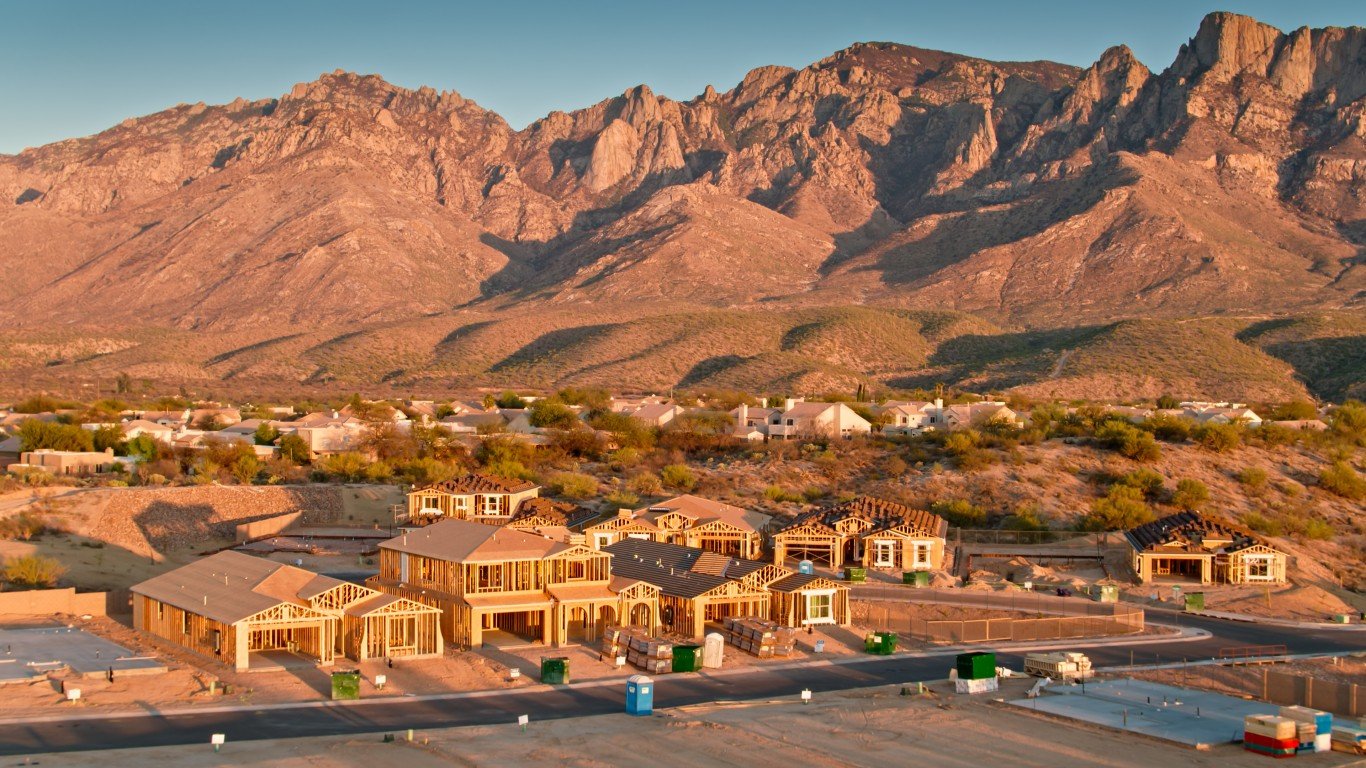
1. Arizona
> Annual avg. daily sunlight: 3,728 J/m2
> 10-yr. change in avg. daily sunlight: +4% (19th smallest)
> Avg. daily sunlight compared to sunniest state: N/A
Contact [email protected] for any questions or corrections.