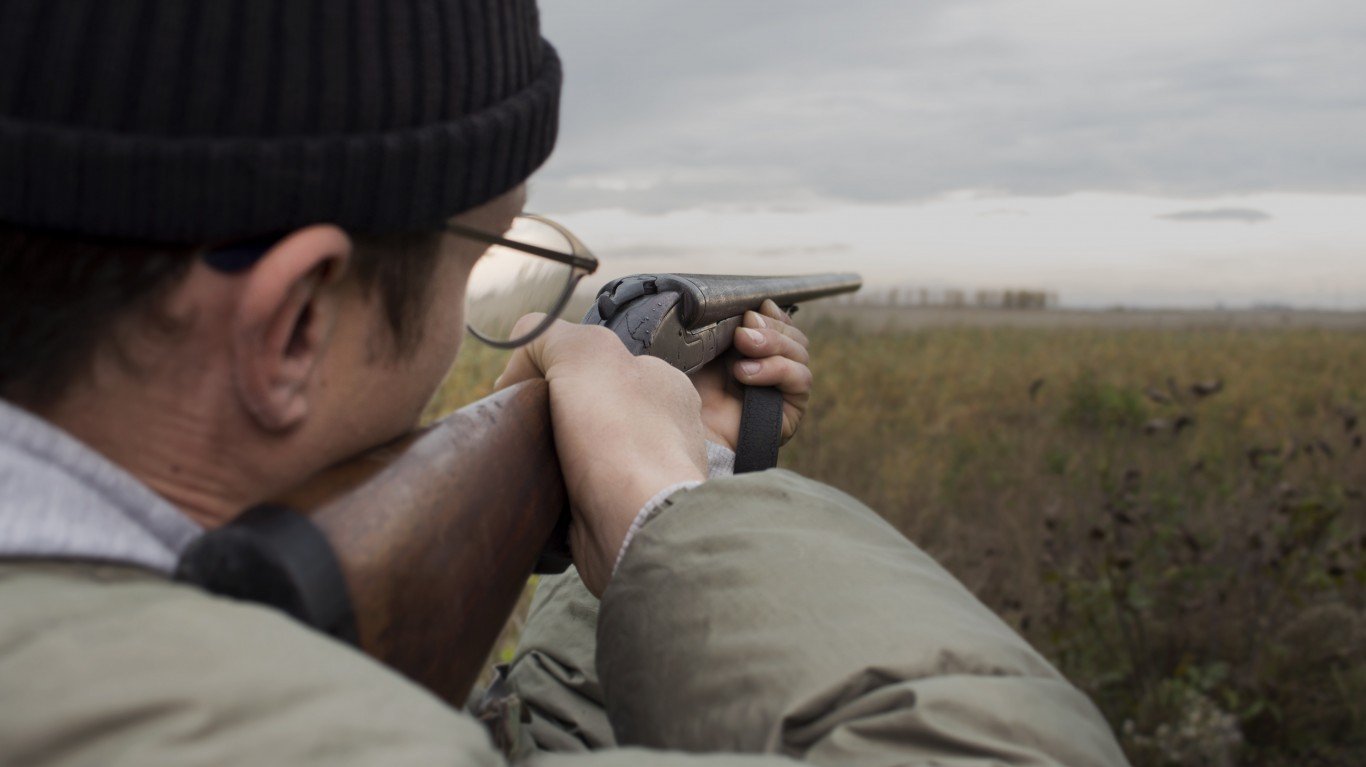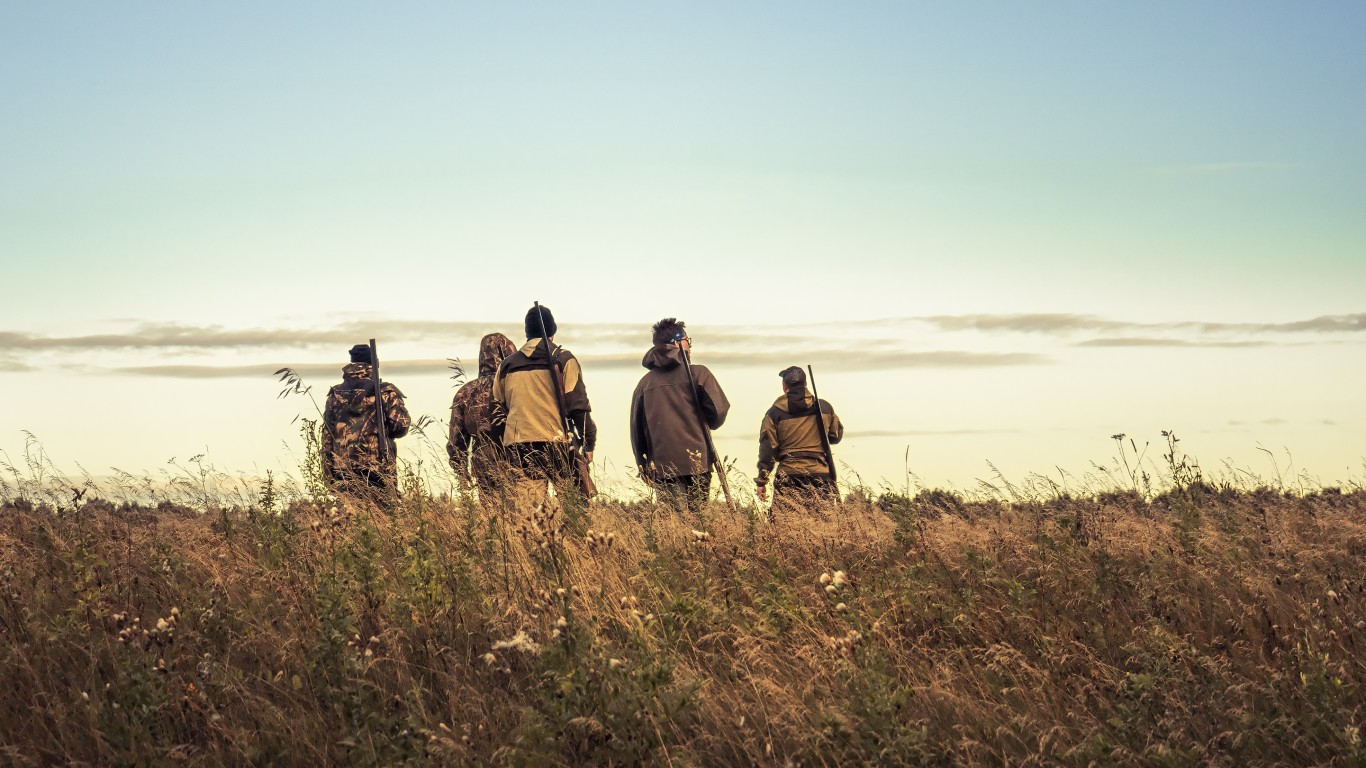
Almost 16 million Americans were issued paid hunting licenses in 2021. Hunting is a part of the American frontiersman image and an important aspect of the nation’s culture. Hunting has evolved from a form of survival to a way of life for many people. There are hunters in every state, but as a percentage, hunting is a far more important pastime in some states than others.
To determine the states with the most hunters, 24/7 Wall St. reviewed data on hunting license apportionments from the U.S. Fish and Wildlife Service. States were ranked based on the number of paid hunting licenses issued within in 2021 per 100 residents. (Also see, the most versatile hunting rifle cartridges.)
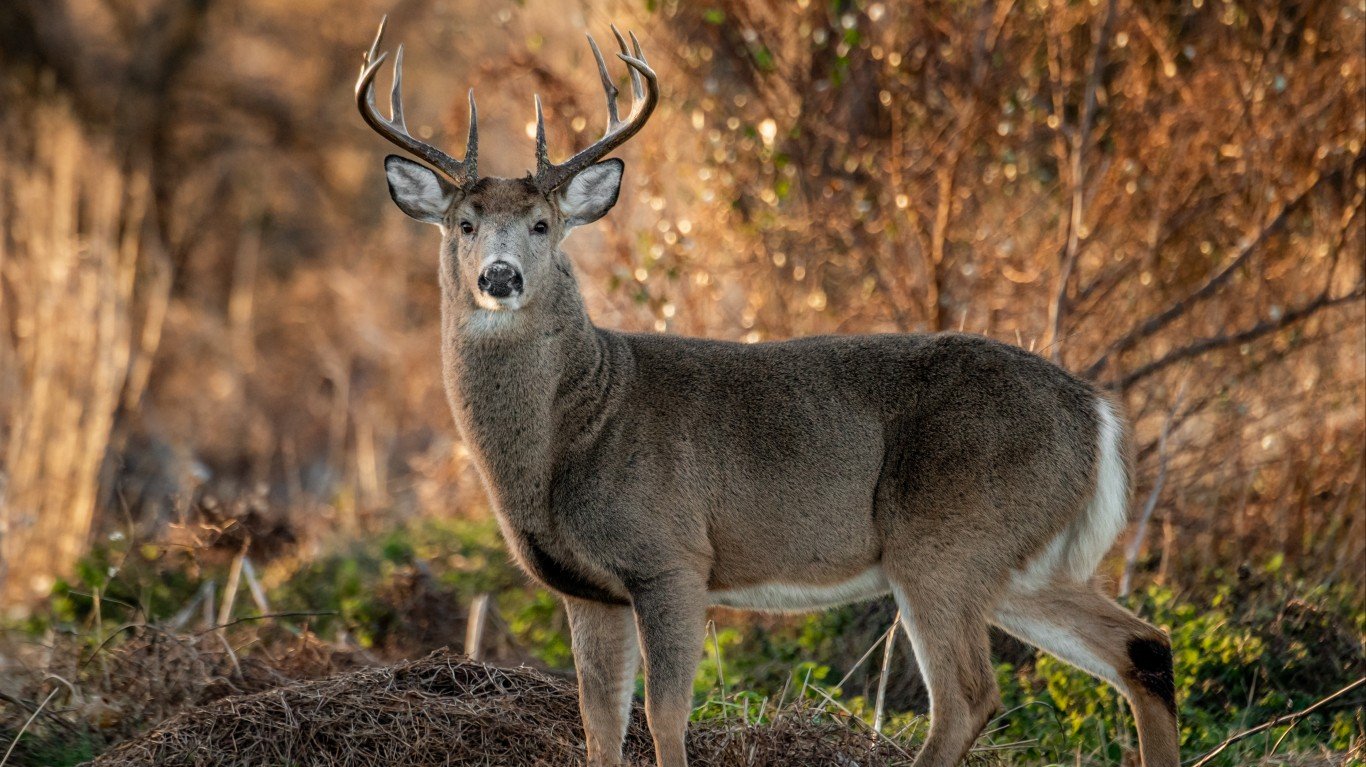
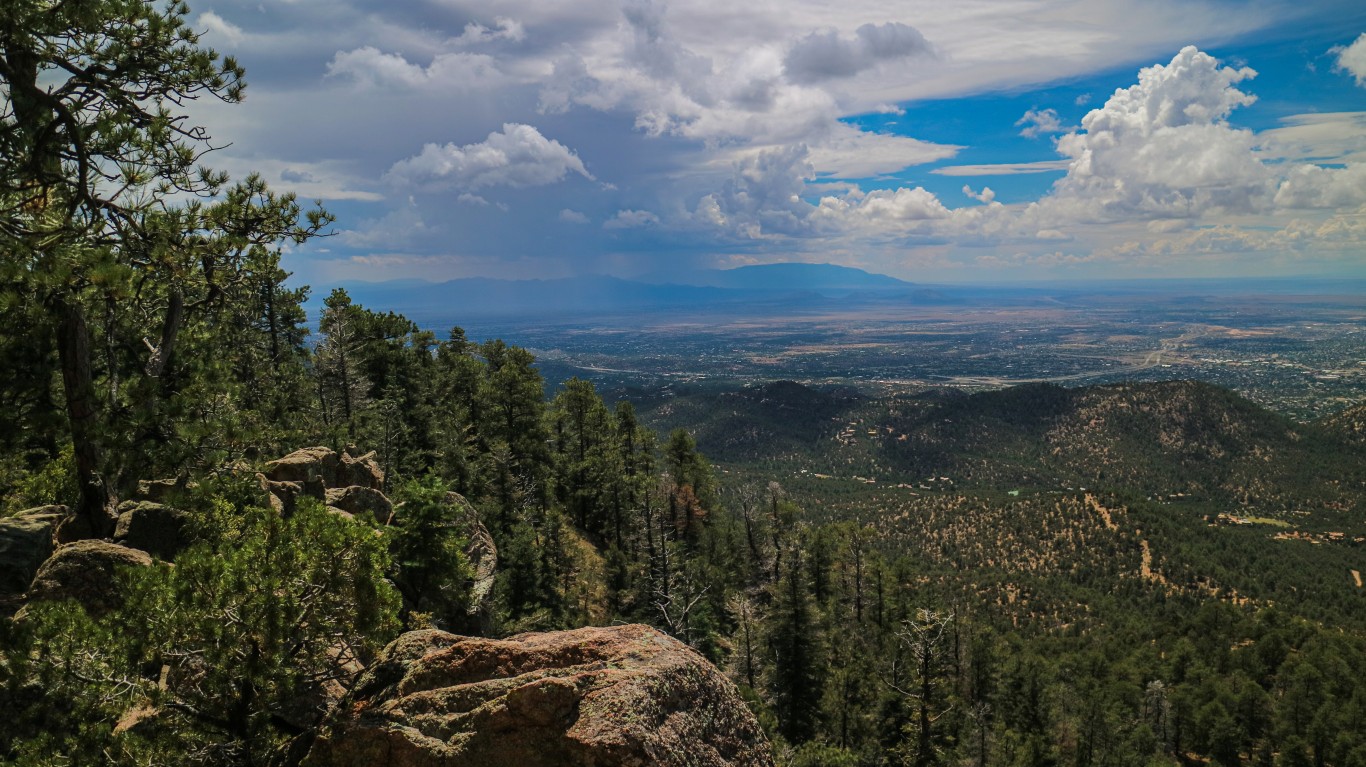
Hunting regulations vary from state to state. Certain animal species are protected by federal law, and in some states special licenses are required that explain the type of game that can be hunted. Limited access to public lands also constrains where hunters can hunt. In eight Western states, public lands account for more than 50% of a state’s total area.
The five states with the highest percentage of paid hunting licenses issued in 2021 per 100 residents — Wyoming, South Dakota, Montana, North Dakota, and Idaho — are all in the West and are among the least densely-populated states. Hunters in some of these states are also paying the highest premium for hunting licenses in the country. Wyoming, Montana, and Idaho have three of the five highest gross costs for hunting licenses. (Many hunters choose a double-barrel shotgun. Here are the most popular double-barrel shotguns in America and how much they cost.)
Conversely, the states with fewest number of licenses issued in 2021 per 100 residents are mostly in the Northeast: Rhode Island, New Jersey, Massachusetts, Connecticut, and Delaware. These states are also the most densely-populated in the United States.
Click here to see the states with the most hunters.
Click here to read our detailed methodology.

50. California
> Paid hunting licenses issued in 2021: 0.7 per 100 residents
> Avg. hunting license expense in 2021: $86.67 per hunter (16th most)
> Total paid hunting licenses issued in 2021: 278,210 (23rd most)
> Public lands as % of total state area: 55.9% (6th most)
[in-text-ad]
49. Rhode Island
> Paid hunting licenses issued in 2021: 0.7 per 100 residents
> Avg. hunting license expense in 2021: $63.84 per hunter (25th least)
> Total paid hunting licenses issued in 2021: 7,985 (the least)
> Public lands as % of total state area: 10.9% (17th least)
[recirclink id=1185572]
48. New Jersey
> Paid hunting licenses issued in 2021: 0.8 per 100 residents
> Avg. hunting license expense in 2021: $114.71 per hunter (6th most)
> Total paid hunting licenses issued in 2021: 71,707 (8th least)
> Public lands as % of total state area: 23.6% (16th most)

47. Hawaii
> Paid hunting licenses issued in 2021: 0.8 per 100 residents
> Avg. hunting license expense in 2021: $40.91 per hunter (9th least)
> Total paid hunting licenses issued in 2021: 11,270 (2nd least)
> Public lands as % of total state area: 40.5% (11th most)
[in-text-ad-2]
46. Massachusetts
> Paid hunting licenses issued in 2021: 0.9 per 100 residents
> Avg. hunting license expense in 2021: $43.51 per hunter (12th least)
> Total paid hunting licenses issued in 2021: 59,652 (5th least)
> Public lands as % of total state area: 19.4% (18th most)
45. Connecticut
> Paid hunting licenses issued in 2021: 0.9 per 100 residents
> Avg. hunting license expense in 2021: $71.24 per hunter (24th most)
> Total paid hunting licenses issued in 2021: 30,807 (4th least)
> Public lands as % of total state area: 15.8% (25th most)
[in-text-ad]
44. Florida
> Paid hunting licenses issued in 2021: 1.0 per 100 residents
> Avg. hunting license expense in 2021: $36.67 per hunter (6th least)
> Total paid hunting licenses issued in 2021: 217,113 (19th least)
> Public lands as % of total state area: 27.0% (14th most)
[recirclink id=1185572]
43. Delaware
> Paid hunting licenses issued in 2021: 1.7 per 100 residents
> Avg. hunting license expense in 2021: $91.41 per hunter (13th most)
> Total paid hunting licenses issued in 2021: 16,728 (3rd least)
> Public lands as % of total state area: 14.6% (22nd least)
42. Maryland
> Paid hunting licenses issued in 2021: 1.9 per 100 residents
> Avg. hunting license expense in 2021: $54.44 per hunter (20th least)
> Total paid hunting licenses issued in 2021: 116,422 (11th least)
> Public lands as % of total state area: 14.1% (21st least)
[in-text-ad-2]
41. Illinois
> Paid hunting licenses issued in 2021: 2.3 per 100 residents
> Avg. hunting license expense in 2021: $111.83 per hunter (7th most)
> Total paid hunting licenses issued in 2021: 289,922 (21st most)
> Public lands as % of total state area: 4.3% (5th least)
40. Washington
> Paid hunting licenses issued in 2021: 2.4 per 100 residents
> Avg. hunting license expense in 2021: $103.00 per hunter (8th most)
> Total paid hunting licenses issued in 2021: 185,147 (16th least)
> Public lands as % of total state area: 38.3% (12th most)
[in-text-ad]
39. New York
> Paid hunting licenses issued in 2021: 2.8 per 100 residents
> Avg. hunting license expense in 2021: $42.13 per hunter (11th least)
> Total paid hunting licenses issued in 2021: 560,346 (8th most)
> Public lands as % of total state area: 15.3% (25th least)
[recirclink id=1215966]
38. Virginia
> Paid hunting licenses issued in 2021: 2.9 per 100 residents
> Avg. hunting license expense in 2021: $89.42 per hunter (14th most)
> Total paid hunting licenses issued in 2021: 253,650 (23rd least)
> Public lands as % of total state area: 16.0% (24th most)
37. Ohio
> Paid hunting licenses issued in 2021: 3.1 per 100 residents
> Avg. hunting license expense in 2021: $75.33 per hunter (21st most)
> Total paid hunting licenses issued in 2021: 360,421 (15th most)
> Public lands as % of total state area: 6.0% (8th least)
[in-text-ad-2]

36. Nevada
> Paid hunting licenses issued in 2021: 3.4 per 100 residents
> Avg. hunting license expense in 2021: $71.45 per hunter (23rd most)
> Total paid hunting licenses issued in 2021: 106,861 (10th least)
> Public lands as % of total state area: 83.2% (the most)
35. Texas
> Paid hunting licenses issued in 2021: 4.0 per 100 residents
> Avg. hunting license expense in 2021: $41.90 per hunter (10th least)
> Total paid hunting licenses issued in 2021: 1,170,316 (the most)
> Public lands as % of total state area: 4.1% (4th least)
[in-text-ad]
34. Indiana
> Paid hunting licenses issued in 2021: 4.0 per 100 residents
> Avg. hunting license expense in 2021: $46.17 per hunter (15th least)
> Total paid hunting licenses issued in 2021: 273,423 (24th most)
> Public lands as % of total state area: 4.7% (6th least)
[recirclink id=1195875]
33. South Carolina
> Paid hunting licenses issued in 2021: 4.2 per 100 residents
> Avg. hunting license expense in 2021: $46.38 per hunter (16th least)
> Total paid hunting licenses issued in 2021: 219,222 (20th least)
> Public lands as % of total state area: 9.4% (11th least)
32. New Hampshire
> Paid hunting licenses issued in 2021: 4.4 per 100 residents
> Avg. hunting license expense in 2021: $83.54 per hunter (17th most)
> Total paid hunting licenses issued in 2021: 60,629 (6th least)
> Public lands as % of total state area: 24.9% (15th most)
[in-text-ad-2]
31. Arizona
> Paid hunting licenses issued in 2021: 4.8 per 100 residents
> Avg. hunting license expense in 2021: $59.52 per hunter (22nd least)
> Total paid hunting licenses issued in 2021: 349,554 (16th most)
> Public lands as % of total state area: 55.1% (7th most)

30. North Carolina
> Paid hunting licenses issued in 2021: 6.2 per 100 residents
> Avg. hunting license expense in 2021: $20.12 per hunter (the least)
> Total paid hunting licenses issued in 2021: 654,251 (7th most)
> Public lands as % of total state area: 10.7% (16th least)
[in-text-ad]

29. Colorado
> Paid hunting licenses issued in 2021: 6.4 per 100 residents
> Avg. hunting license expense in 2021: $207.63 per hunter (2nd most)
> Total paid hunting licenses issued in 2021: 370,736 (14th most)
> Public lands as % of total state area: 44.7% (10th most)
[recirclink id=1215653]
28. Michigan
> Paid hunting licenses issued in 2021: 6.6 per 100 residents
> Avg. hunting license expense in 2021: $56.19 per hunter (21st least)
> Total paid hunting licenses issued in 2021: 660,933 (6th most)
> Public lands as % of total state area: 15.3% (24th least)
27. New Mexico
> Paid hunting licenses issued in 2021: 6.6 per 100 residents
> Avg. hunting license expense in 2021: $141.52 per hunter (5th most)
> Total paid hunting licenses issued in 2021: 140,685 (13th least)
> Public lands as % of total state area: 47.6% (9th most)
[in-text-ad-2]
26. Iowa
> Paid hunting licenses issued in 2021: 6.9 per 100 residents
> Avg. hunting license expense in 2021: $101.84 per hunter (9th most)
> Total paid hunting licenses issued in 2021: 220,576 (21st least)
> Public lands as % of total state area: 3.0% (3rd least)
25. Georgia
> Paid hunting licenses issued in 2021: 7.1 per 100 residents
> Avg. hunting license expense in 2021: $26.89 per hunter (4th least)
> Total paid hunting licenses issued in 2021: 769,105 (3rd most)
> Public lands as % of total state area: 9.9% (13th least)
[in-text-ad]

24. Kentucky
> Paid hunting licenses issued in 2021: 7.1 per 100 residents
> Avg. hunting license expense in 2021: $71.07 per hunter (25th most)
> Total paid hunting licenses issued in 2021: 321,347 (19th most)
> Public lands as % of total state area: 7.7% (10th least)
[recirclink id=1185572]

23. Pennsylvania
> Paid hunting licenses issued in 2021: 7.4 per 100 residents
> Avg. hunting license expense in 2021: $44.63 per hunter (13th least)
> Total paid hunting licenses issued in 2021: 953,903 (2nd most)
> Public lands as % of total state area: 18.7% (20th most)
22. Oregon
> Paid hunting licenses issued in 2021: 7.8 per 100 residents
> Avg. hunting license expense in 2021: $91.63 per hunter (12th most)
> Total paid hunting licenses issued in 2021: 331,475 (17th most)
> Public lands as % of total state area: 56.8% (4th most)
[in-text-ad-2]
21. Utah
> Paid hunting licenses issued in 2021: 8.0 per 100 residents
> Avg. hunting license expense in 2021: $78.87 per hunter (19th most)
> Total paid hunting licenses issued in 2021: 268,075 (25th most)
> Public lands as % of total state area: 72.0% (2nd most)
20. Missouri
> Paid hunting licenses issued in 2021: 8.3 per 100 residents
> Avg. hunting license expense in 2021: $51.33 per hunter (18th least)
> Total paid hunting licenses issued in 2021: 509,963 (10th most)
> Public lands as % of total state area: 7.6% (9th least)
[in-text-ad]
19. Kansas
> Paid hunting licenses issued in 2021: 8.7 per 100 residents
> Avg. hunting license expense in 2021: $93.39 per hunter (11th most)
> Total paid hunting licenses issued in 2021: 255,143 (25th least)
> Public lands as % of total state area: 1.9% (the least)
[recirclink id=1185572]
18. Nebraska
> Paid hunting licenses issued in 2021: 9.4 per 100 residents
> Avg. hunting license expense in 2021: $86.91 per hunter (15th most)
> Total paid hunting licenses issued in 2021: 185,034 (15th least)
> Public lands as % of total state area: 2.4% (2nd least)
17. Louisiana
> Paid hunting licenses issued in 2021: 9.6 per 100 residents
> Avg. hunting license expense in 2021: $22.13 per hunter (2nd least)
> Total paid hunting licenses issued in 2021: 442,678 (13th most)
> Public lands as % of total state area: 10.1% (14th least)
[in-text-ad-2]
16. Mississippi
> Paid hunting licenses issued in 2021: 9.6 per 100 residents
> Avg. hunting license expense in 2021: $49.13 per hunter (17th least)
> Total paid hunting licenses issued in 2021: 283,021 (22nd most)
> Public lands as % of total state area: 9.8% (12th least)
15. Minnesota
> Paid hunting licenses issued in 2021: 9.6 per 100 residents
> Avg. hunting license expense in 2021: $61.86 per hunter (23rd least)
> Total paid hunting licenses issued in 2021: 550,663 (9th most)
> Public lands as % of total state area: 18.9% (19th most)
[in-text-ad]
14. Vermont
> Paid hunting licenses issued in 2021: 10.0 per 100 residents
> Avg. hunting license expense in 2021: $71.53 per hunter (22nd most)
> Total paid hunting licenses issued in 2021: 64,343 (7th least)
> Public lands as % of total state area: 16.5% (23rd most)
[recirclink id=1215966]
13. Alabama
> Paid hunting licenses issued in 2021: 10.0 per 100 residents
> Avg. hunting license expense in 2021: $45.46 per hunter (14th least)
> Total paid hunting licenses issued in 2021: 504,600 (11th most)
> Public lands as % of total state area: 5.9% (7th least)
12. Tennessee
> Paid hunting licenses issued in 2021: 10.4 per 100 residents
> Avg. hunting license expense in 2021: $39.06 per hunter (7th least)
> Total paid hunting licenses issued in 2021: 728,759 (4th most)
> Public lands as % of total state area: 10.2% (15th least)
[in-text-ad-2]
11. Arkansas
> Paid hunting licenses issued in 2021: 10.7 per 100 residents
> Avg. hunting license expense in 2021: $61.95 per hunter (24th least)
> Total paid hunting licenses issued in 2021: 323,474 (18th most)
> Public lands as % of total state area: 13.6% (20th least)
10. Wisconsin
> Paid hunting licenses issued in 2021: 11.4 per 100 residents
> Avg. hunting license expense in 2021: $53.51 per hunter (19th least)
> Total paid hunting licenses issued in 2021: 669,813 (5th most)
> Public lands as % of total state area: 14.7% (23rd least)
[in-text-ad]
9. Oklahoma
> Paid hunting licenses issued in 2021: 12.5 per 100 residents
> Avg. hunting license expense in 2021: $26.30 per hunter (3rd least)
> Total paid hunting licenses issued in 2021: 499,182 (12th most)
> Public lands as % of total state area: 11.7% (18th least)
[recirclink id=1195875]

8. Alaska
> Paid hunting licenses issued in 2021: 13.4 per 100 residents
> Avg. hunting license expense in 2021: $77.73 per hunter (20th most)
> Total paid hunting licenses issued in 2021: 98,202 (9th least)
> Public lands as % of total state area: 56.2% (5th most)

7. West Virginia
> Paid hunting licenses issued in 2021: 14.2 per 100 residents
> Avg. hunting license expense in 2021: $35.18 per hunter (5th least)
> Total paid hunting licenses issued in 2021: 253,955 (24th least)
> Public lands as % of total state area: 12.1% (19th least)
[in-text-ad-2]
6. Maine
> Paid hunting licenses issued in 2021: 15.1 per 100 residents
> Avg. hunting license expense in 2021: $39.41 per hunter (8th least)
> Total paid hunting licenses issued in 2021: 207,849 (18th least)
> Public lands as % of total state area: 18.1% (21st most)

5. Idaho
> Paid hunting licenses issued in 2021: 15.9 per 100 residents
> Avg. hunting license expense in 2021: $142.14 per hunter (4th most)
> Total paid hunting licenses issued in 2021: 301,994 (20th most)
> Public lands as % of total state area: 68.0% (3rd most)
[in-text-ad]

4. North Dakota
> Paid hunting licenses issued in 2021: 19.4 per 100 residents
> Avg. hunting license expense in 2021: $81.97 per hunter (18th most)
> Total paid hunting licenses issued in 2021: 150,724 (14th least)
> Public lands as % of total state area: 21.6% (17th most)
[recirclink id=1215653]

3. Montana
> Paid hunting licenses issued in 2021: 20.9 per 100 residents
> Avg. hunting license expense in 2021: $166.57 per hunter (3rd most)
> Total paid hunting licenses issued in 2021: 231,339 (22nd least)
> Public lands as % of total state area: 37.6% (13th most)
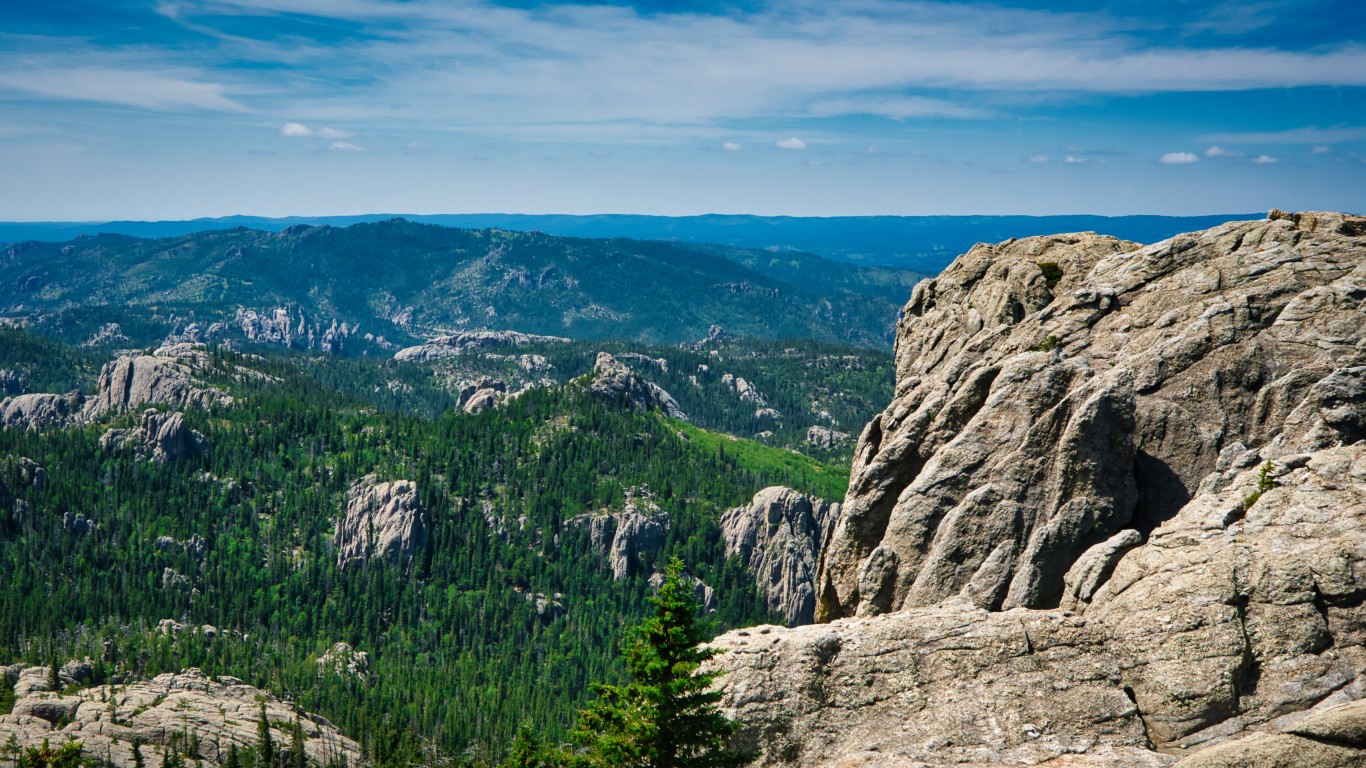
2. South Dakota
> Paid hunting licenses issued in 2021: 23.0 per 100 residents
> Avg. hunting license expense in 2021: $101.08 per hunter (10th most)
> Total paid hunting licenses issued in 2021: 206,316 (17th least)
> Public lands as % of total state area: 16.9% (22nd most)
[in-text-ad-2]
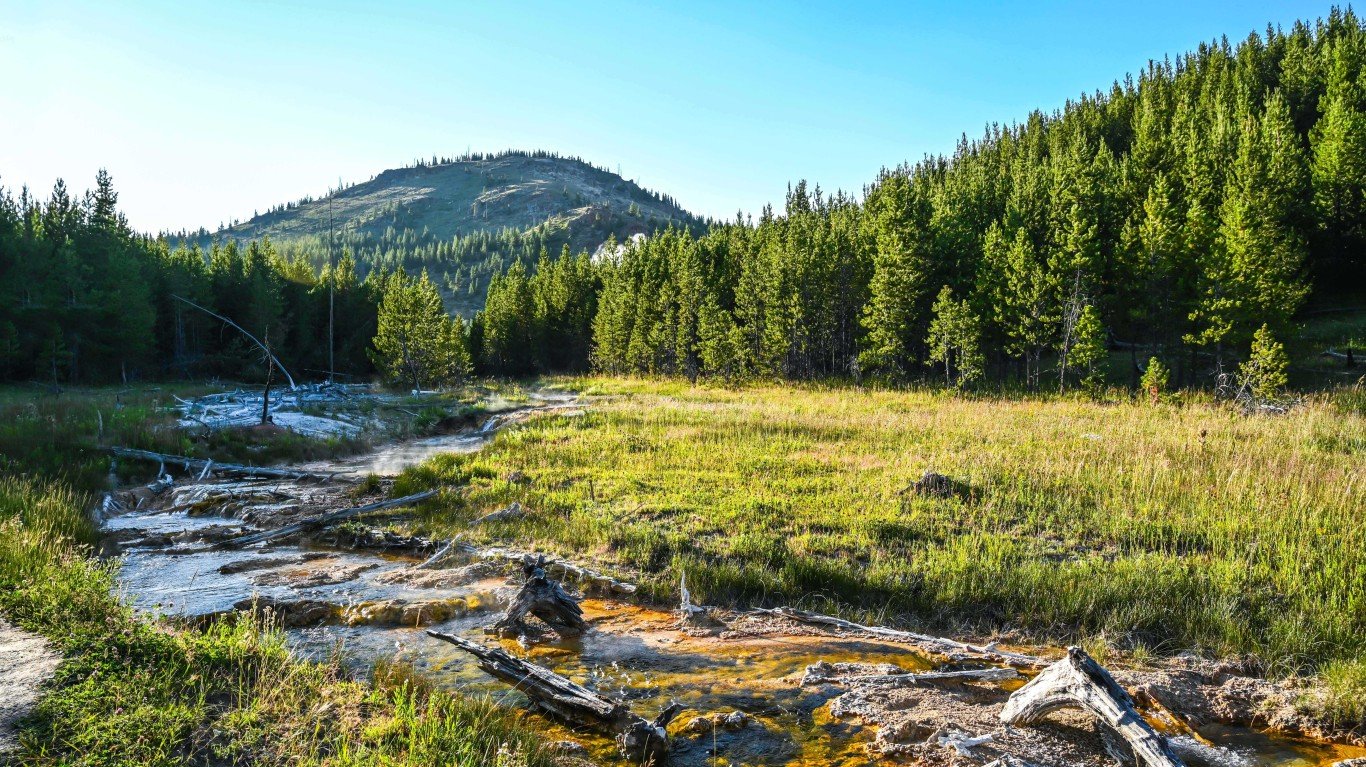
1. Wyoming
> Paid hunting licenses issued in 2021: 23.5 per 100 residents
> Avg. hunting license expense in 2021: $258.66 per hunter (the most)
> Total paid hunting licenses issued in 2021: 136,205 (12th least)
> Public lands as % of total state area: 54.2% (8th most)
Methodology
To determine the states with the most hunters, 24/7 Wall St. reviewed data on hunting license apportionments from the U.S. Fish and Wildlife Service. States were ranked based on the number of paid hunting licenses issued within in 2021 per 100 residents.
Population data used to adjust hunting license apportionments per capita came from the U.S. Census Bureau’s 2021 American Community Survey and are one-year estimates. Data on the gross cost of paid hunting licenses issued in 2021 used to calculate average license cost per hunter also came from the USFWS. Data on the percentage of a state that is operated as public land came from the Protected Areas Database program of the U.S. Geological Survey.
Contact [email protected] for any questions or corrections.