Participation in outdoor recreation surged during the COVID-19 pandemic as Americans sought safe ways to spend their free time. For certain government-regulated outdoor sports, particularly fishing, renewed public interest was a boon for state coffers. Wildlife and environmental agencies at the state level reported a cumulative total of $903.8 million in fishing license sales in 2021, up from $751.4 million in 2019, the year before the pandemic.
The 20% increase in license sale revenue came as interest in the sport hit all-time high. According to the U.S. Fish and Wildlife Service, there were 32.2 million paid fishing license holders in the U.S. in 2021, more than in any other year going back to the mid-1960s, when record keeping began.
Adjusting for population, there are about 10 licensed anglers for every 100 people in the United States. Participation rates vary by state, however, and in some parts of the country, fishing is a far more popular pastime than in others.
Using 2021 data on paid fishing license holders from the FWS, 24/7 Wall St. identified the states where the most people fish. States are ranked by the number of paid fishing license holders for every 100 people, calculated using population data from the U.S. Census Bureau’s 2021 American Community Survey. Average fishing license cost by state was calculated using FWS data on total fishing license expenditures and fishing license holders.
Among the 50 states, the number of paid fishing license holders ranges from about 4,400 to more than 2 million. Adjusting for population, the concentration of license holders is less than 5 for every 100 people in some states, and more than 40 per 100 in others.
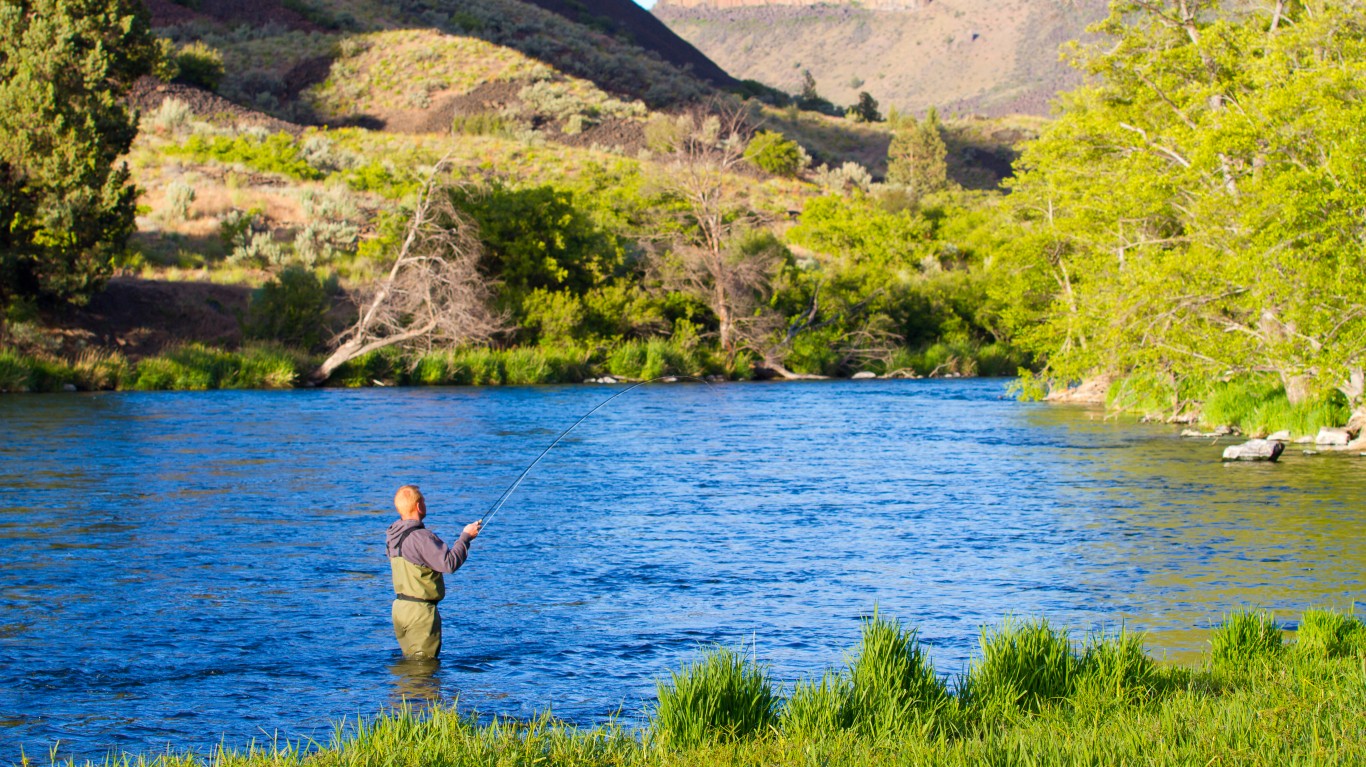
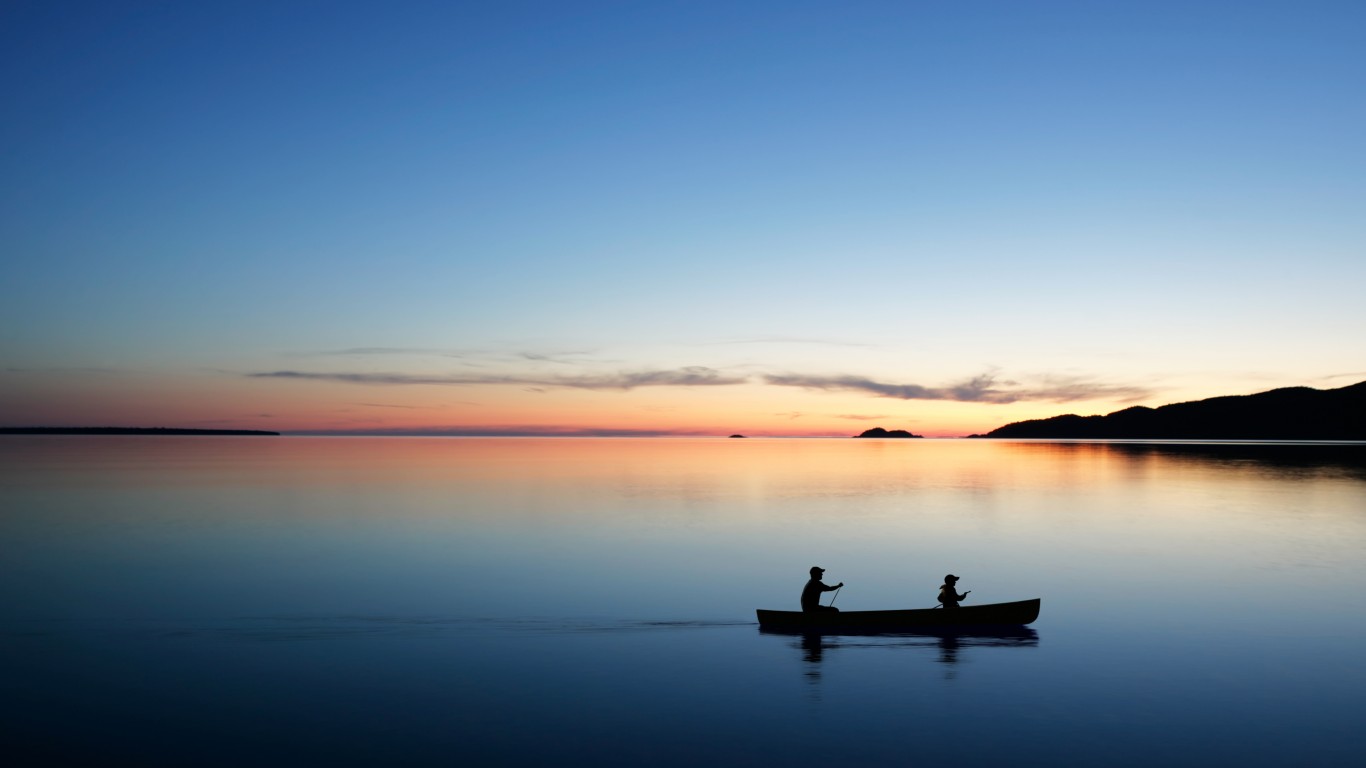
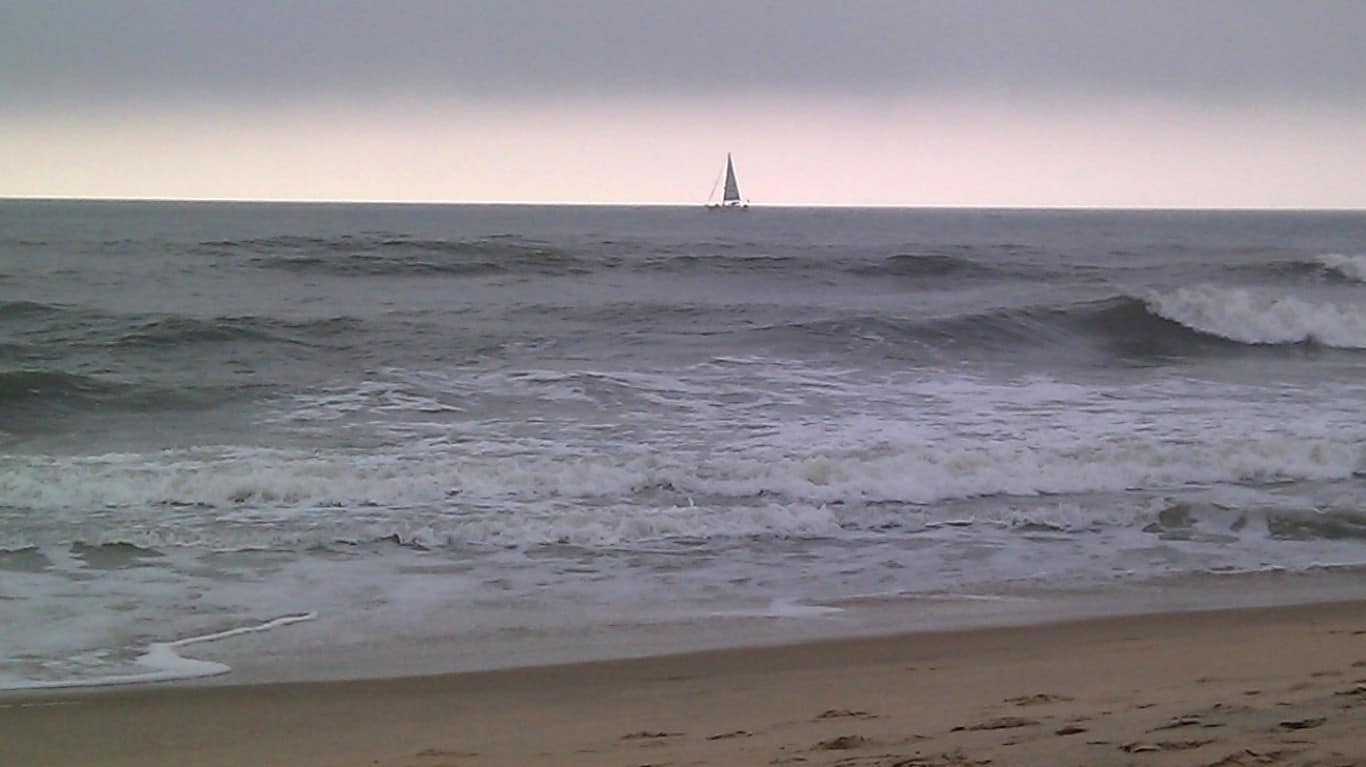
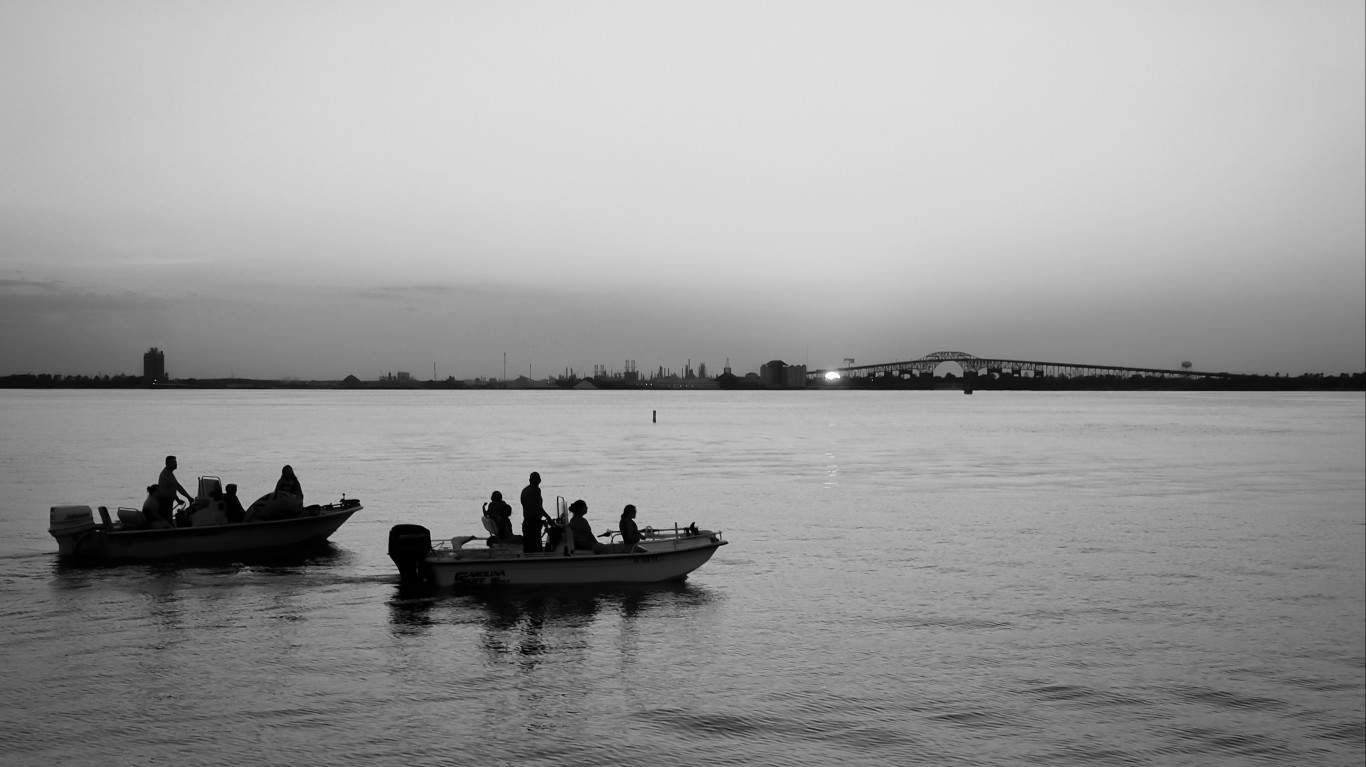
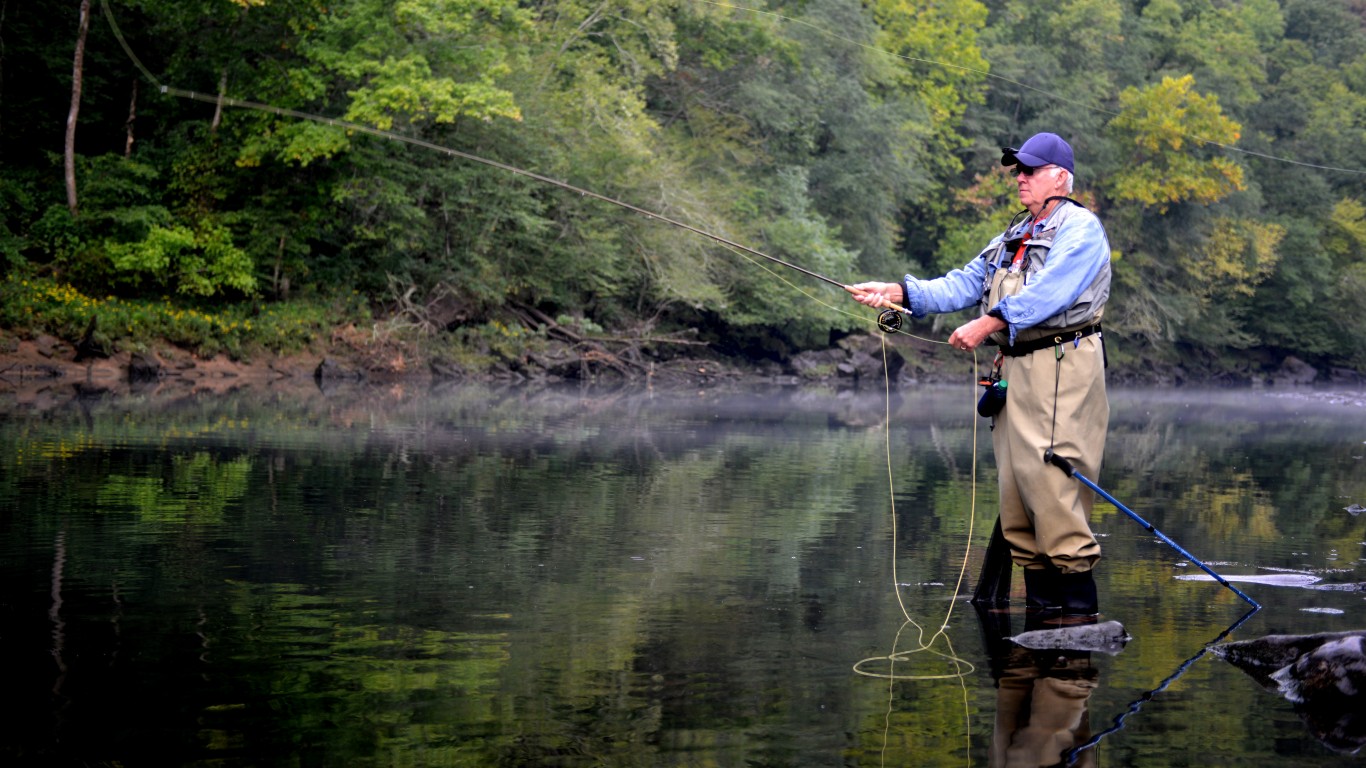
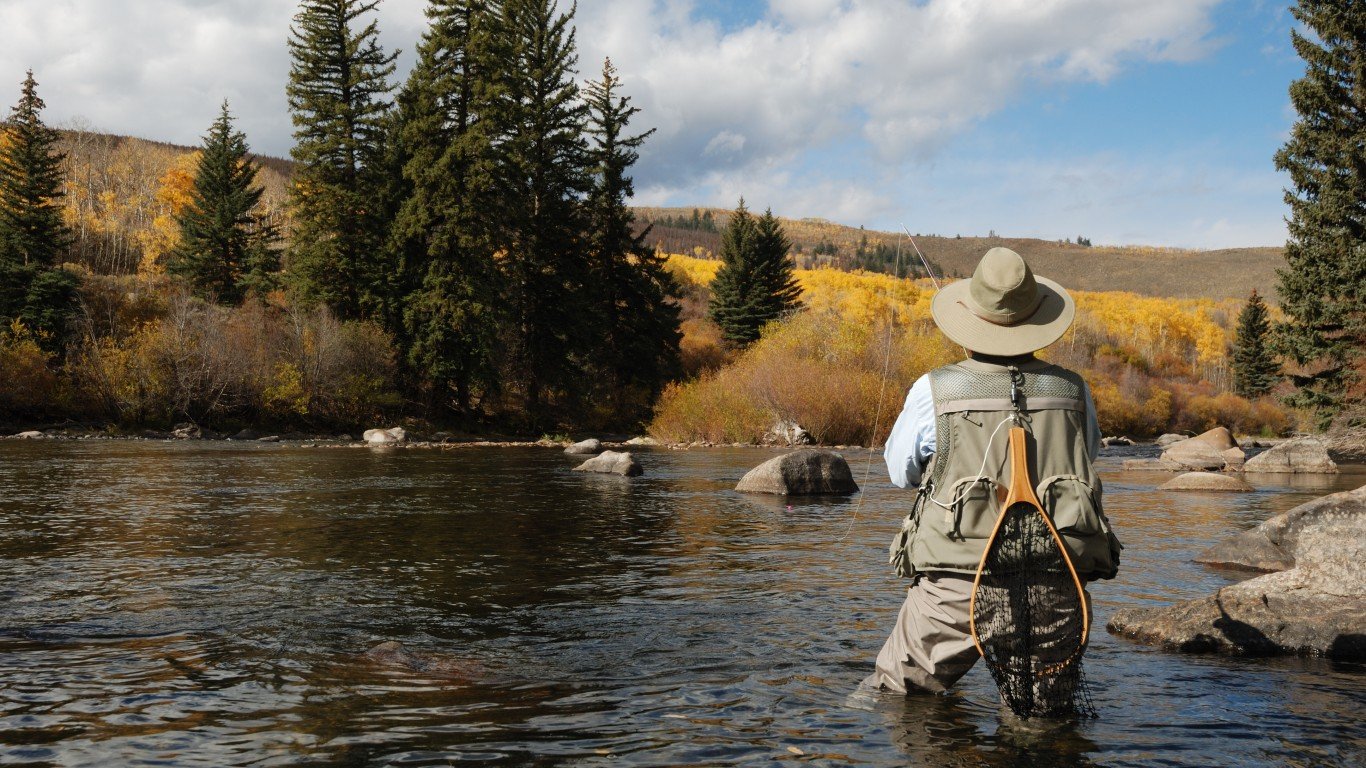
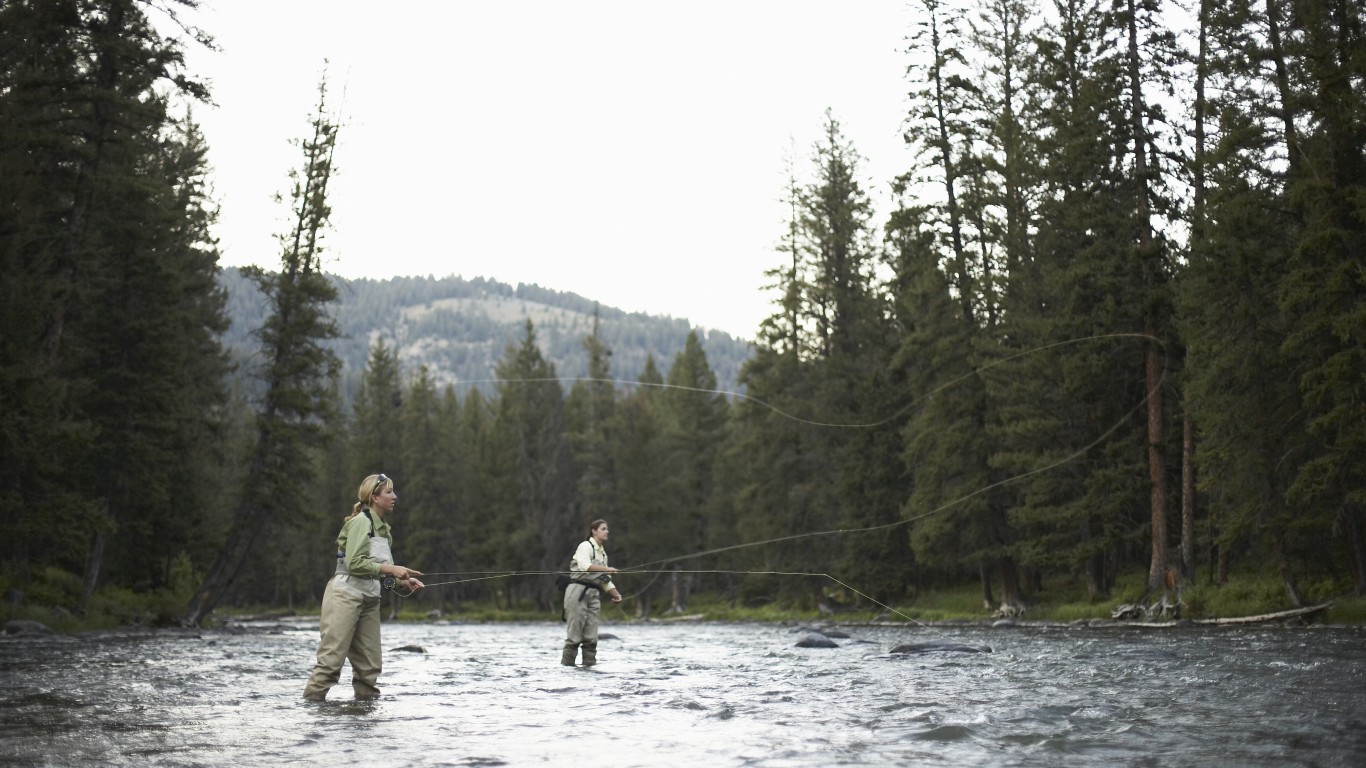
There are many different styles of fishing, and not all of them require access to large bodies of water. While trolling — a method that involves dragging a baited line through the water from a moving boat — is often done in a lake or at sea, fly fishing is typically done by anglers standing in or beside a river or stream. (Here is a look at the largest fish ever caught in the U.S.)
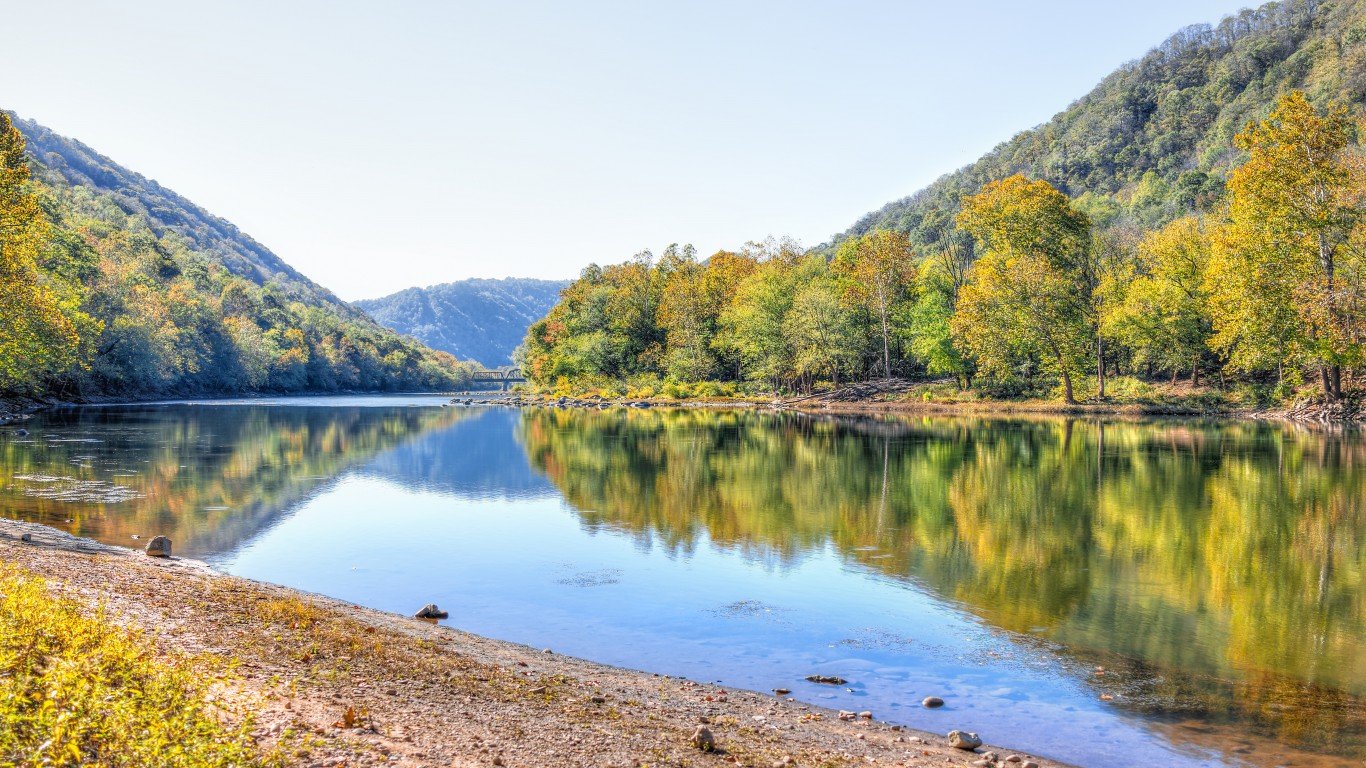
Perhaps counterintuitively, many of the states where fishing is most popular have no coastline, and a relatively small portion of their total surface area covered by water, according to the U.S. Geological Survey. Meanwhile, according to the National Oceanic and Atmospheric Administration, each of the five lowest ranking states on this list has at least 1,000 miles of coastline along either oceans or Great Lakes.
It is important to note that fishing regulations vary at the state and local level, and in some states, such as Hawaii, fishing does not necessarily require a license. As a result, the number of paid license holders in a given state can be a reflection of both the regulatory environment and public interest in the sport.
50. Hawaii

- Paid fishing licenses issued in 2021: 0.3 per 100 residents
- Total paid fishing licenses issues in 2021: 4,386 (the fewest of 50 states)
- Avg. fishing license expense in 2021: $5.49 per license holder (the lowest of 50 states)
- State surface area covered by water: 4,509 square miles (41.2% of surface area — 2nd highest of 50 states)
- Shoreline (incl. Great Lakes): 1,052 miles
49. New Jersey
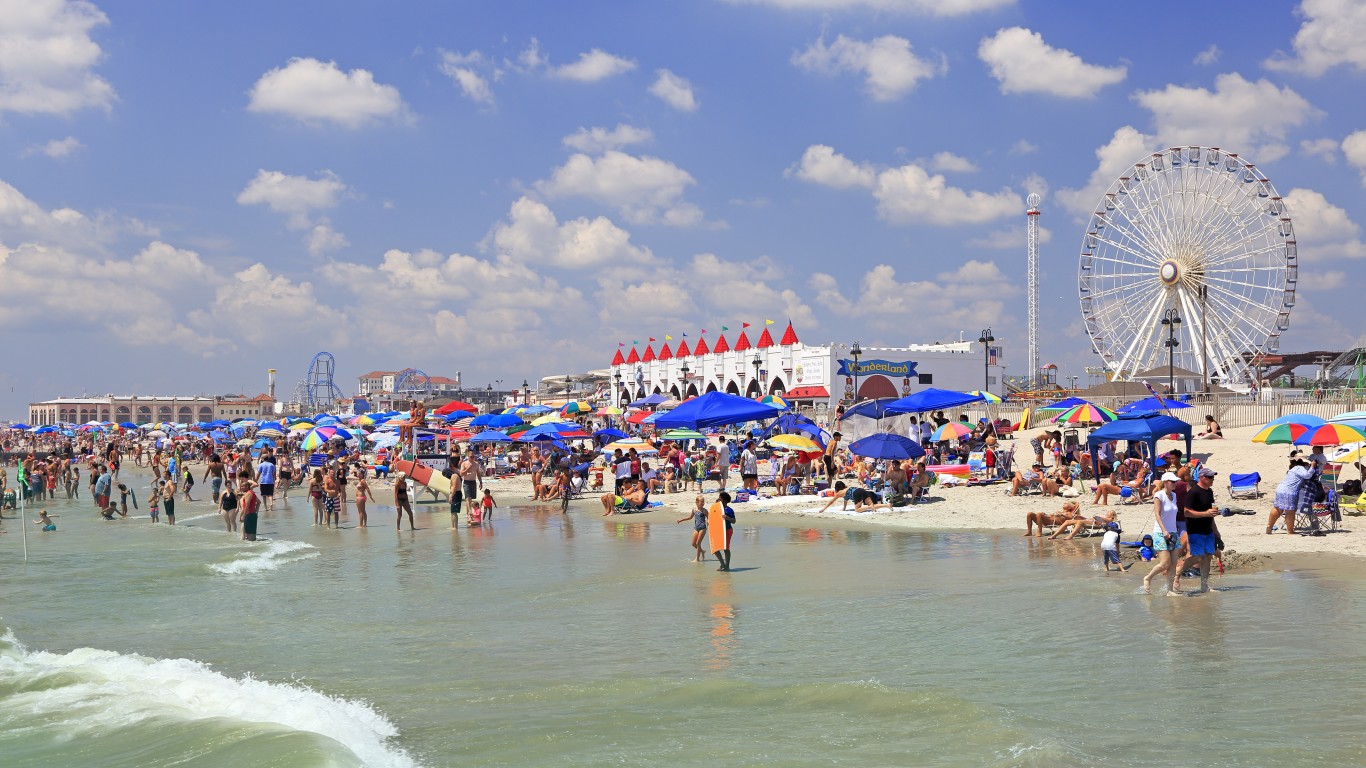
- Paid fishing licenses issued in 2021: 2.1 per 100 residents
- Total paid fishing licenses issues in 2021: 193,618 (8th fewest of 50 states)
- Avg. fishing license expense in 2021: $29.91 per license holder (21st highest of 50 states)
- State surface area covered by water: 1,368 square miles (15.7% of surface area — 10th highest of 50 states)
- Shoreline (incl. Great Lakes): 1,792 miles
48. Massachusetts
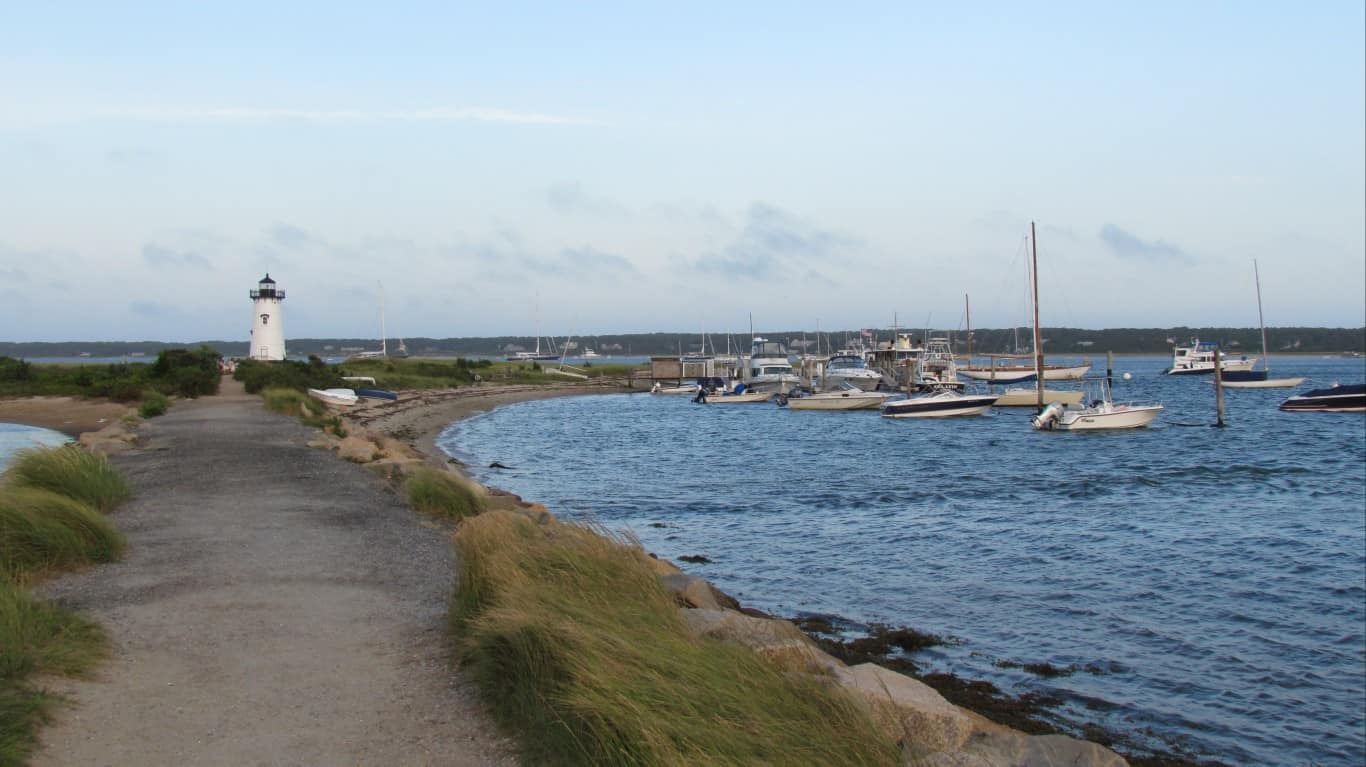
- Paid fishing licenses issued in 2021: 4.0 per 100 residents
- Total paid fishing licenses issues in 2021: 281,707 (14th fewest of 50 states)
- Avg. fishing license expense in 2021: $22.14 per license holder (17th lowest of 50 states)
- State surface area covered by water: 2,754 square miles (26.1% of surface area — 4th highest of 50 states)
- Shoreline (incl. Great Lakes): 1,519 miles
47. California
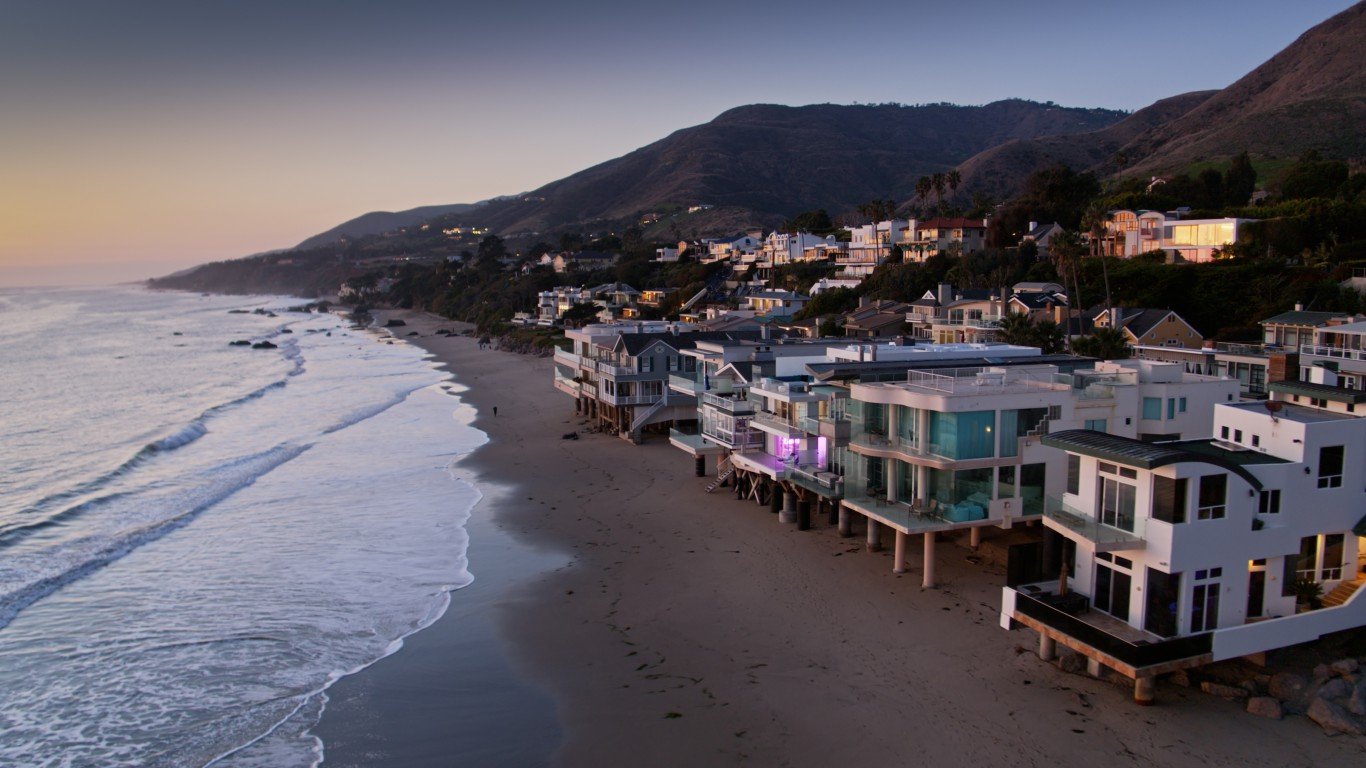
- Paid fishing licenses issued in 2021: 4.5 per 100 residents
- Total paid fishing licenses issues in 2021: 1,757,685 (2nd most of 50 states)
- Avg. fishing license expense in 2021: $44.12 per license holder (6th highest of 50 states)
- State surface area covered by water: 7,916 square miles (4.8% of surface area — 21st highest of 50 states)
- Shoreline (incl. Great Lakes): 3,427 miles
46. New York
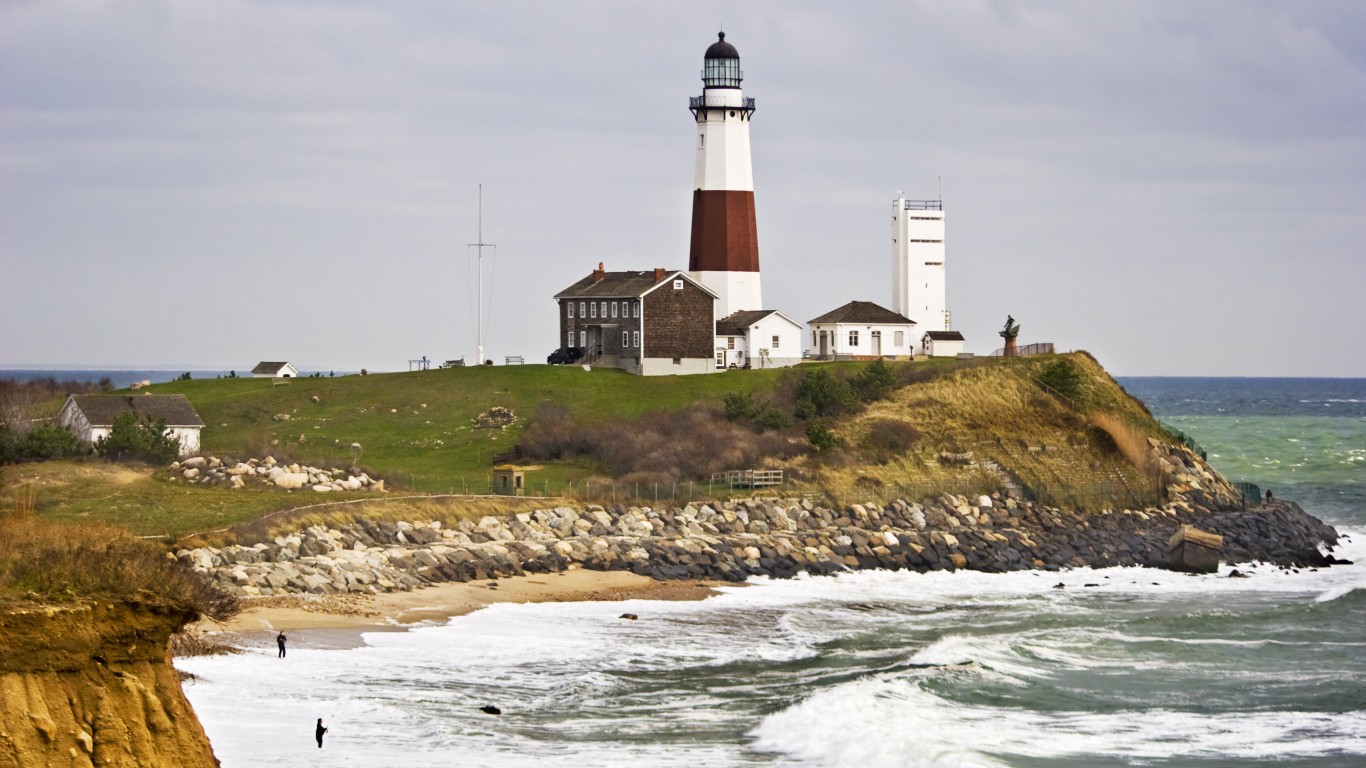
- Paid fishing licenses issued in 2021: 4.6 per 100 residents
- Total paid fishing licenses issues in 2021: 911,677 (12th most of 50 states)
- Avg. fishing license expense in 2021: $25.04 per license holder (21st lowest of 50 states)
- State surface area covered by water: 7,429 square miles (13.6% of surface area — 12th highest of 50 states)
- Shoreline (incl. Great Lakes): 2,625 miles
45. Connecticut
- Paid fishing licenses issued in 2021: 4.7 per 100 residents
- Total paid fishing licenses issues in 2021: 169,484 (5th fewest of 50 states)
- Avg. fishing license expense in 2021: $30.07 per license holder (20th highest of 50 states)
- State surface area covered by water: 701 square miles (12.6% of surface area — 14th highest of 50 states)
- Shoreline (incl. Great Lakes): 618 miles
44. Maryland
- Paid fishing licenses issued in 2021: 5.2 per 100 residents
- Total paid fishing licenses issues in 2021: 322,170 (18th fewest of 50 states)
- Avg. fishing license expense in 2021: $28.56 per license holder (23rd highest of 50 states)
- State surface area covered by water: 2,699 square miles (21.8% of surface area — 5th highest of 50 states)
- Shoreline (incl. Great Lakes): 3,190 miles
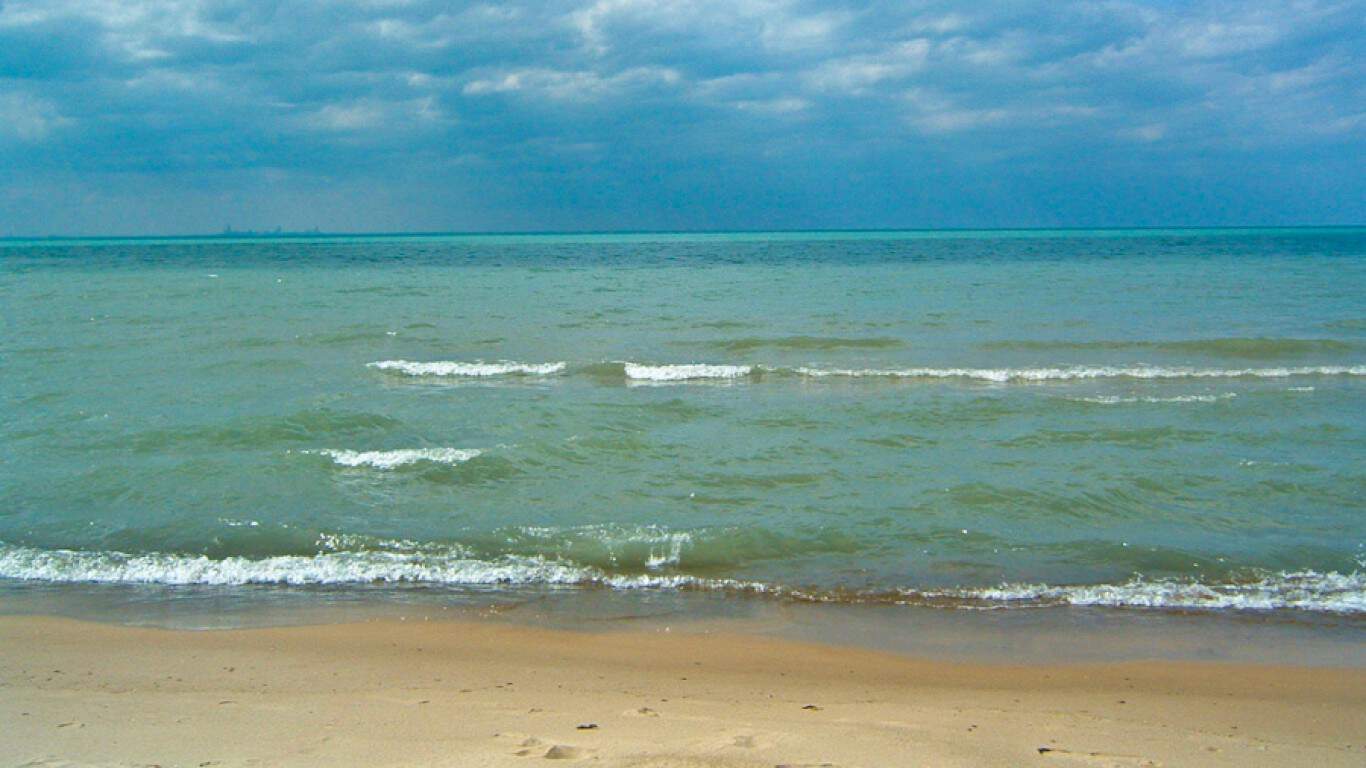
43. Illinois
- Paid fishing licenses issued in 2021: 5.5 per 100 residents
- Total paid fishing licenses issues in 2021: 701,088 (18th most of 50 states)
- Avg. fishing license expense in 2021: $13.49 per license holder (3rd lowest of 50 states)
- State surface area covered by water: 2,395 square miles (4.1% of surface area — 24th highest of 50 states)
- Shoreline (incl. Great Lakes): 63 miles
42. Nevada
- Paid fishing licenses issued in 2021: 5.8 per 100 residents
- Total paid fishing licenses issues in 2021: 183,839 (6th fewest of 50 states)
- Avg. fishing license expense in 2021: $32.83 per license holder (13th highest of 50 states)
- State surface area covered by water: 791 square miles (0.7% of surface area — 6th lowest of 50 states)
- Shoreline (incl. Great Lakes): None
41. Rhode Island

- Paid fishing licenses issued in 2021: 6.2 per 100 residents
- Total paid fishing licenses issues in 2021: 68,406 (2nd fewest of 50 states)
- Avg. fishing license expense in 2021: $15.01 per license holder (7th lowest of 50 states)
- State surface area covered by water: 511 square miles (33.1% of surface area — 3rd highest of 50 states)
- Shoreline (incl. Great Lakes): 384 miles
40. Virginia
- Paid fishing licenses issued in 2021: 6.9 per 100 residents
- Total paid fishing licenses issues in 2021: 595,755 (24th most of 50 states)
- Avg. fishing license expense in 2021: $47.62 per license holder (4th highest of 50 states)
- State surface area covered by water: 3,285 square miles (7.7% of surface area — 18th highest of 50 states)
- Shoreline (incl. Great Lakes): 3,315 miles
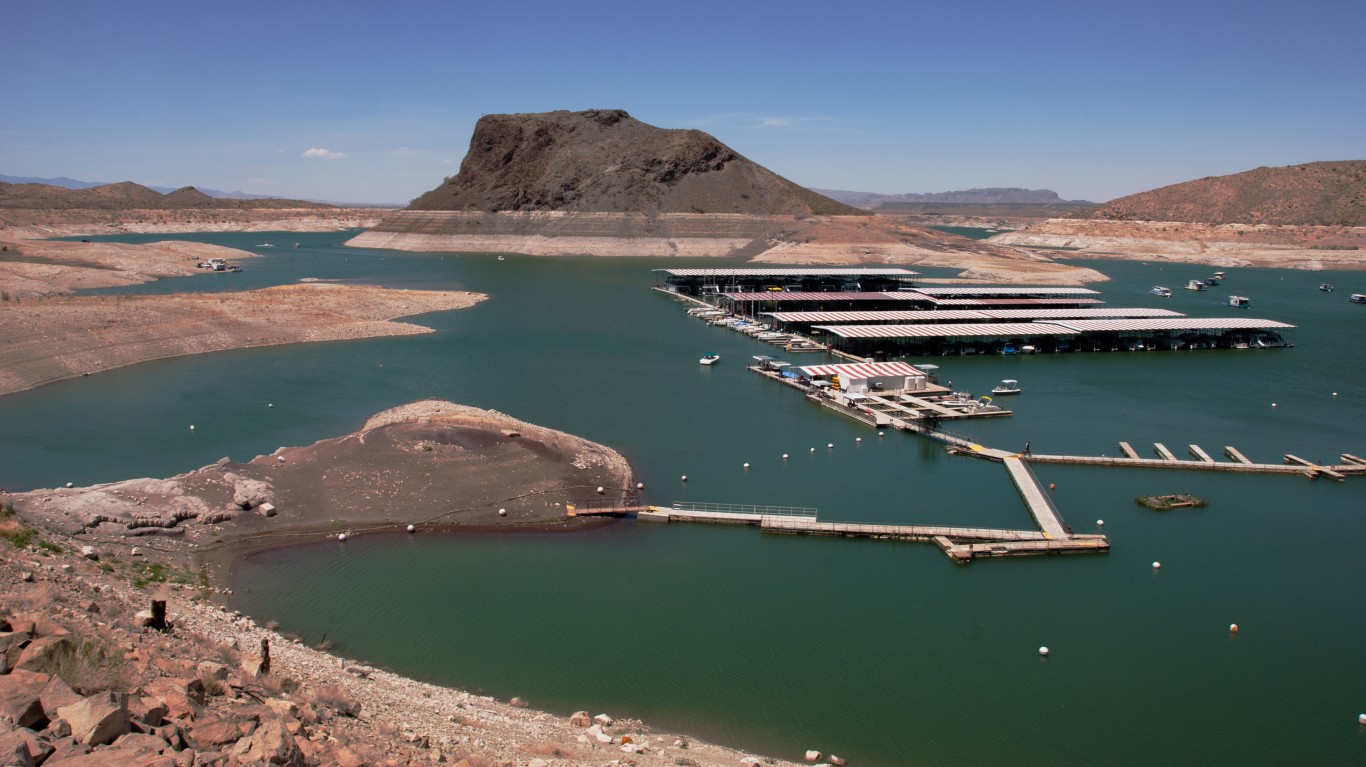
39. Arizona
- Paid fishing licenses issued in 2021: 7.1 per 100 residents
- Total paid fishing licenses issues in 2021: 515,539 (23rd fewest of 50 states)
- Avg. fishing license expense in 2021: $31.23 per license holder (16th highest of 50 states)
- State surface area covered by water: 396 square miles (0.3% of surface area — 2nd lowest of 50 states)
- Shoreline (incl. Great Lakes): None
38. Texas
- Paid fishing licenses issued in 2021: 7.1 per 100 residents
- Total paid fishing licenses issues in 2021: 2,099,153 (the most of 50 states)
- Avg. fishing license expense in 2021: $33.26 per license holder (11th highest of 50 states)
- State surface area covered by water: 7,365 square miles (2.7% of surface area — 21st lowest of 50 states)
- Shoreline (incl. Great Lakes): 3,359 miles
37. Ohio
- Paid fishing licenses issued in 2021: 7.7 per 100 residents
- Total paid fishing licenses issues in 2021: 909,854 (13th most of 50 states)
- Avg. fishing license expense in 2021: $25.93 per license holder (23rd lowest of 50 states)
- State surface area covered by water: 3,965 square miles (8.8% of surface area — 16th highest of 50 states)
- Shoreline (incl. Great Lakes): 312 miles
36. Florida
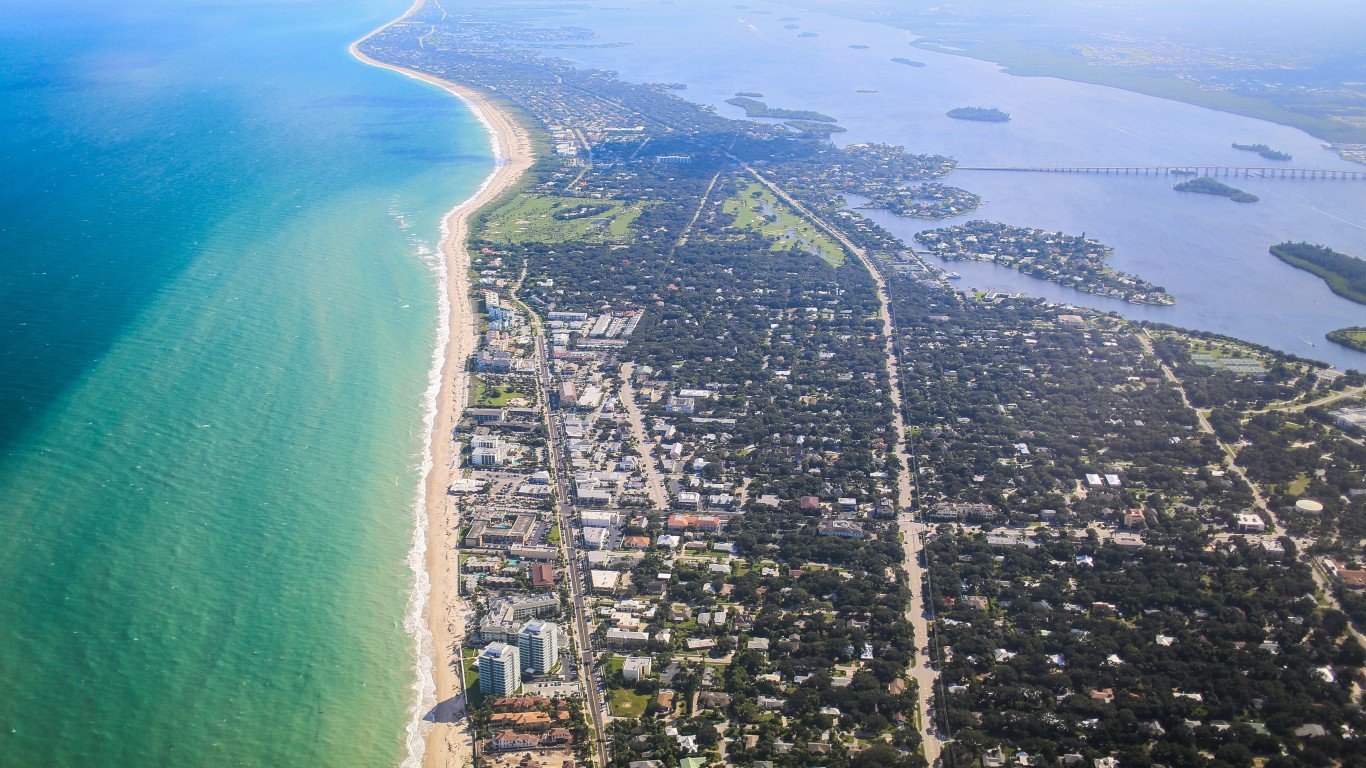
- Paid fishing licenses issued in 2021: 8.0 per 100 residents
- Total paid fishing licenses issues in 2021: 1,743,139 (3rd most of 50 states)
- Avg. fishing license expense in 2021: $26.93 per license holder (25th lowest of 50 states)
- State surface area covered by water: 12,133 square miles (18.5% of surface area — 7th highest of 50 states)
- Shoreline (incl. Great Lakes): 8,436 miles
35. Pennsylvania

- Paid fishing licenses issued in 2021: 8.8 per 100 residents
- Total paid fishing licenses issues in 2021: 1,146,972 (8th most of 50 states)
- Avg. fishing license expense in 2021: $27.30 per license holder (25th highest of 50 states)
- State surface area covered by water: 1,312 square miles (2.8% of surface area — 22nd lowest of 50 states)
- Shoreline (incl. Great Lakes): 140 miles
34. Indiana
- Paid fishing licenses issued in 2021: 8.9 per 100 residents
- Total paid fishing licenses issues in 2021: 607,365 (21st most of 50 states)
- Avg. fishing license expense in 2021: $14.52 per license holder (4th lowest of 50 states)
- State surface area covered by water: 593 square miles (1.6% of surface area — 13th lowest of 50 states)
- Shoreline (incl. Great Lakes): 45 miles
33. Delaware
- Paid fishing licenses issued in 2021: 9.2 per 100 residents
- Total paid fishing licenses issues in 2021: 92,120 (3rd fewest of 50 states)
- Avg. fishing license expense in 2021: $17.49 per license holder (9th lowest of 50 states)
- State surface area covered by water: 540 square miles (21.7% of surface area — 6th highest of 50 states)
- Shoreline (incl. Great Lakes): 381 miles
32. Georgia
- Paid fishing licenses issued in 2021: 10.0 per 100 residents
- Total paid fishing licenses issues in 2021: 1,083,120 (9th most of 50 states)
- Avg. fishing license expense in 2021: $14.77 per license holder (6th lowest of 50 states)
- State surface area covered by water: 1,912 square miles (3.2% of surface area — 25th lowest of 50 states)
- Shoreline (incl. Great Lakes): 2,344 miles
31. Washington
- Paid fishing licenses issued in 2021: 10.2 per 100 residents
- Total paid fishing licenses issues in 2021: 789,966 (14th most of 50 states)
- Avg. fishing license expense in 2021: $52.20 per license holder (2nd highest of 50 states)
- State surface area covered by water: 4,842 square miles (6.8% of surface area — 19th highest of 50 states)
- Shoreline (incl. Great Lakes): 3,026 miles
30. Kansas

- Paid fishing licenses issued in 2021: 10.9 per 100 residents
- Total paid fishing licenses issues in 2021: 318,632 (17th fewest of 50 states)
- Avg. fishing license expense in 2021: $23.86 per license holder (18th lowest of 50 states)
- State surface area covered by water: 520 square miles (0.6% of surface area — 4th lowest of 50 states)
- Shoreline (incl. Great Lakes): None
29. Mississippi
- Paid fishing licenses issued in 2021: 11.0 per 100 residents
- Total paid fishing licenses issues in 2021: 325,350 (19th fewest of 50 states)
- Avg. fishing license expense in 2021: $19.59 per license holder (15th lowest of 50 states)
- State surface area covered by water: 1,509 square miles (3.1% of surface area — 23rd lowest of 50 states)
- Shoreline (incl. Great Lakes): 359 miles
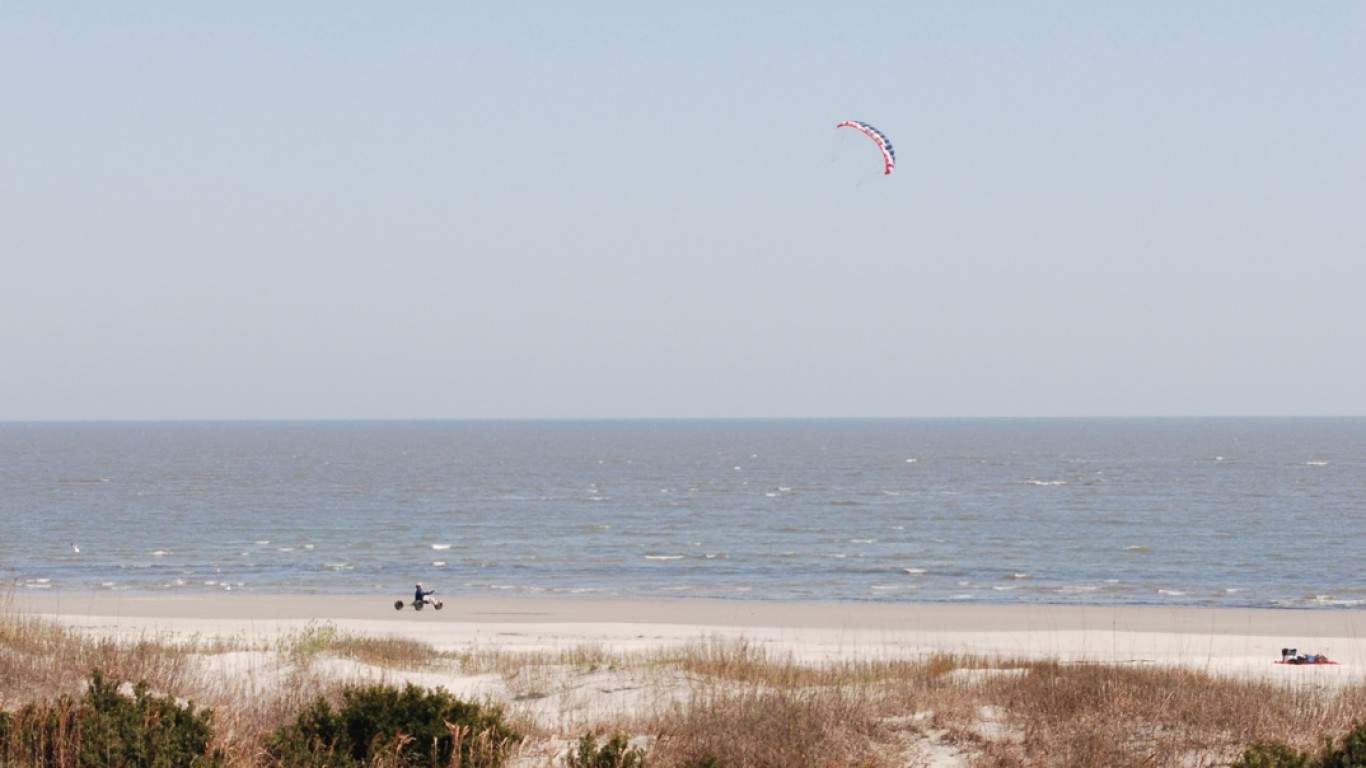
28. South Carolina
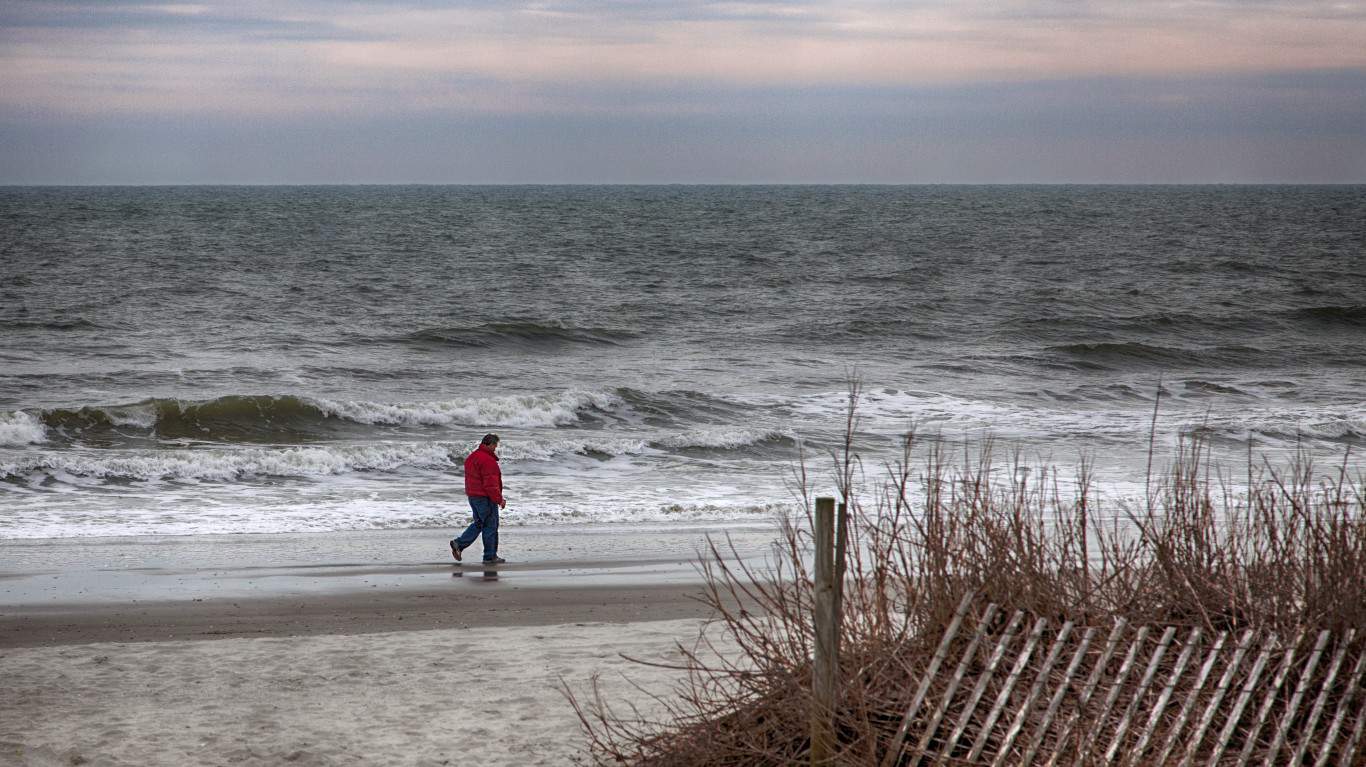
- Paid fishing licenses issued in 2021: 11.6 per 100 residents
- Total paid fishing licenses issues in 2021: 603,247 (23rd most of 50 states)
- Avg. fishing license expense in 2021: $12.64 per license holder (2nd lowest of 50 states)
- State surface area covered by water: 1,960 square miles (6.1% of surface area — 20th highest of 50 states)
- Shoreline (incl. Great Lakes): 2,876 miles
27. Michigan
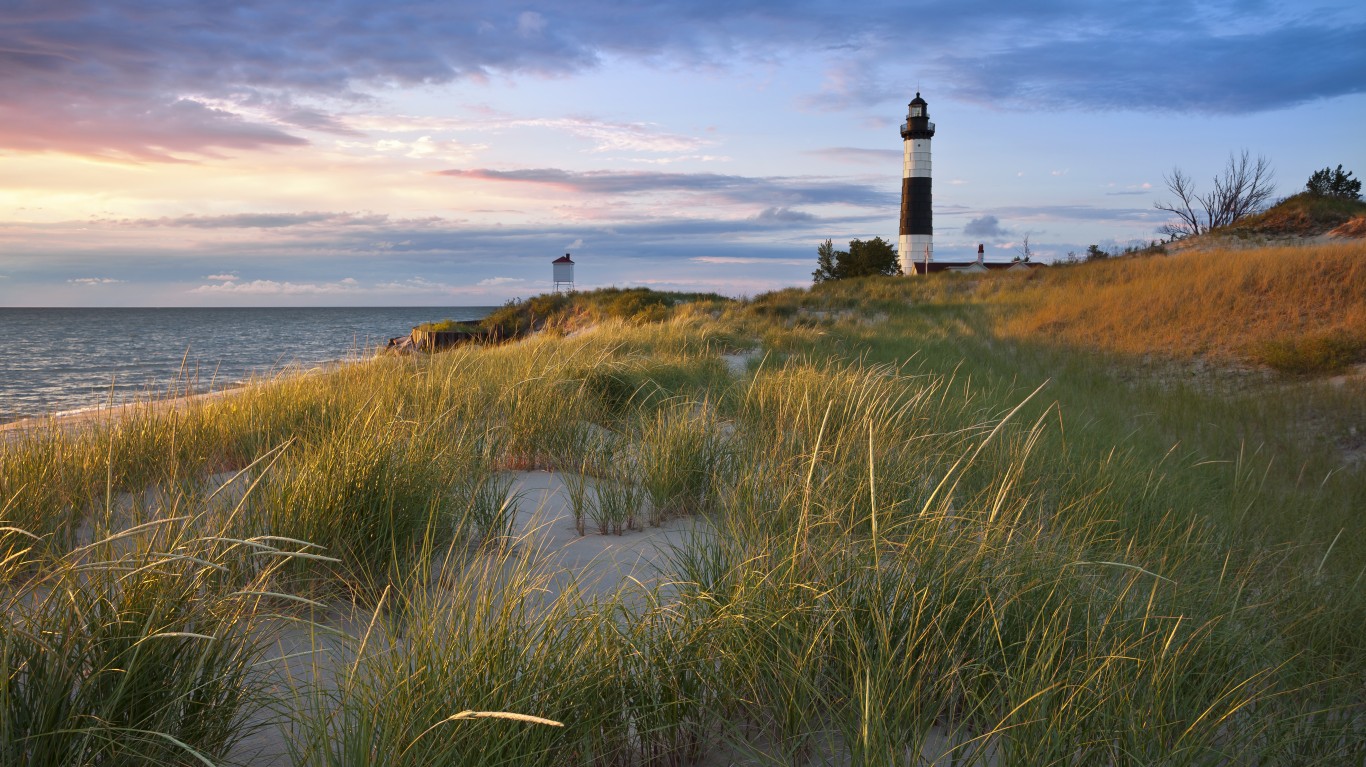
- Paid fishing licenses issued in 2021: 11.8 per 100 residents
- Total paid fishing licenses issues in 2021: 1,190,933 (7th most of 50 states)
- Avg. fishing license expense in 2021: $25.72 per license holder (22nd lowest of 50 states)
- State surface area covered by water: 40,175 square miles (41.5% of surface area — the highest of 50 states)
- Shoreline (incl. Great Lakes): 3,224 miles
26. New Mexico
- Paid fishing licenses issued in 2021: 11.9 per 100 residents
- Total paid fishing licenses issues in 2021: 250,954 (11th fewest of 50 states)
- Avg. fishing license expense in 2021: $31.86 per license holder (14th highest of 50 states)
- State surface area covered by water: 292 square miles (0.2% of surface area — the lowest of 50 states)
- Shoreline (incl. Great Lakes): None
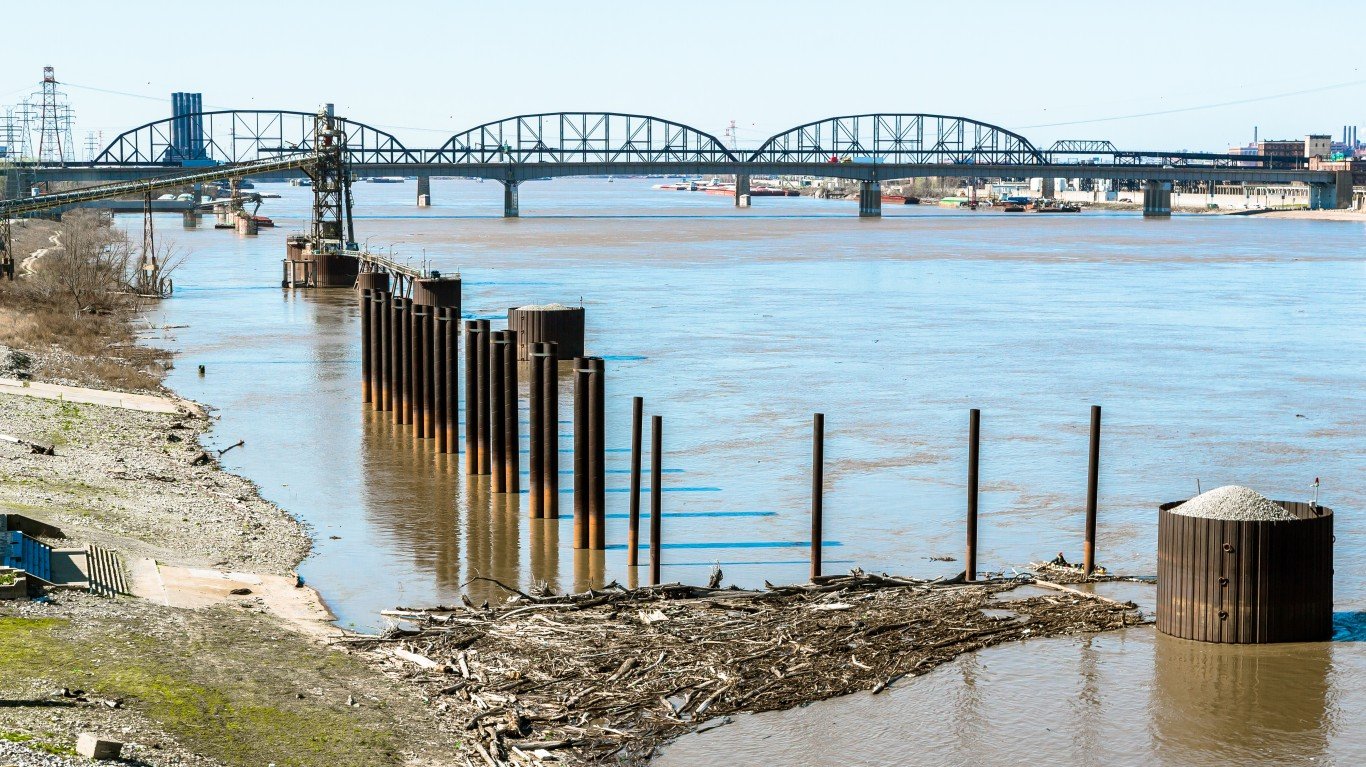
25. Missouri

- Paid fishing licenses issued in 2021: 12.1 per 100 residents
- Total paid fishing licenses issues in 2021: 746,389 (17th most of 50 states)
- Avg. fishing license expense in 2021: $18.41 per license holder (10th lowest of 50 states)
- State surface area covered by water: 965 square miles (1.4% of surface area — 12th lowest of 50 states)
- Shoreline (incl. Great Lakes): None
24. Alabama
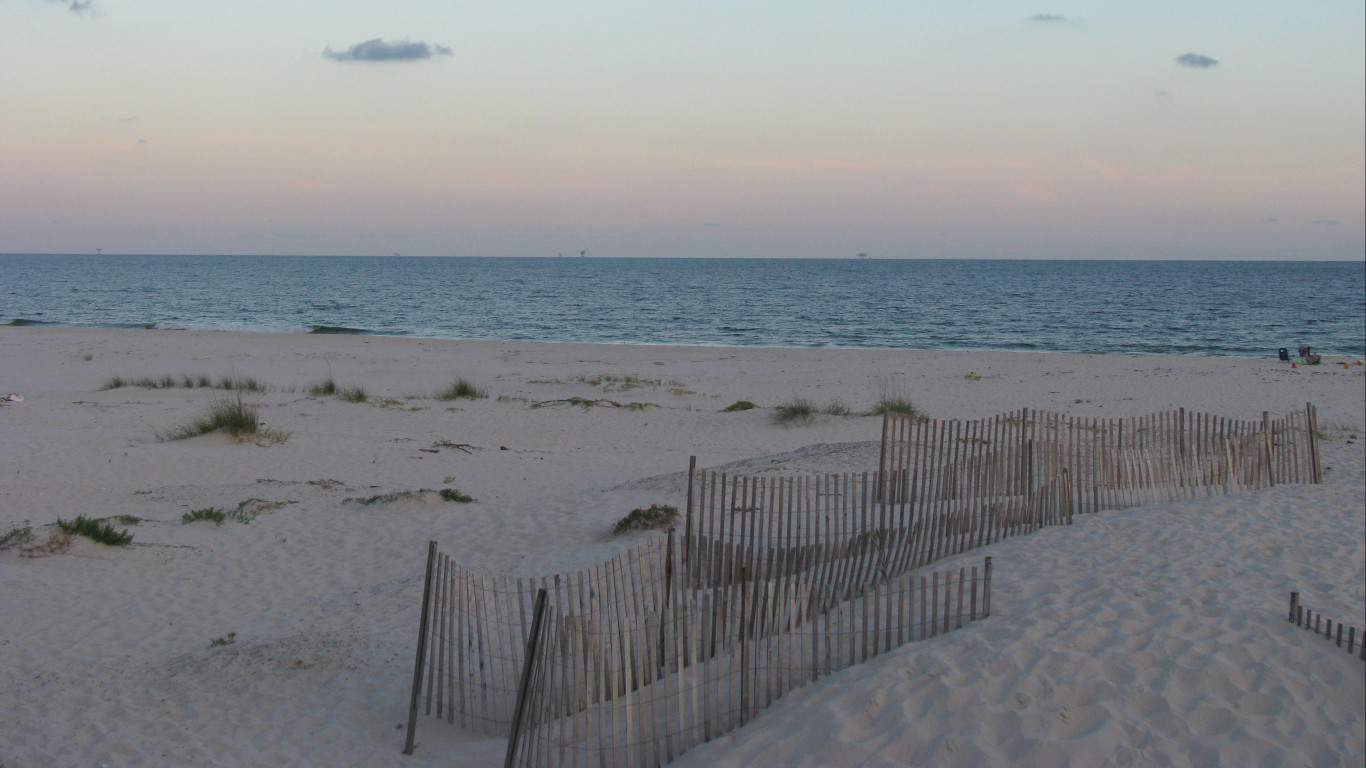
- Paid fishing licenses issued in 2021: 12.4 per 100 residents
- Total paid fishing licenses issues in 2021: 623,287 (20th most of 50 states)
- Avg. fishing license expense in 2021: $28.83 per license holder (22nd highest of 50 states)
- State surface area covered by water: 1,775 square miles (3.4% of surface area — 25th highest of 50 states)
- Shoreline (incl. Great Lakes): 607 miles
23. Iowa
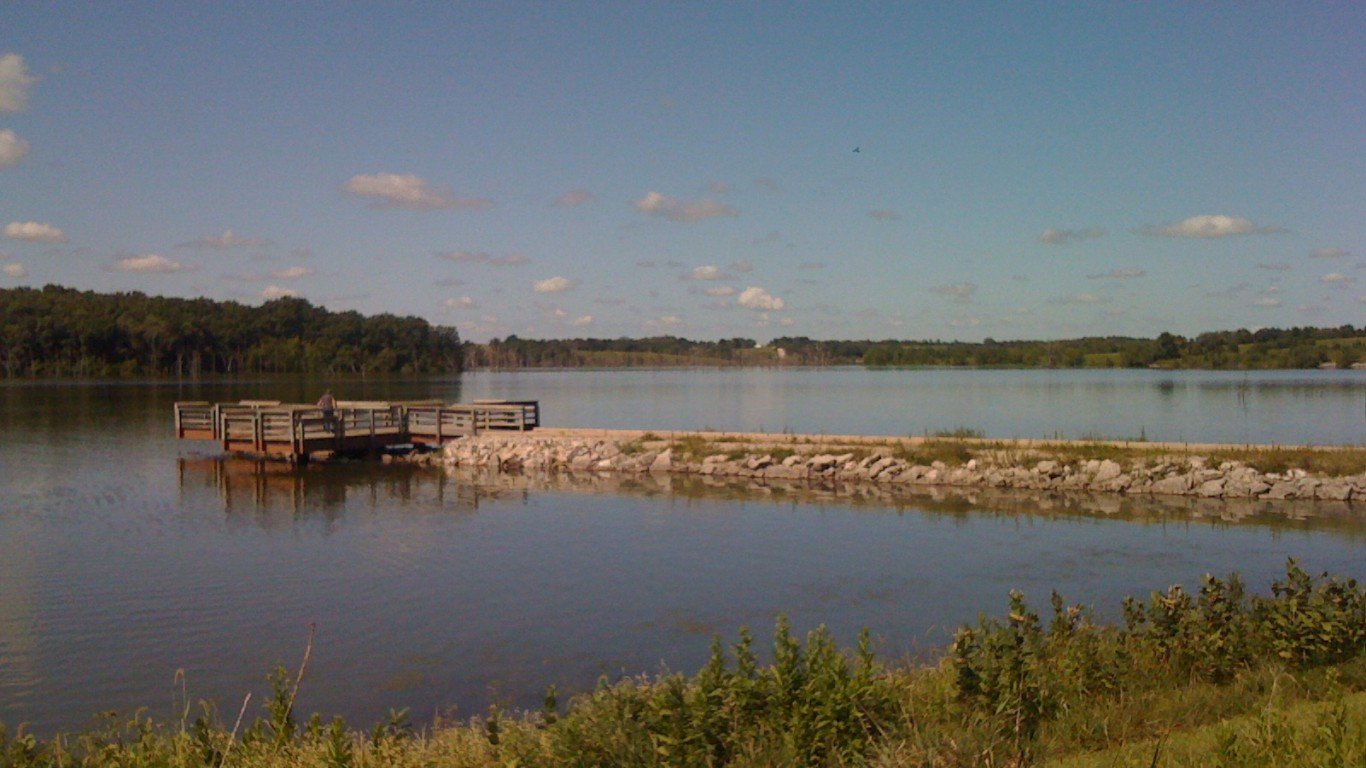
- Paid fishing licenses issued in 2021: 12.6 per 100 residents
- Total paid fishing licenses issues in 2021: 401,686 (21st fewest of 50 states)
- Avg. fishing license expense in 2021: $31.14 per license holder (17th highest of 50 states)
- State surface area covered by water: 416 square miles (0.7% of surface area — 8th lowest of 50 states)
- Shoreline (incl. Great Lakes): None
22. Kentucky
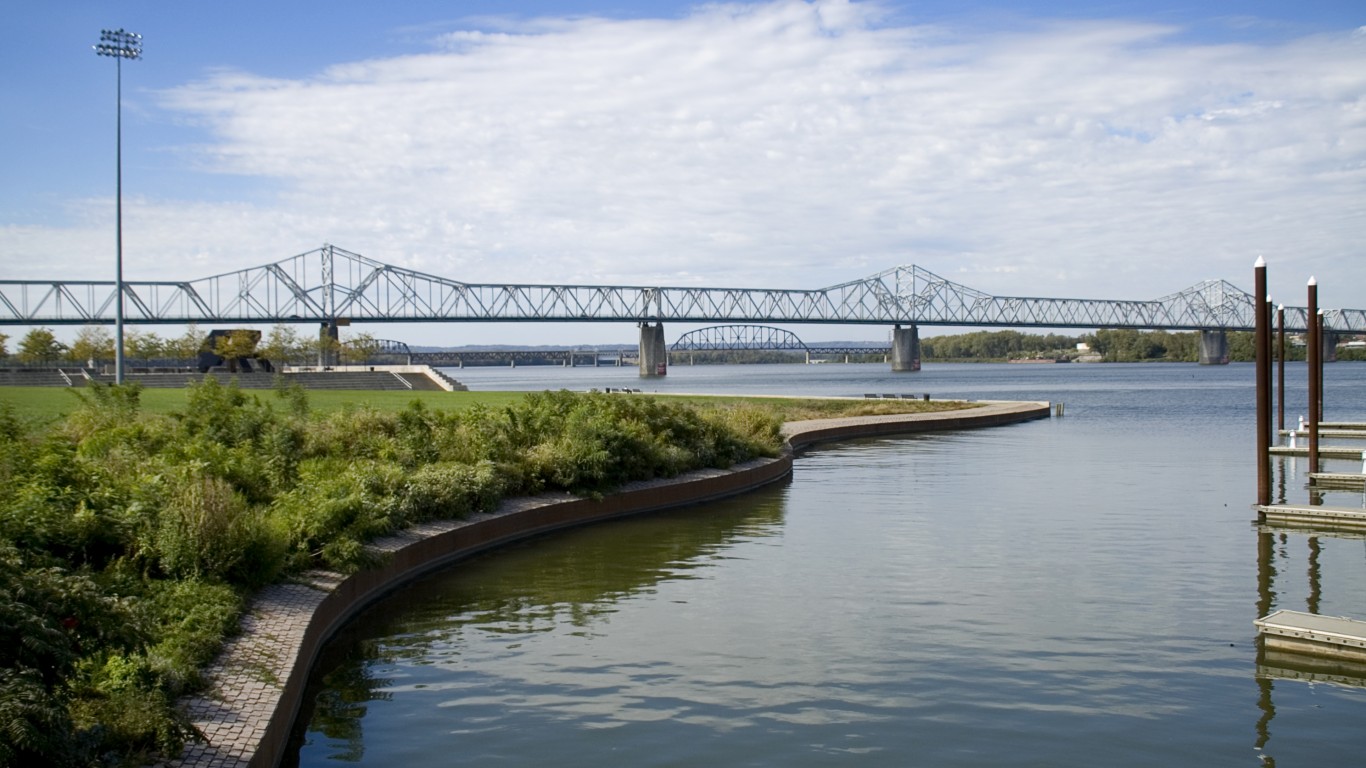
- Paid fishing licenses issued in 2021: 13.2 per 100 residents
- Total paid fishing licenses issues in 2021: 593,612 (25th most of 50 states)
- Avg. fishing license expense in 2021: $20.66 per license holder (16th lowest of 50 states)
- State surface area covered by water: 921 square miles (2.3% of surface area — 18th lowest of 50 states)
- Shoreline (incl. Great Lakes): None
21. Tennessee
- Paid fishing licenses issued in 2021: 13.2 per 100 residents
- Total paid fishing licenses issues in 2021: 923,447 (11th most of 50 states)
- Avg. fishing license expense in 2021: $27.51 per license holder (24th highest of 50 states)
- State surface area covered by water: 909 square miles (2.2% of surface area — 17th lowest of 50 states)
- Shoreline (incl. Great Lakes): None
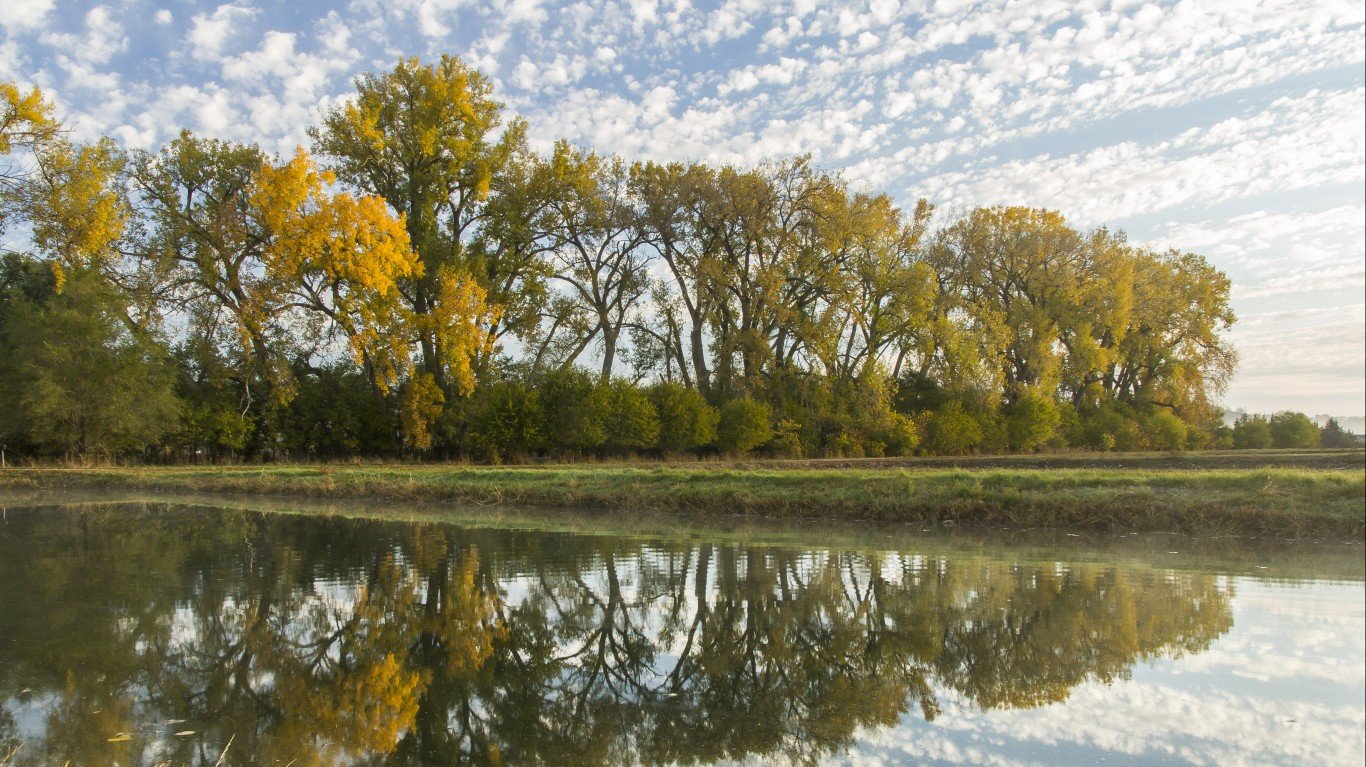
20. Nebraska

- Paid fishing licenses issued in 2021: 13.6 per 100 residents
- Total paid fishing licenses issues in 2021: 266,741 (12th fewest of 50 states)
- Avg. fishing license expense in 2021: $32.90 per license holder (12th highest of 50 states)
- State surface area covered by water: 524 square miles (0.7% of surface area — 5th lowest of 50 states)
- Shoreline (incl. Great Lakes): None
19. New Hampshire
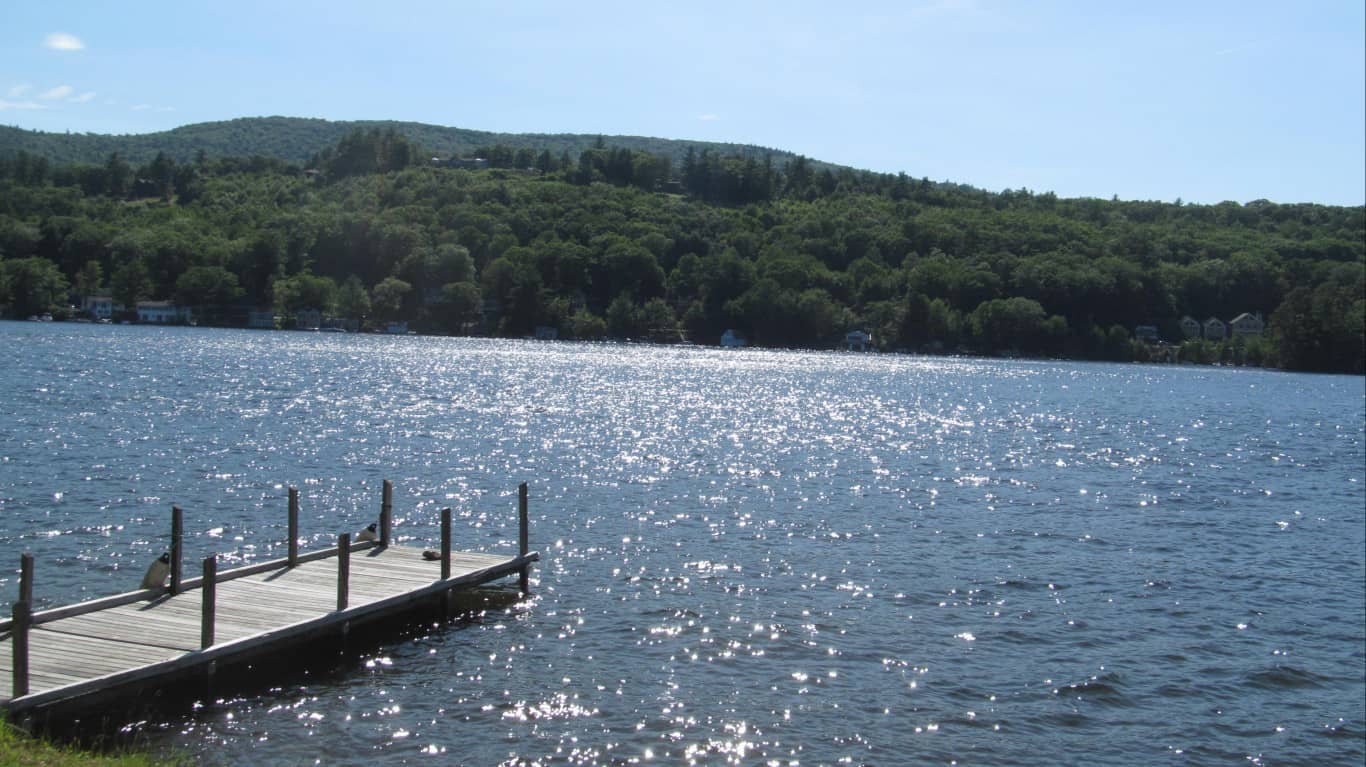
- Paid fishing licenses issued in 2021: 13.8 per 100 residents
- Total paid fishing licenses issues in 2021: 191,034 (7th fewest of 50 states)
- Avg. fishing license expense in 2021: $41.85 per license holder (7th highest of 50 states)
- State surface area covered by water: 397 square miles (4.2% of surface area — 22nd highest of 50 states)
- Shoreline (incl. Great Lakes): 131 miles
18. North Carolina
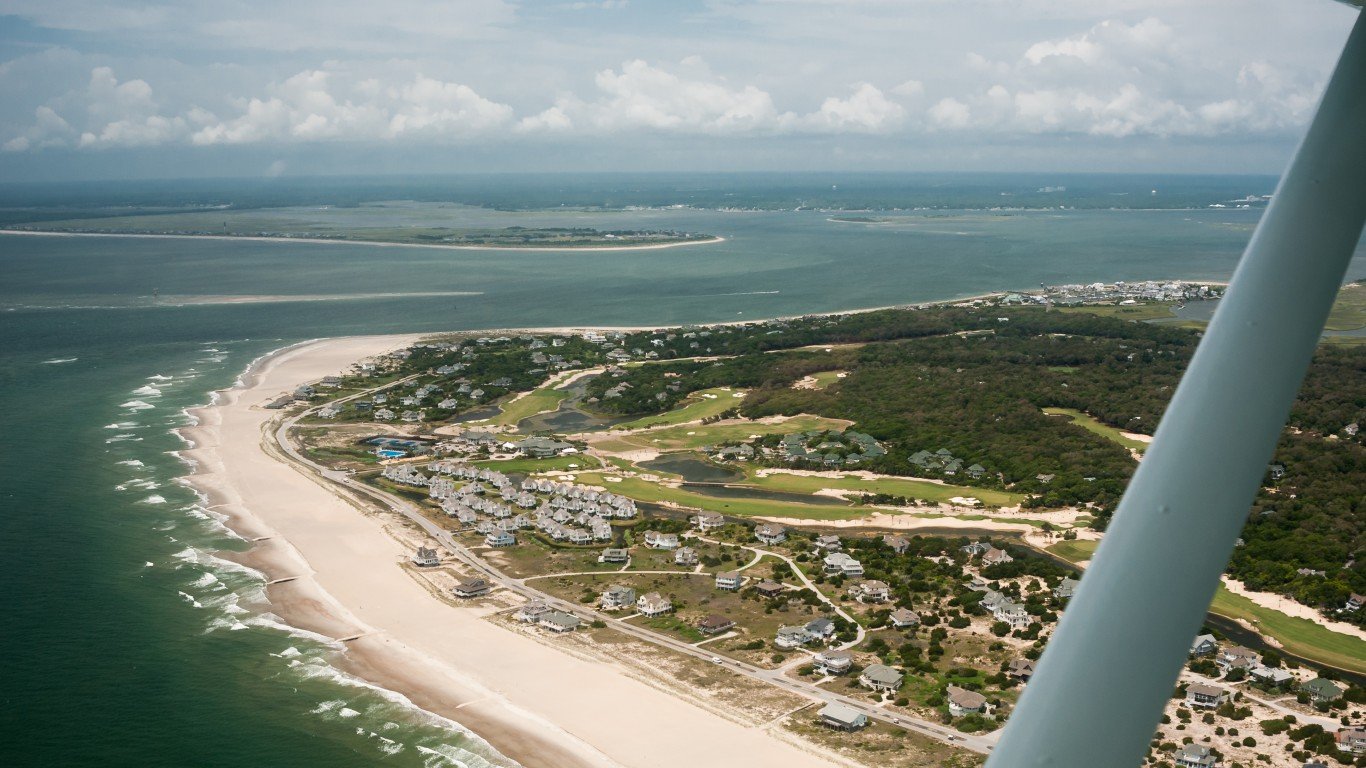
- Paid fishing licenses issued in 2021: 14.1 per 100 residents
- Total paid fishing licenses issues in 2021: 1,487,575 (5th most of 50 states)
- Avg. fishing license expense in 2021: $19.41 per license holder (14th lowest of 50 states)
- State surface area covered by water: 5,201 square miles (9.7% of surface area — 15th highest of 50 states)
- Shoreline (incl. Great Lakes): 3,375 miles
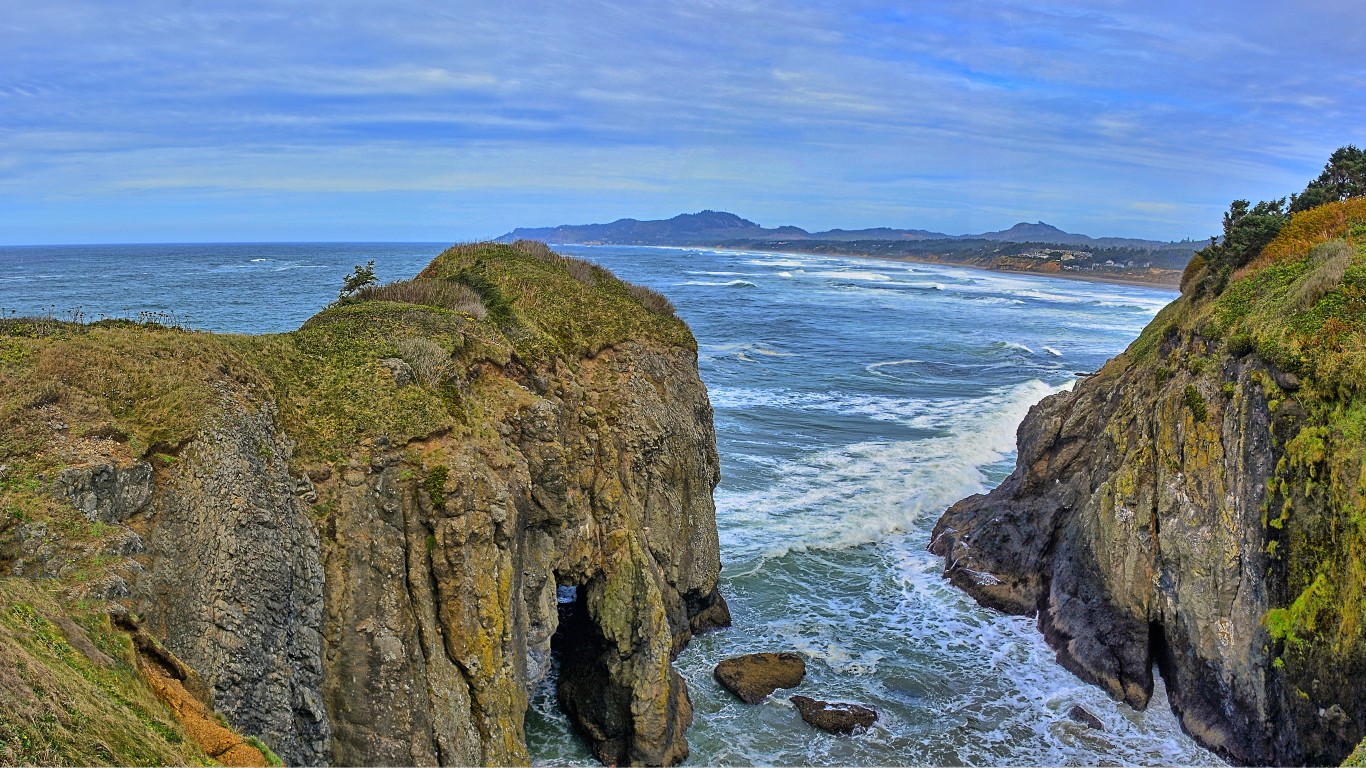
17. Oregon
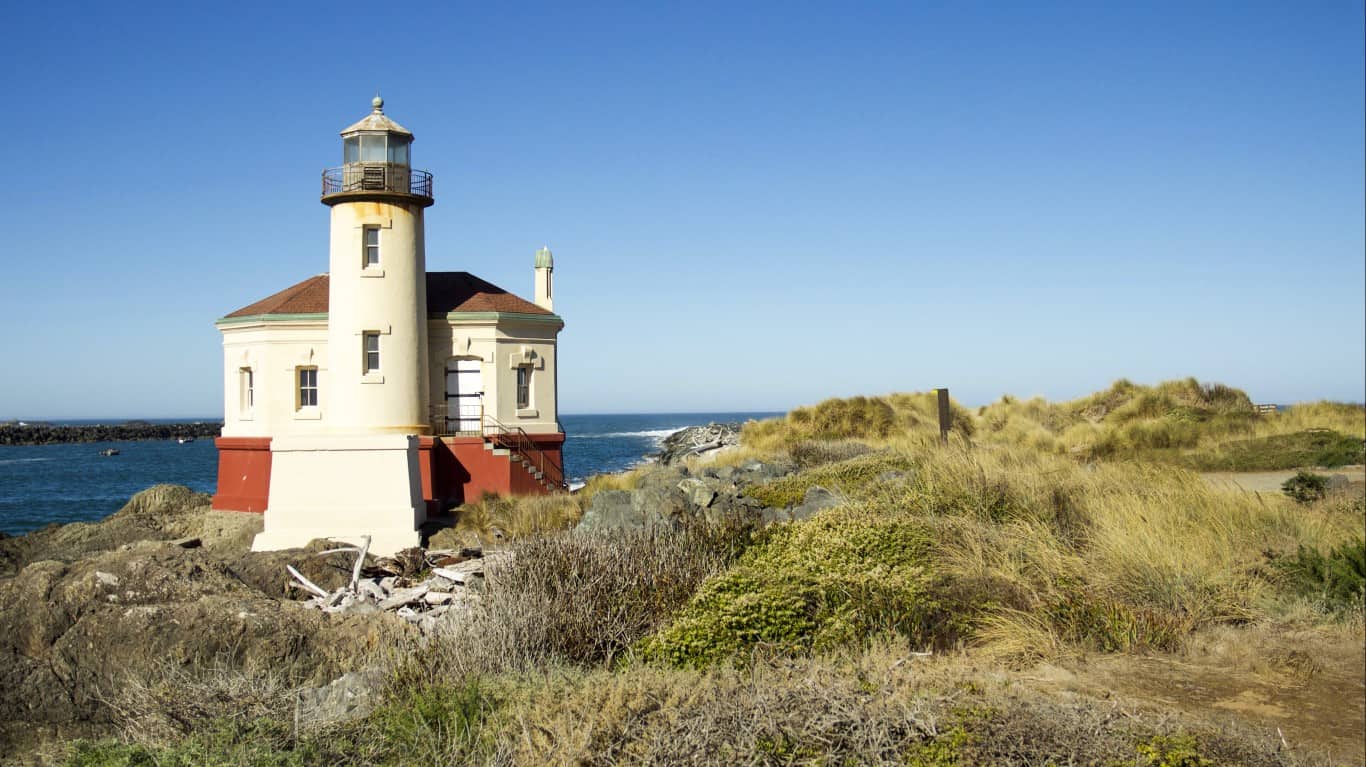
- Paid fishing licenses issued in 2021: 15.3 per 100 residents
- Total paid fishing licenses issues in 2021: 650,307 (19th most of 50 states)
- Avg. fishing license expense in 2021: $48.00 per license holder (3rd highest of 50 states)
- State surface area covered by water: 2,391 square miles (2.4% of surface area — 20th lowest of 50 states)
- Shoreline (incl. Great Lakes): 1,410 miles
16. West Virginia
- Paid fishing licenses issued in 2021: 16.3 per 100 residents
- Total paid fishing licenses issues in 2021: 290,967 (16th fewest of 50 states)
- Avg. fishing license expense in 2021: $18.41 per license holder (11th lowest of 50 states)
- State surface area covered by water: 192 square miles (0.8% of surface area — 9th lowest of 50 states)
- Shoreline (incl. Great Lakes): None
15. Louisiana
- Paid fishing licenses issued in 2021: 16.8 per 100 residents
- Total paid fishing licenses issues in 2021: 775,308 (15th most of 50 states)
- Avg. fishing license expense in 2021: $14.72 per license holder (5th lowest of 50 states)
- State surface area covered by water: 9,174 square miles (17.5% of surface area — 8th highest of 50 states)
- Shoreline (incl. Great Lakes): 7,721 miles
14. Arkansas
- Paid fishing licenses issued in 2021: 18.0 per 100 residents
- Total paid fishing licenses issues in 2021: 543,860 (24th fewest of 50 states)
- Avg. fishing license expense in 2021: $18.90 per license holder (12th lowest of 50 states)
- State surface area covered by water: 1,143 square miles (2.1% of surface area — 16th lowest of 50 states)
- Shoreline (incl. Great Lakes): None
13. Colorado
- Paid fishing licenses issued in 2021: 18.0 per 100 residents
- Total paid fishing licenses issues in 2021: 1,048,260 (10th most of 50 states)
- Avg. fishing license expense in 2021: $30.85 per license holder (18th highest of 50 states)
- State surface area covered by water: 452 square miles (0.4% of surface area — 3rd lowest of 50 states)
- Shoreline (incl. Great Lakes): None
12. Utah

- Paid fishing licenses issued in 2021: 18.1 per 100 residents
- Total paid fishing licenses issues in 2021: 604,287 (22nd most of 50 states)
- Avg. fishing license expense in 2021: $31.62 per license holder (15th highest of 50 states)
- State surface area covered by water: 2,727 square miles (3.2% of surface area — 24th lowest of 50 states)
- Shoreline (incl. Great Lakes): None
11. Oklahoma

- Paid fishing licenses issued in 2021: 19.1 per 100 residents
- Total paid fishing licenses issues in 2021: 761,573 (16th most of 50 states)
- Avg. fishing license expense in 2021: $16.95 per license holder (8th lowest of 50 states)
- State surface area covered by water: 1,304 square miles (1.9% of surface area — 15th lowest of 50 states)
- Shoreline (incl. Great Lakes): None
10. Vermont

- Paid fishing licenses issued in 2021: 19.3 per 100 residents
- Total paid fishing licenses issues in 2021: 124,898 (4th fewest of 50 states)
- Avg. fishing license expense in 2021: $34.83 per license holder (9th highest of 50 states)
- State surface area covered by water: 400 square miles (4.2% of surface area — 23rd highest of 50 states)
- Shoreline (incl. Great Lakes): None
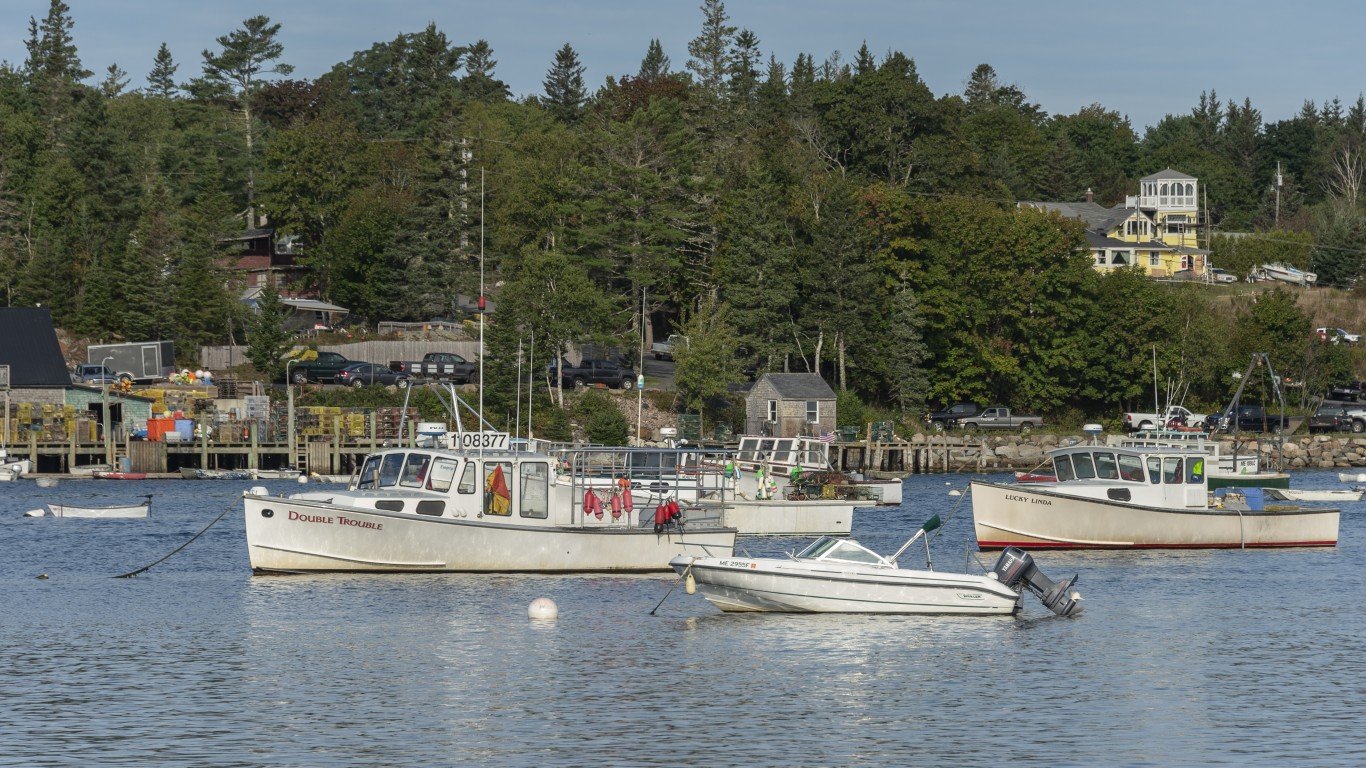
9. Maine

- Paid fishing licenses issued in 2021: 24.0 per 100 residents
- Total paid fishing licenses issues in 2021: 328,989 (20th fewest of 50 states)
- Avg. fishing license expense in 2021: $24.63 per license holder (20th lowest of 50 states)
- State surface area covered by water: 4,537 square miles (12.8% of surface area — 13th highest of 50 states)
- Shoreline (incl. Great Lakes): 3,478 miles
8. Wisconsin

- Paid fishing licenses issued in 2021: 24.3 per 100 residents
- Total paid fishing licenses issues in 2021: 1,434,816 (6th most of 50 states)
- Avg. fishing license expense in 2021: $24.44 per license holder (19th lowest of 50 states)
- State surface area covered by water: 11,339 square miles (17.3% of surface area — 9th highest of 50 states)
- Shoreline (incl. Great Lakes): 820 miles
7. Minnesota
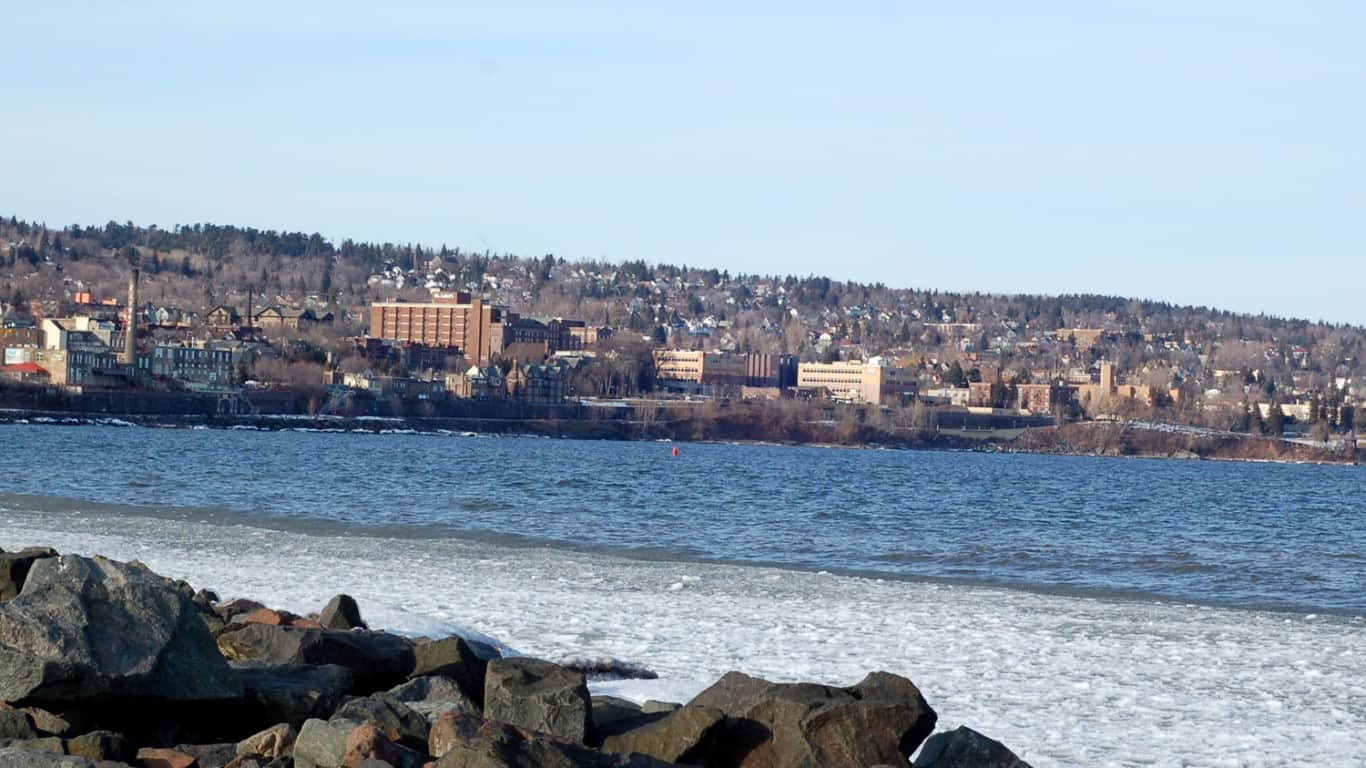
- Paid fishing licenses issued in 2021: 26.7 per 100 residents
- Total paid fishing licenses issues in 2021: 1,525,029 (4th most of 50 states)
- Avg. fishing license expense in 2021: $26.36 per license holder (24th lowest of 50 states)
- State surface area covered by water: 7,309 square miles (8.4% of surface area — 17th highest of 50 states)
- Shoreline (incl. Great Lakes): 189 miles
6. South Dakota
- Paid fishing licenses issued in 2021: 27.6 per 100 residents
- Total paid fishing licenses issues in 2021: 247,186 (10th fewest of 50 states)
- Avg. fishing license expense in 2021: $30.76 per license holder (19th highest of 50 states)
- State surface area covered by water: 1,305 square miles (1.7% of surface area — 14th lowest of 50 states)
- Shoreline (incl. Great Lakes): None
5. North Dakota
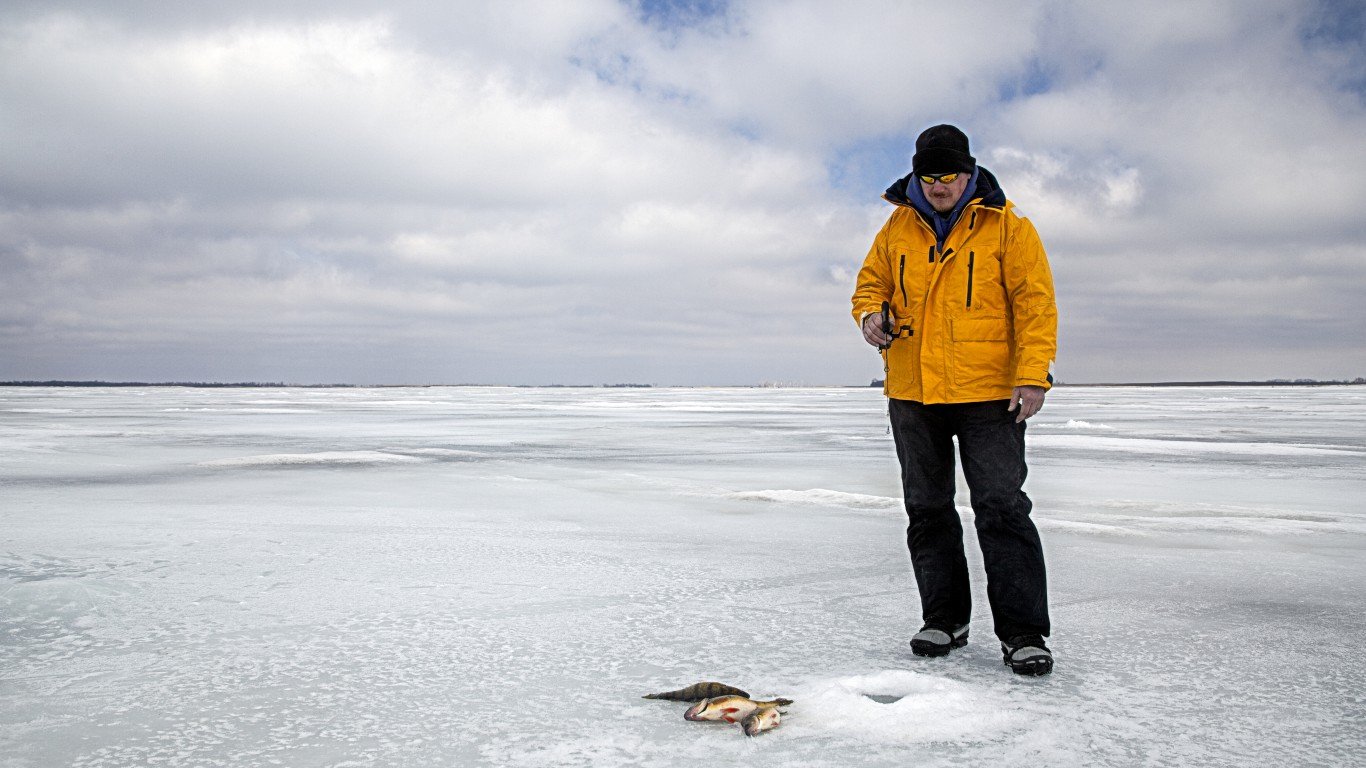
- Paid fishing licenses issued in 2021: 29.2 per 100 residents
- Total paid fishing licenses issues in 2021: 226,654 (9th fewest of 50 states)
- Avg. fishing license expense in 2021: $19.12 per license holder (13th lowest of 50 states)
- State surface area covered by water: 1,698 square miles (2.4% of surface area — 19th lowest of 50 states)
- Shoreline (incl. Great Lakes): None
4. Idaho

- Paid fishing licenses issued in 2021: 29.6 per 100 residents
- Total paid fishing licenses issues in 2021: 563,531 (25th fewest of 50 states)
- Avg. fishing license expense in 2021: $38.78 per license holder (8th highest of 50 states)
- State surface area covered by water: 926 square miles (1.1% of surface area — 11th lowest of 50 states)
- Shoreline (incl. Great Lakes): None
3. Alaska
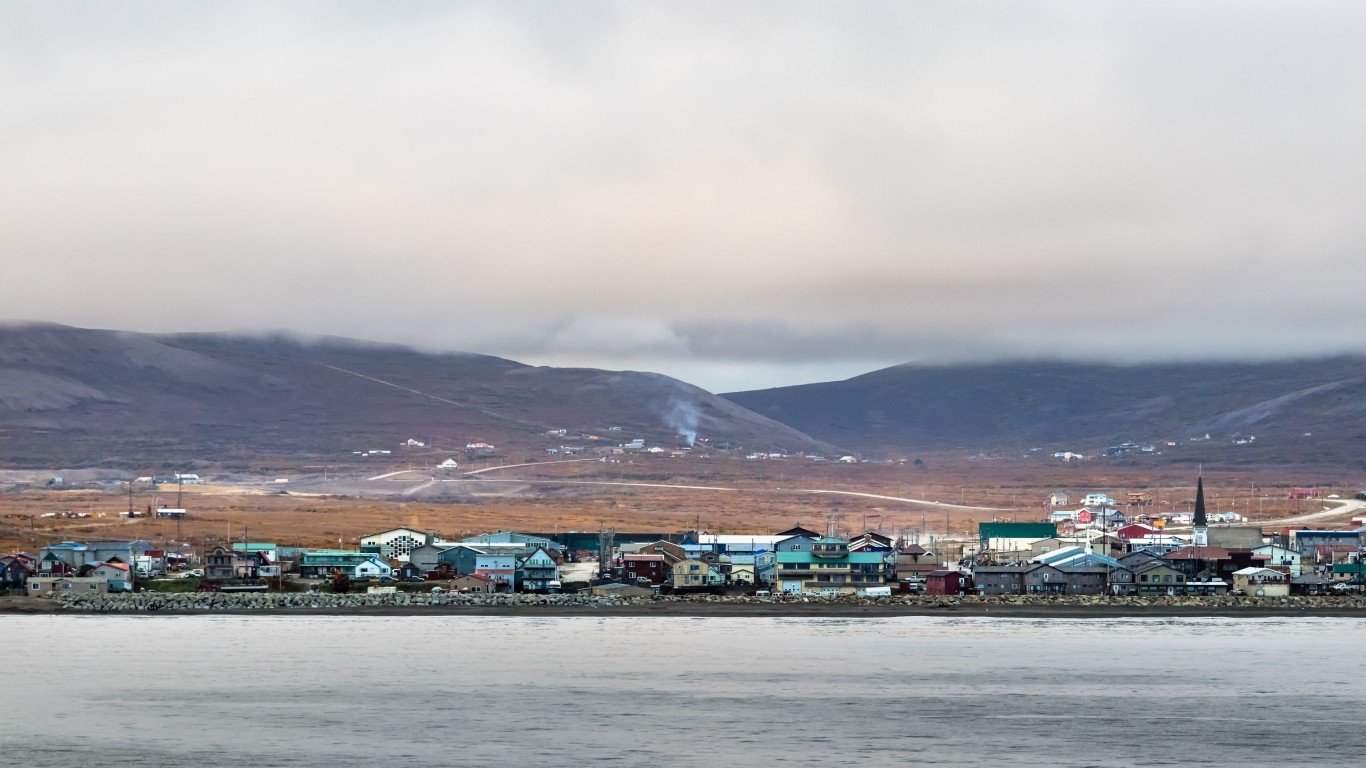
- Paid fishing licenses issued in 2021: 38.7 per 100 residents
- Total paid fishing licenses issues in 2021: 283,646 (15th fewest of 50 states)
- Avg. fishing license expense in 2021: $52.76 per license holder (the highest of 50 states)
- State surface area covered by water: 94,743 square miles (14.2% of surface area — 11th highest of 50 states)
- Shoreline (incl. Great Lakes): 33,904 miles
2. Montana
- Paid fishing licenses issued in 2021: 41.4 per 100 residents
- Total paid fishing licenses issues in 2021: 456,764 (22nd fewest of 50 states)
- Avg. fishing license expense in 2021: $45.73 per license holder (5th highest of 50 states)
- State surface area covered by water: 1,494 square miles (1.0% of surface area — 10th lowest of 50 states)
- Shoreline (incl. Great Lakes): None
1. Wyoming

- Paid fishing licenses issued in 2021: 46.4 per 100 residents
- Total paid fishing licenses issues in 2021: 268,606 (13th fewest of 50 states)
- Avg. fishing license expense in 2021: $33.26 per license holder (10th highest of 50 states)
- State surface area covered by water: 720 square miles (0.7% of surface area — 7th lowest of 50 states)
- Shoreline (incl. Great Lakes): None
Contact [email protected] for any questions or corrections.