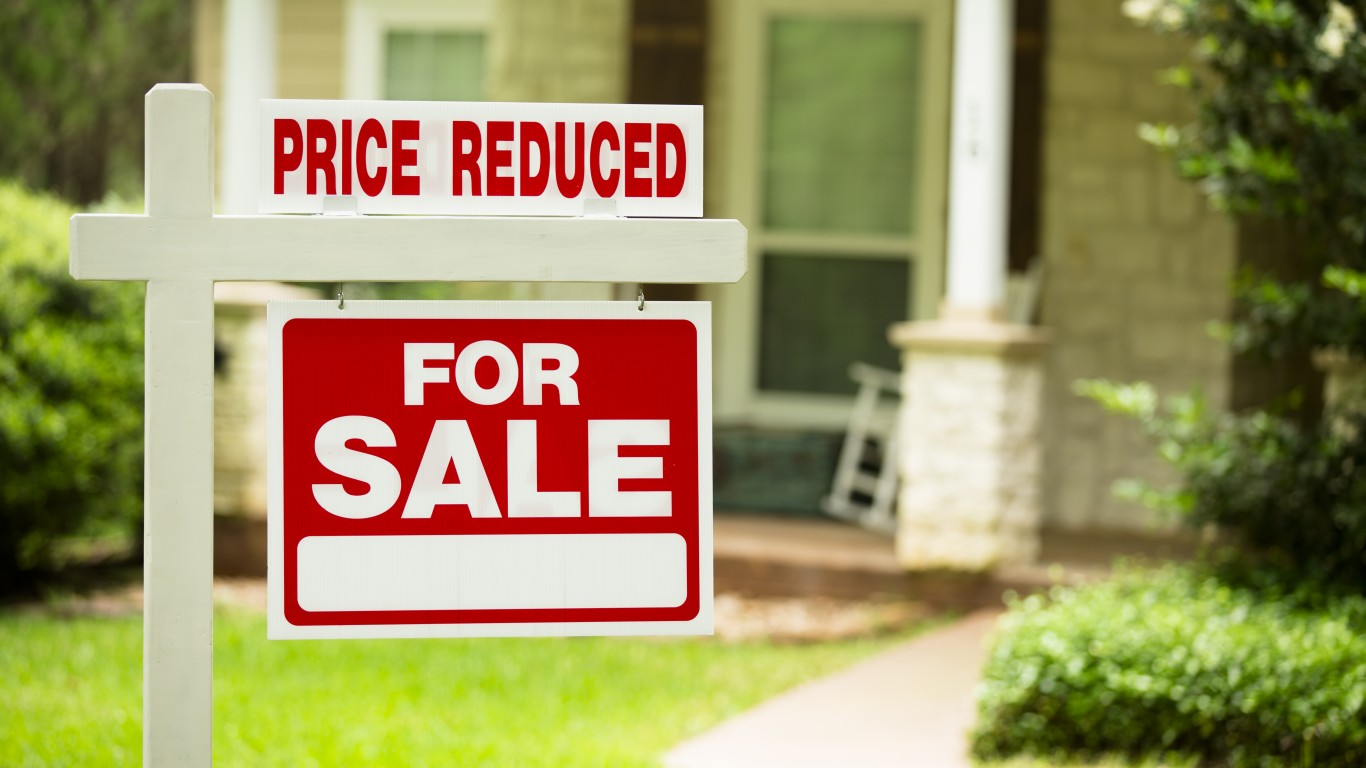
Since the beginning of the COVID-19 pandemic, home prices in the United States have climbed twice as fast as incomes. Now, millions of Americans are effectively priced out of the market. Surging home prices are due in large part to a historic housing shortage, estimated to be as high as 4.7 million units.
While the ongoing housing affordability crisis has grown especially pronounced in the last five years, the causes of the supply shortage can be traced back nearly two decades. During the Great Recession, which lasted from December 2007 to June 2009, home prices fell by nearly 14% in the United States. Home prices continued to fall for years after the recession officially ended, bottoming out in February 2011 25% lower than the pre-recession high reported in July 2006, according to the Case-Shiller index.
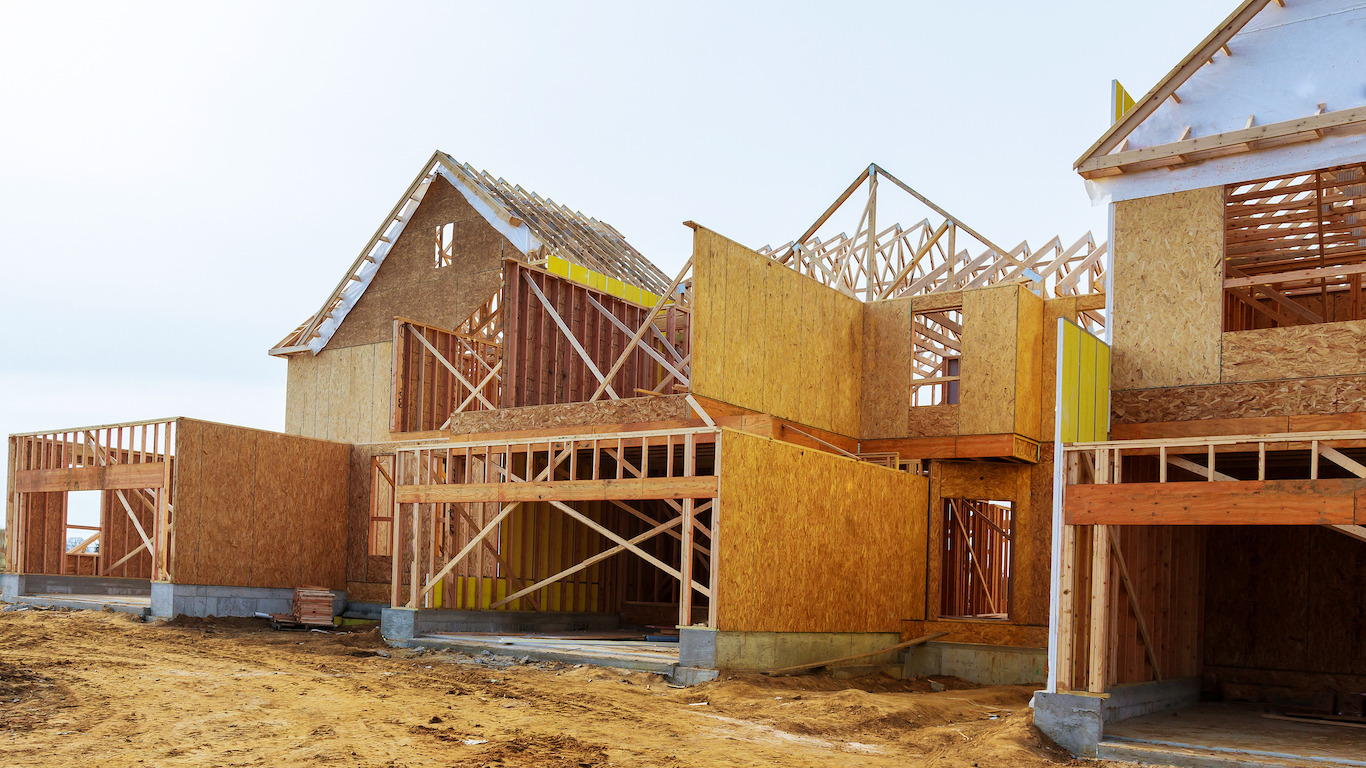
Because of the recession’s impact on the housing market, many Americans were hesitant to invest in a home, and the number of skilled laborers in the home building sector fell sharply. As a result, new home construction slowed to historic lows. According to the National Association of Home Builders, there were only 6.8 million new housing construction starts in the 2010s, down from 12.3 million in the 2000s.
Reduced investment in housing has had economic consequences that extend well beyond the rising cost of homeownership. According to a recent report from the U.S. Chamber of Commerce, the housing shortage cumulatively resulted in over $430 billion in lost economic output, $246 billion in lost wages, and 3.2 million jobs across the 50 states between 2008 and 2025.
Using data from The State of Housing in America report from the U.S. Chamber of Commerce, 24/7 Wall St. identified the state economies hit hardest by the housing crisis. States are ranked on the estimated loss in economic activity from 2008 to July 2025 as a share of annual gross domestic product. Calculations were made using 2024 GDP figures from the Bureau of Economic Analysis. Cumulative job losses as a share of the unemployed population were calculated using 2024 data from the Bureau of Labor Statistics. Income losses per capita were calculated using one-year population estimates from the U.S. Census Bureau’s 2024 American Community Survey. Supplemental data on median home list prices, median list price per square foot, and total active listings by state are from Realtor.com and are current as of September 2025.
Depending on the state, economic losses linked to the housing shortage over the last 17 years range from $701.2 million to $63.1 billion, representing between 1.0% and 2.2% of annual GDP. In these states, lost personal income totals range from about $423 million to nearly $356 billion, or $655 to $1,897 per resident. In most cases, total job losses since 2008 number in the tens of thousands, and in some states, they even exceed the current number of unemployed residents
These are the state economies hit hardest by the housing crisis.
Why It Matters
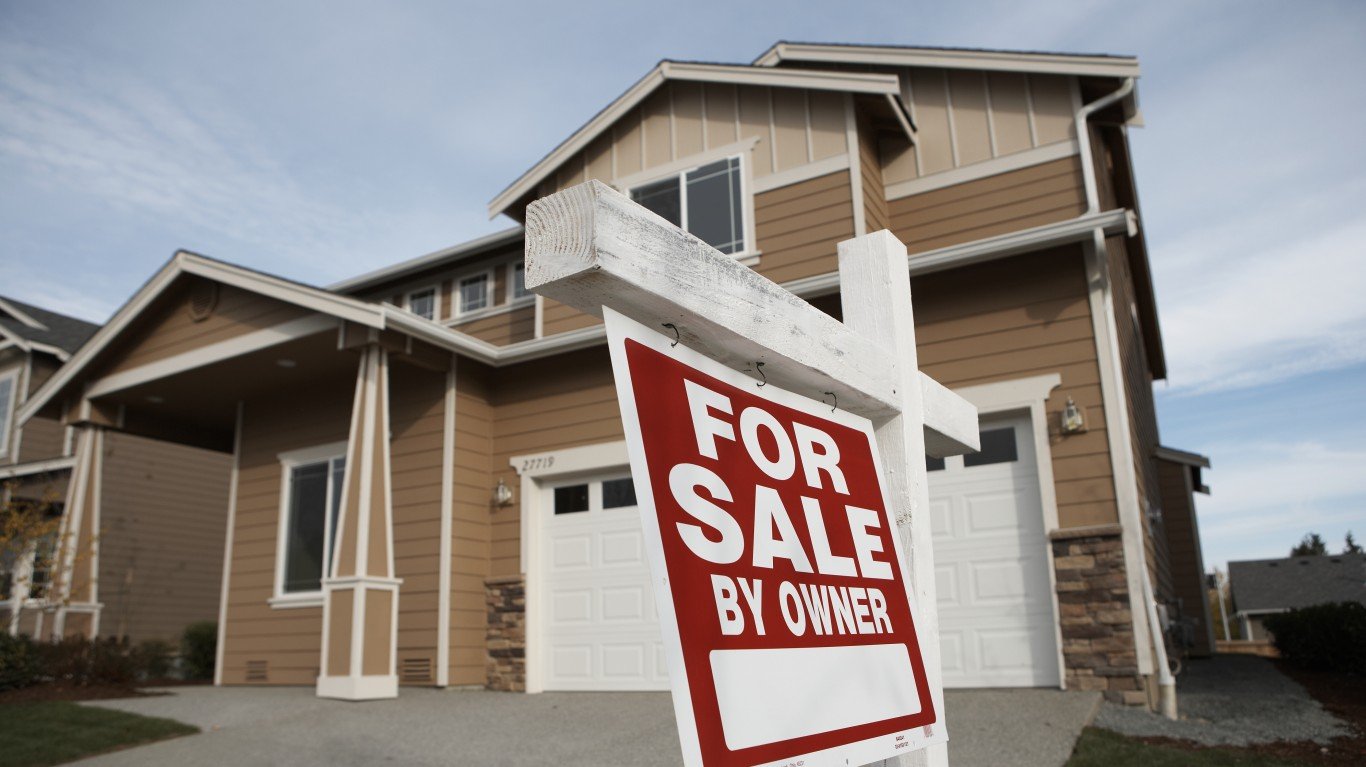
Supply constraints and rising demand have given way to a housing affordability crisis in the United States. Even without factoring in historically high mortgage rates, the median list price of a typical American home is more than five times the annual income of a typical household. The effects of the supply shortage extend well beyond housing affordability, however, as reduced investment in new home construction has placed a meaningful burden on the national economy, reducing economic output by hundreds of billions of dollars since 2008.
50. New Mexico

- Loss of economic output due to housing shortage, 2008-2025: 1.0% of annual GDP
- Total loss of economic output due to housing shortage, 2008-2025: $1.5 billion (11th least of the 50 states)
- Jobs not generated due to limited housing investment, 2008-2025: 30.1% of current unemployed residents — the lowest of the 50 states (12,273 total jobs)
- Loss of personal income due to limited housing investment, 2008-2025: $715 per resident — 3rd least of the 50 states ($710.9 million total)
- Median home list price in state: $400,000 (24th lowest of the 50 states)
- Median list price per square foot in state: $215 (25th lowest of the 50 states)
- Total active listings in state: 6,803
49. Oklahoma

- Loss of economic output due to housing shortage, 2008-2025: 1.1% of annual GDP
- Total loss of economic output due to housing shortage, 2008-2025: $2.9 billion (18th least of the 50 states)
- Jobs not generated due to limited housing investment, 2008-2025: 40.6% of current unemployed residents — 10th lowest of the 50 states (26,599 total jobs)
- Loss of personal income due to limited housing investment, 2008-2025: $703 per resident — 2nd least of the 50 states ($1.6 billion total)
- Median home list price in state: $299,250 (7th lowest of the 50 states)
- Median list price per square foot in state: $161 (6th lowest of the 50 states)
- Total active listings in state: 15,907
48. Mississippi

- Loss of economic output due to housing shortage, 2008-2025: 1.2% of annual GDP
- Total loss of economic output due to housing shortage, 2008-2025: $1.9 billion (13th least of the 50 states)
- Jobs not generated due to limited housing investment, 2008-2025: 46.5% of current unemployed residents — 18th lowest of the 50 states (18,700 total jobs)
- Loss of personal income due to limited housing investment, 2008-2025: $655 per resident — the least of the 50 states ($1.0 billion total)
- Median home list price in state: $296,500 (6th lowest of the 50 states)
- Median list price per square foot in state: $148 (2nd lowest of the 50 states)
- Total active listings in state: 8,859
47. Kentucky

- Loss of economic output due to housing shortage, 2008-2025: 1.2% of annual GDP
- Total loss of economic output due to housing shortage, 2008-2025: $3.7 billion (20th least of the 50 states)
- Jobs not generated due to limited housing investment, 2008-2025: 30.7% of current unemployed residents — 2nd lowest of the 50 states (32,601 total jobs)
- Loss of personal income due to limited housing investment, 2008-2025: $804 per resident — 5th least of the 50 states ($1.9 billion total)
- Median home list price in state: $309,900 (12th lowest of the 50 states)
- Median list price per square foot in state: $173 (14th lowest of the 50 states)
- Total active listings in state: 11,913
46. New York
- Loss of economic output due to housing shortage, 2008-2025: 1.3% of annual GDP
- Total loss of economic output due to housing shortage, 2008-2025: $29.3 billion (3rd most of the 50 states)
- Jobs not generated due to limited housing investment, 2008-2025: 38.7% of current unemployed residents — 8th lowest of the 50 states (163,718 total jobs)
- Loss of personal income due to limited housing investment, 2008-2025: $1,475 per resident — 12th most of the 50 states ($13.7 billion total)
- Median home list price in state: $649,450 (4th highest of the 50 states)
- Median list price per square foot in state: $397 (4th highest of the 50 states)
- Total active listings in state: 38,175
45. Delaware

- Loss of economic output due to housing shortage, 2008-2025: 1.3% of annual GDP
- Total loss of economic output due to housing shortage, 2008-2025: $1.4 billion (8th least of the 50 states)
- Jobs not generated due to limited housing investment, 2008-2025: 50.1% of current unemployed residents — 24th lowest of the 50 states (9,347 total jobs)
- Loss of personal income due to limited housing investment, 2008-2025: $1,332 per resident — 17th most of the 50 states ($662.5 million total)
- Median home list price in state: $485,445 (17th highest of the 50 states)
- Median list price per square foot in state: $234 (22nd highest of the 50 states)
- Total active listings in state: 3,128
44. Michigan

- Loss of economic output due to housing shortage, 2008-2025: 1.3% of annual GDP
- Total loss of economic output due to housing shortage, 2008-2025: $9.2 billion (15th most of the 50 states)
- Jobs not generated due to limited housing investment, 2008-2025: 32.2% of current unemployed residents — 4th lowest of the 50 states (76,576 total jobs)
- Loss of personal income due to limited housing investment, 2008-2025: $905 per resident — 8th least of the 50 states ($5.2 billion total)
- Median home list price in state: $299,900 (9th lowest of the 50 states)
- Median list price per square foot in state: $183 (15th lowest of the 50 states)
- Total active listings in state: 25,314
43. West Virginia

- Loss of economic output due to housing shortage, 2008-2025: 1.3% of annual GDP
- Total loss of economic output due to housing shortage, 2008-2025: $1.4 billion (7th least of the 50 states)
- Jobs not generated due to limited housing investment, 2008-2025: 32.0% of current unemployed residents — 3rd lowest of the 50 states (10,240 total jobs)
- Loss of personal income due to limited housing investment, 2008-2025: $789 per resident — 4th least of the 50 states ($626.5 million total)
- Median home list price in state: $261,500 (the lowest of the 50 states)
- Median list price per square foot in state: $144 (the lowest of the 50 states)
- Total active listings in state: 4,245
42. Alabama

- Loss of economic output due to housing shortage, 2008-2025: 1.4% of annual GDP
- Total loss of economic output due to housing shortage, 2008-2025: $4.4 billion (22nd least of the 50 states)
- Jobs not generated due to limited housing investment, 2008-2025: 52.6% of current unemployed residents — 23rd highest of the 50 states (38,069 total jobs)
- Loss of personal income due to limited housing investment, 2008-2025: $852 per resident — 7th least of the 50 states ($2.3 billion total)
- Median home list price in state: $329,950 (15th lowest of the 50 states)
- Median list price per square foot in state: $166 (10th lowest of the 50 states)
- Total active listings in state: 20,765
41. Arkansas

- Loss of economic output due to housing shortage, 2008-2025: 1.4% of annual GDP
- Total loss of economic output due to housing shortage, 2008-2025: $2.6 billion (16th least of the 50 states)
- Jobs not generated due to limited housing investment, 2008-2025: 46.7% of current unemployed residents — 19th lowest of the 50 states (22,762 total jobs)
- Loss of personal income due to limited housing investment, 2008-2025: $841 per resident — 6th least of the 50 states ($1.3 billion total)
- Median home list price in state: $304,950 (11th lowest of the 50 states)
- Median list price per square foot in state: $162 (7th lowest of the 50 states)
- Total active listings in state: 13,192
40. North Carolina

- Loss of economic output due to housing shortage, 2008-2025: 1.4% of annual GDP
- Total loss of economic output due to housing shortage, 2008-2025: $11.7 billion (12th most of the 50 states)
- Jobs not generated due to limited housing investment, 2008-2025: 51.9% of current unemployed residents — 24th highest of the 50 states (99,448 total jobs)
- Loss of personal income due to limited housing investment, 2008-2025: $1,055 per resident — 11th least of the 50 states ($6.4 billion total)
- Median home list price in state: $419,450 (25th lowest of the 50 states)
- Median list price per square foot in state: $217 (25th highest of the 50 states)
- Total active listings in state: 43,706
39. Texas

- Loss of economic output due to housing shortage, 2008-2025: 1.4% of annual GDP
- Total loss of economic output due to housing shortage, 2008-2025: $38.4 billion (2nd most of the 50 states)
- Jobs not generated due to limited housing investment, 2008-2025: 50.7% of current unemployed residents — 25th lowest of the 50 states (322,973 total jobs)
- Loss of personal income due to limited housing investment, 2008-2025: $1,227 per resident — 25th least of the 50 states ($23.1 billion total)
- Median home list price in state: $364,950 (18th lowest of the 50 states)
- Median list price per square foot in state: $184 (16th lowest of the 50 states)
- Total active listings in state: 135,984
38. Illinois

- Loss of economic output due to housing shortage, 2008-2025: 1.4% of annual GDP
- Total loss of economic output due to housing shortage, 2008-2025: $16.0 billion (5th most of the 50 states)
- Jobs not generated due to limited housing investment, 2008-2025: 34.6% of current unemployed residents — 5th lowest of the 50 states (114,353 total jobs)
- Loss of personal income due to limited housing investment, 2008-2025: $1,255 per resident — 23rd most of the 50 states ($9.5 billion total)
- Median home list price in state: $316,500 (13th lowest of the 50 states)
- Median list price per square foot in state: $185 (17th lowest of the 50 states)
- Total active listings in state: 22,546
37. Kansas

- Loss of economic output due to housing shortage, 2008-2025: 1.4% of annual GDP
- Total loss of economic output due to housing shortage, 2008-2025: $3.2 billion (19th least of the 50 states)
- Jobs not generated due to limited housing investment, 2008-2025: 44.7% of current unemployed residents — 17th lowest of the 50 states (24,705 total jobs)
- Loss of personal income due to limited housing investment, 2008-2025: $1,079 per resident — 14th least of the 50 states ($1.8 billion total)
- Median home list price in state: $295,000 (5th lowest of the 50 states)
- Median list price per square foot in state: $151 (3rd lowest of the 50 states)
- Total active listings in state: 7,965
36. Nebraska

- Loss of economic output due to housing shortage, 2008-2025: 1.4% of annual GDP
- Total loss of economic output due to housing shortage, 2008-2025: $2.6 billion (17th least of the 50 states)
- Jobs not generated due to limited housing investment, 2008-2025: 68.1% of current unemployed residents — 7th highest of the 50 states (20,075 total jobs)
- Loss of personal income due to limited housing investment, 2008-2025: $1,312 per resident — 19th most of the 50 states ($1.3 billion total)
- Median home list price in state: $343,400 (16th lowest of the 50 states)
- Median list price per square foot in state: $169 (12th lowest of the 50 states)
- Total active listings in state: 5,696
35. Ohio

- Loss of economic output due to housing shortage, 2008-2025: 1.4% of annual GDP
- Total loss of economic output due to housing shortage, 2008-2025: $13.0 billion (10th most of the 50 states)
- Jobs not generated due to limited housing investment, 2008-2025: 41.4% of current unemployed residents — 13th lowest of the 50 states (104,630 total jobs)
- Loss of personal income due to limited housing investment, 2008-2025: $1,095 per resident — 16th least of the 50 states ($7.1 billion total)
- Median home list price in state: $286,500 (4th lowest of the 50 states)
- Median list price per square foot in state: $166 (10th lowest of the 50 states)
- Total active listings in state: 21,574
34. Virginia

- Loss of economic output due to housing shortage, 2008-2025: 1.4% of annual GDP
- Total loss of economic output due to housing shortage, 2008-2025: $10.8 billion (14th most of the 50 states)
- Jobs not generated due to limited housing investment, 2008-2025: 62.9% of current unemployed residents — 14th highest of the 50 states (82,534 total jobs)
- Loss of personal income due to limited housing investment, 2008-2025: $1,224 per resident — 24th least of the 50 states ($6.0 billion total)
- Median home list price in state: $450,000 (21st highest of the 50 states)
- Median list price per square foot in state: $230 (24th highest of the 50 states)
- Total active listings in state: 21,543
33. Alaska

- Loss of economic output due to housing shortage, 2008-2025: 1.4% of annual GDP
- Total loss of economic output due to housing shortage, 2008-2025: $1.0 billion (3rd least of the 50 states)
- Jobs not generated due to limited housing investment, 2008-2025: 35.6% of current unemployed residents — 6th lowest of the 50 states (5,883 total jobs)
- Loss of personal income due to limited housing investment, 2008-2025: $1,379 per resident — 14th most of the 50 states ($499.3 million total)
- Median home list price in state: $445,000 (22nd highest of the 50 states)
- Median list price per square foot in state: $254 (19th highest of the 50 states)
- Total active listings in state: 2,033
32. South Carolina

- Loss of economic output due to housing shortage, 2008-2025: 1.4% of annual GDP
- Total loss of economic output due to housing shortage, 2008-2025: $5.1 billion (24th least of the 50 states)
- Jobs not generated due to limited housing investment, 2008-2025: 40.8% of current unemployed residents — 12th lowest of the 50 states (42,943 total jobs)
- Loss of personal income due to limited housing investment, 2008-2025: $934 per resident — 9th least of the 50 states ($2.7 billion total)
- Median home list price in state: $368,500 (19th lowest of the 50 states)
- Median list price per square foot in state: $203 (21st lowest of the 50 states)
- Total active listings in state: 26,748
31. Missouri

- Loss of economic output due to housing shortage, 2008-2025: 1.5% of annual GDP
- Total loss of economic output due to housing shortage, 2008-2025: $6.5 billion (22nd most of the 50 states)
- Jobs not generated due to limited housing investment, 2008-2025: 48.5% of current unemployed residents — 22nd lowest of the 50 states (55,413 total jobs)
- Loss of personal income due to limited housing investment, 2008-2025: $1,042 per resident — 10th least of the 50 states ($3.7 billion total)
- Median home list price in state: $302,450 (10th lowest of the 50 states)
- Median list price per square foot in state: $171 (13th lowest of the 50 states)
- Total active listings in state: 19,850
30. Louisiana

- Loss of economic output due to housing shortage, 2008-2025: 1.5% of annual GDP
- Total loss of economic output due to housing shortage, 2008-2025: $4.9 billion (23rd least of the 50 states)
- Jobs not generated due to limited housing investment, 2008-2025: 44.7% of current unemployed residents — 16th lowest of the 50 states (40,459 total jobs)
- Loss of personal income due to limited housing investment, 2008-2025: $1,058 per resident — 12th least of the 50 states ($2.5 billion total)
- Median home list price in state: $278,500 (2nd lowest of the 50 states)
- Median list price per square foot in state: $152 (4th lowest of the 50 states)
- Total active listings in state: 16,589
29. Pennsylvania

- Loss of economic output due to housing shortage, 2008-2025: 1.5% of annual GDP
- Total loss of economic output due to housing shortage, 2008-2025: $15.0 billion (7th most of the 50 states)
- Jobs not generated due to limited housing investment, 2008-2025: 49.8% of current unemployed residents — 23rd lowest of the 50 states (119,111 total jobs)
- Loss of personal income due to limited housing investment, 2008-2025: $1,146 per resident — 20th least of the 50 states ($9.2 billion total)
- Median home list price in state: $320,000 (14th lowest of the 50 states)
- Median list price per square foot in state: $192 (19th lowest of the 50 states)
- Total active listings in state: 25,898
28. Florida

- Loss of economic output due to housing shortage, 2008-2025: 1.5% of annual GDP
- Total loss of economic output due to housing shortage, 2008-2025: $25.8 billion (4th most of the 50 states)
- Jobs not generated due to limited housing investment, 2008-2025: 59.5% of current unemployed residents — 18th highest of the 50 states (222,498 total jobs)
- Loss of personal income due to limited housing investment, 2008-2025: $1,105 per resident — 17th least of the 50 states ($13.8 billion total)
- Median home list price in state: $425,000 (25th highest of the 50 states)
- Median list price per square foot in state: $259 (18th highest of the 50 states)
- Total active listings in state: 161,916
27. New Jersey

- Loss of economic output due to housing shortage, 2008-2025: 1.5% of annual GDP
- Total loss of economic output due to housing shortage, 2008-2025: $12.7 billion (11th most of the 50 states)
- Jobs not generated due to limited housing investment, 2008-2025: 42.3% of current unemployed residents — 14th lowest of the 50 states (93,907 total jobs)
- Loss of personal income due to limited housing investment, 2008-2025: $1,334 per resident — 15th most of the 50 states ($9.3 billion total)
- Median home list price in state: $557,000 (13th highest of the 50 states)
- Median list price per square foot in state: $305 (9th highest of the 50 states)
- Total active listings in state: 17,916
26. Maryland

- Loss of economic output due to housing shortage, 2008-2025: 1.5% of annual GDP
- Total loss of economic output due to housing shortage, 2008-2025: $8.2 billion (19th most of the 50 states)
- Jobs not generated due to limited housing investment, 2008-2025: 62.3% of current unemployed residents — 15th highest of the 50 states (61,359 total jobs)
- Loss of personal income due to limited housing investment, 2008-2025: $1,308 per resident — 20th most of the 50 states ($4.9 billion total)
- Median home list price in state: $443,950 (23rd highest of the 50 states)
- Median list price per square foot in state: $235 (21st highest of the 50 states)
- Total active listings in state: 15,023
25. Tennessee

- Loss of economic output due to housing shortage, 2008-2025: 1.5% of annual GDP
- Total loss of economic output due to housing shortage, 2008-2025: $8.4 billion (18th most of the 50 states)
- Jobs not generated due to limited housing investment, 2008-2025: 63.3% of current unemployed residents — 13th highest of the 50 states (74,301 total jobs)
- Loss of personal income due to limited housing investment, 2008-2025: $1,165 per resident — 22nd least of the 50 states ($5.4 billion total)
- Median home list price in state: $429,900 (24th highest of the 50 states)
- Median list price per square foot in state: $231 (23rd highest of the 50 states)
- Total active listings in state: 33,839
24. Georgia

- Loss of economic output due to housing shortage, 2008-2025: 1.5% of annual GDP
- Total loss of economic output due to housing shortage, 2008-2025: $13.3 billion (9th most of the 50 states)
- Jobs not generated due to limited housing investment, 2008-2025: 55.1% of current unemployed residents — 22nd highest of the 50 states (104,779 total jobs)
- Loss of personal income due to limited housing investment, 2008-2025: $1,187 per resident — 23rd least of the 50 states ($7.0 billion total)
- Median home list price in state: $394,995 (23rd lowest of the 50 states)
- Median list price per square foot in state: $189 (18th lowest of the 50 states)
- Total active listings in state: 48,796
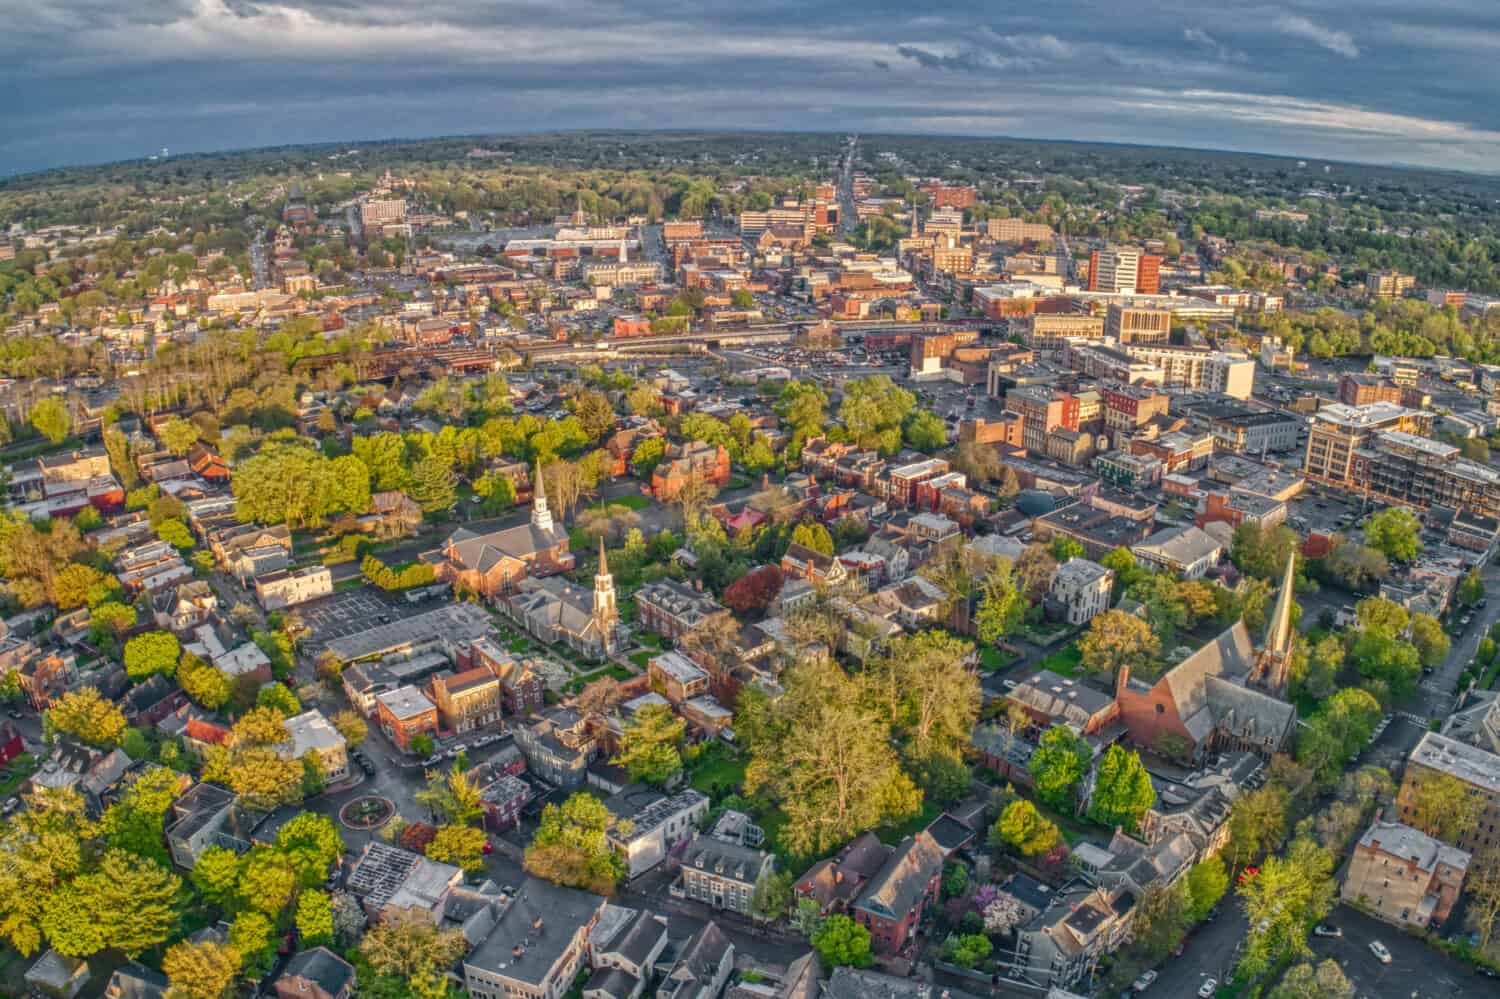
23. Vermont
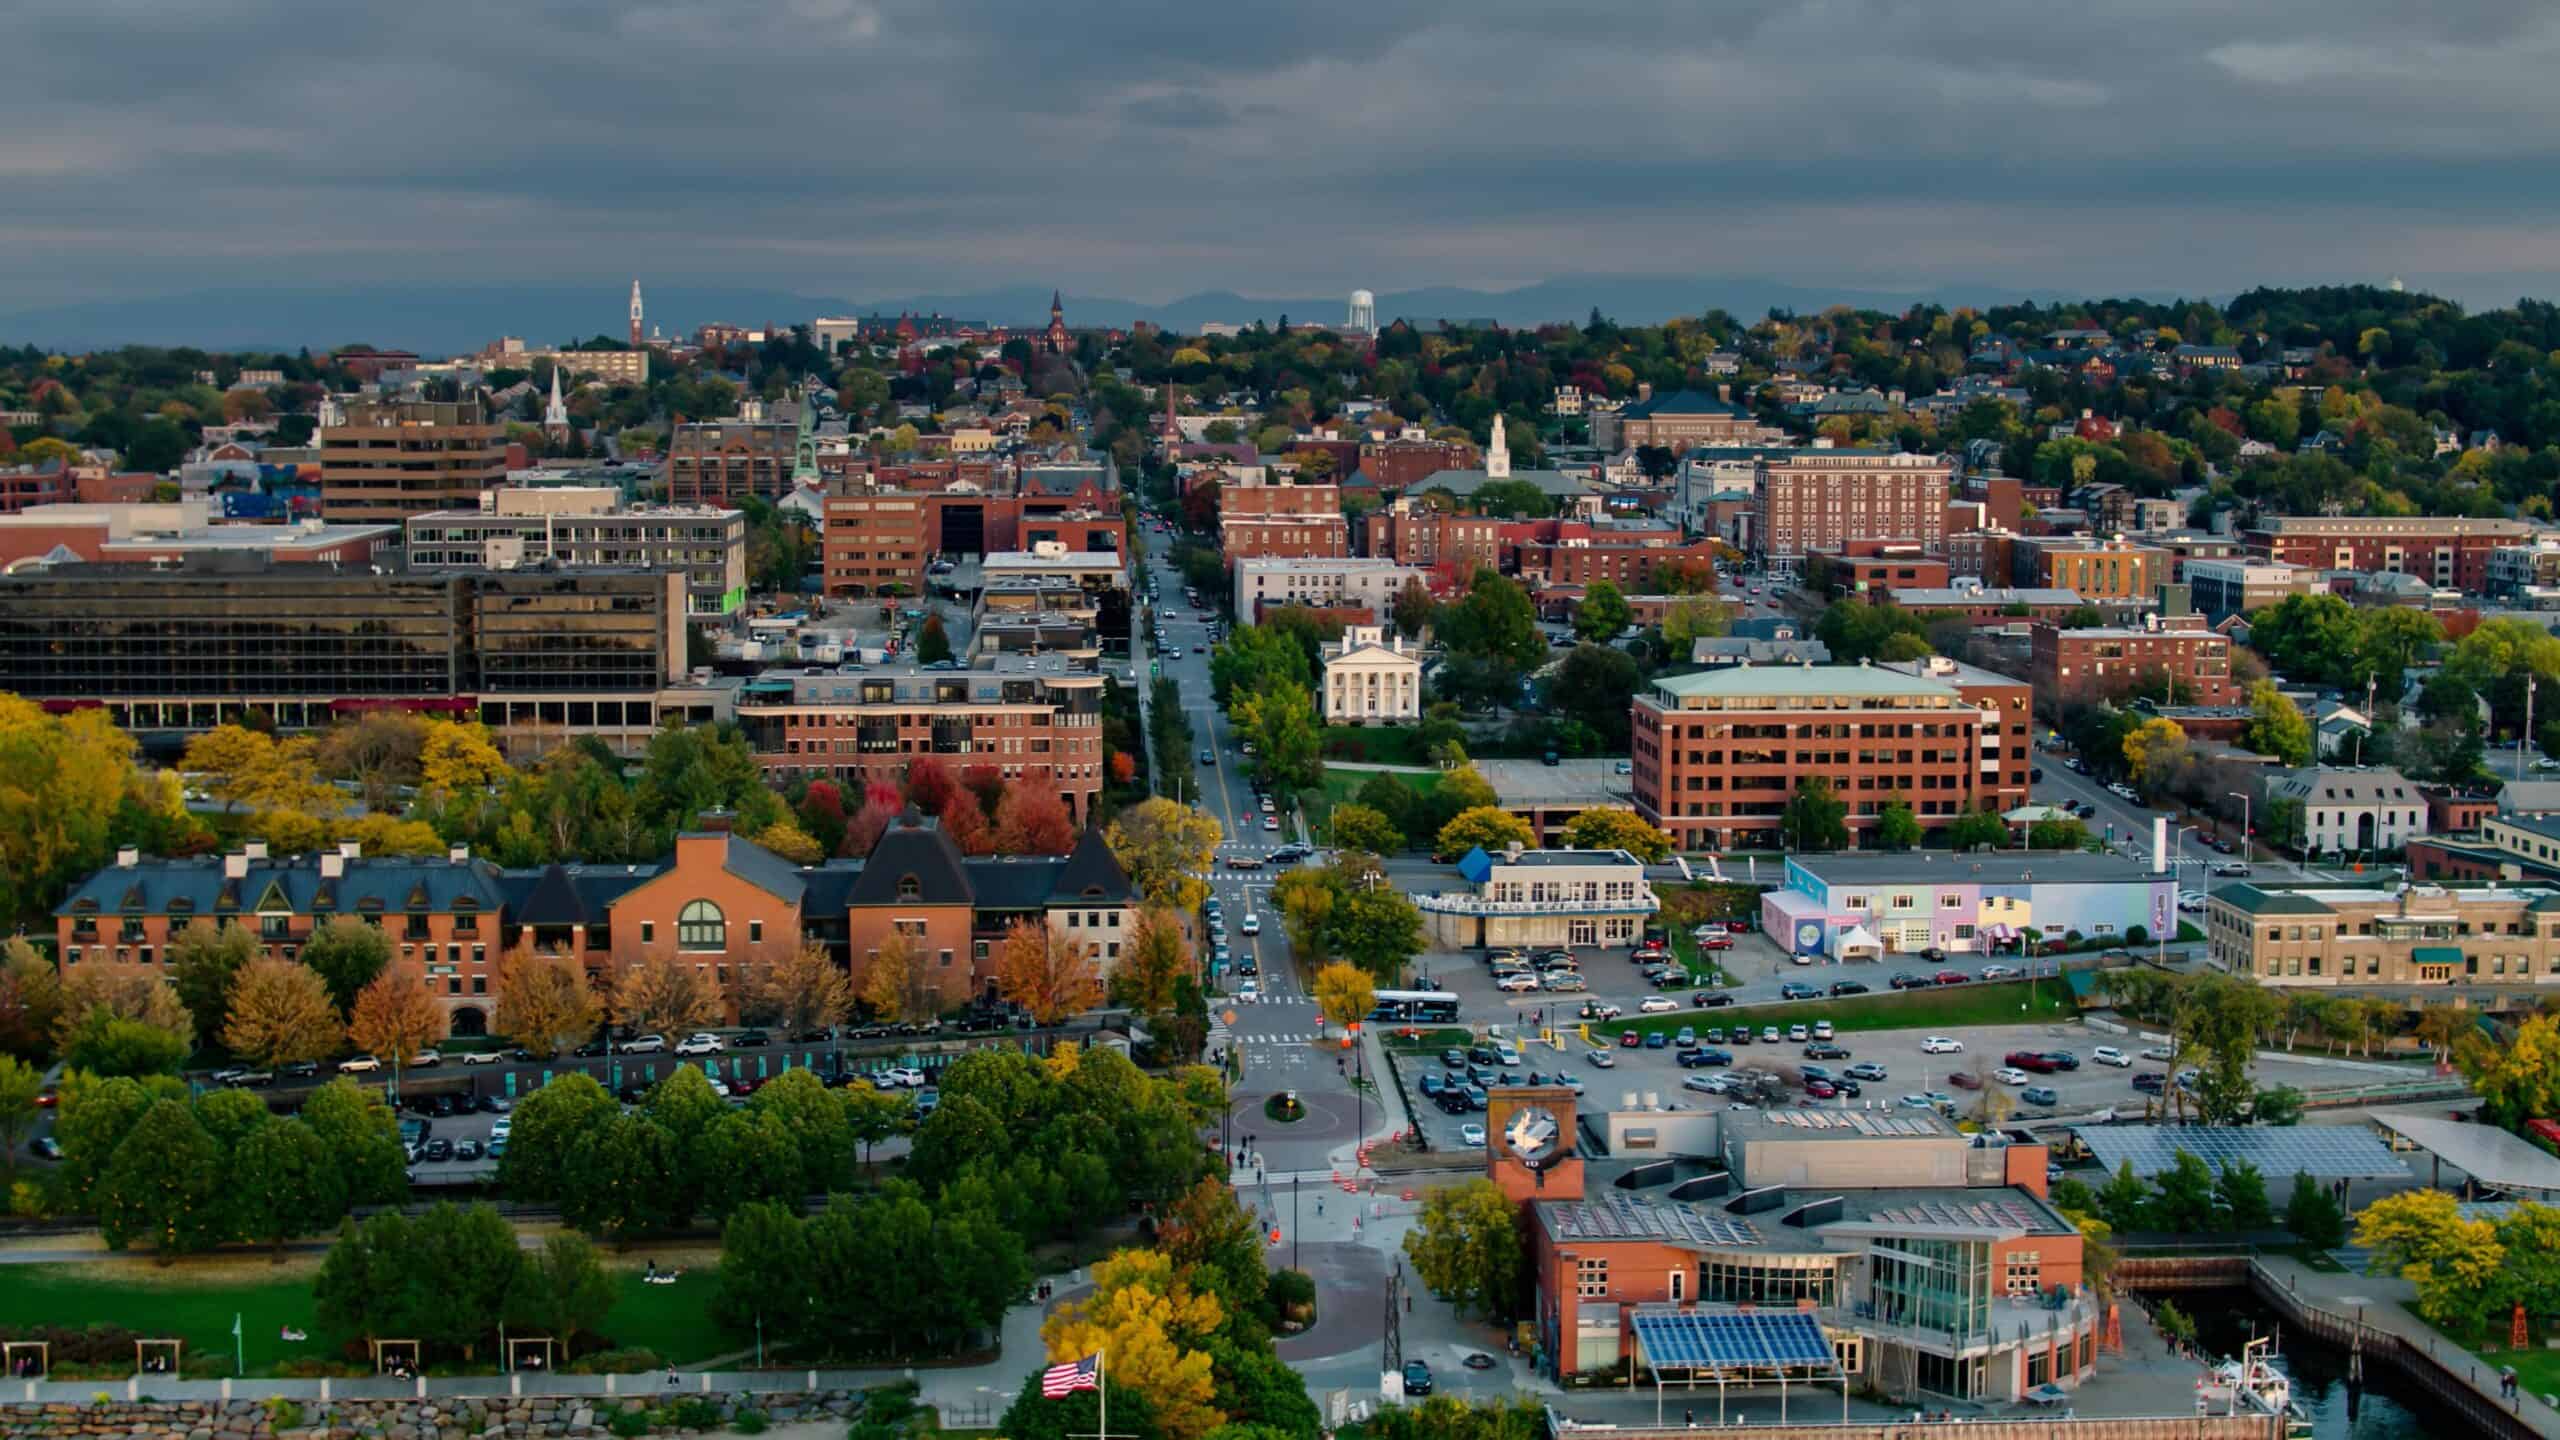
- Loss of economic output due to housing shortage, 2008-2025: 1.5% of annual GDP
- Total loss of economic output due to housing shortage, 2008-2025: $701.2 million (the least of the 50 states)
- Jobs not generated due to limited housing investment, 2008-2025: 82.9% of current unemployed residents — 4th highest of the 50 states (6,832 total jobs)
- Loss of personal income due to limited housing investment, 2008-2025: $1,081 per resident — 15th least of the 50 states ($423.0 million total)
- Median home list price in state: $504,450 (15th highest of the 50 states)
- Median list price per square foot in state: $265 (16th highest of the 50 states)
- Total active listings in state: 2,540
22. Maine

- Loss of economic output due to housing shortage, 2008-2025: 1.5% of annual GDP
- Total loss of economic output due to housing shortage, 2008-2025: $1.5 billion (10th least of the 50 states)
- Jobs not generated due to limited housing investment, 2008-2025: 63.8% of current unemployed residents — 12th highest of the 50 states (14,036 total jobs)
- Loss of personal income due to limited housing investment, 2008-2025: $1,073 per resident — 13th least of the 50 states ($869.2 million total)
- Median home list price in state: $467,000 (20th highest of the 50 states)
- Median list price per square foot in state: $285 (12th highest of the 50 states)
- Total active listings in state: 5,340
21. Indiana

- Loss of economic output due to housing shortage, 2008-2025: 1.5% of annual GDP
- Total loss of economic output due to housing shortage, 2008-2025: $7.9 billion (20th most of the 50 states)
- Jobs not generated due to limited housing investment, 2008-2025: 44.1% of current unemployed residents — 15th lowest of the 50 states (63,964 total jobs)
- Loss of personal income due to limited housing investment, 2008-2025: $1,142 per resident — 19th least of the 50 states ($4.6 billion total)
- Median home list price in state: $299,450 (8th lowest of the 50 states)
- Median list price per square foot in state: $157 (5th lowest of the 50 states)
- Total active listings in state: 17,092
20. Arizona

- Loss of economic output due to housing shortage, 2008-2025: 1.5% of annual GDP
- Total loss of economic output due to housing shortage, 2008-2025: $8.7 billion (17th most of the 50 states)
- Jobs not generated due to limited housing investment, 2008-2025: 51.4% of current unemployed residents — 25th highest of the 50 states (69,428 total jobs)
- Loss of personal income due to limited housing investment, 2008-2025: $1,152 per resident — 21st least of the 50 states ($4.8 billion total)
- Median home list price in state: $476,625 (18th highest of the 50 states)
- Median list price per square foot in state: $265 (16th highest of the 50 states)
- Total active listings in state: 27,635
19. Connecticut

- Loss of economic output due to housing shortage, 2008-2025: 1.5% of annual GDP
- Total loss of economic output due to housing shortage, 2008-2025: $5.5 billion (25th least of the 50 states)
- Jobs not generated due to limited housing investment, 2008-2025: 66.1% of current unemployed residents — 10th highest of the 50 states (40,844 total jobs)
- Loss of personal income due to limited housing investment, 2008-2025: $1,495 per resident — 11th most of the 50 states ($4.0 billion total)
- Median home list price in state: $525,225 (14th highest of the 50 states)
- Median list price per square foot in state: $275 (14th highest of the 50 states)
- Total active listings in state: 5,321
18. Rhode Island

- Loss of economic output due to housing shortage, 2008-2025: 1.6% of annual GDP
- Total loss of economic output due to housing shortage, 2008-2025: $1.3 billion (5th least of the 50 states)
- Jobs not generated due to limited housing investment, 2008-2025: 40.6% of current unemployed residents — 9th lowest of the 50 states (10,405 total jobs)
- Loss of personal income due to limited housing investment, 2008-2025: $1,124 per resident — 18th least of the 50 states ($870.1 million total)
- Median home list price in state: $584,142 (11th highest of the 50 states)
- Median list price per square foot in state: $333 (6th highest of the 50 states)
- Total active listings in state: 1,675
17. California

- Loss of economic output due to housing shortage, 2008-2025: 1.6% of annual GDP
- Total loss of economic output due to housing shortage, 2008-2025: $63.1 billion (the most of the 50 states)
- Jobs not generated due to limited housing investment, 2008-2025: 37.1% of current unemployed residents — 7th lowest of the 50 states (386,628 total jobs)
- Loss of personal income due to limited housing investment, 2008-2025: $1,601 per resident — 9th most of the 50 states ($35.9 billion total)
- Median home list price in state: $748,500 (3rd highest of the 50 states)
- Median list price per square foot in state: $460 (2nd highest of the 50 states)
- Total active listings in state: 74,140
16. Iowa

- Loss of economic output due to housing shortage, 2008-2025: 1.6% of annual GDP
- Total loss of economic output due to housing shortage, 2008-2025: $4.2 billion (21st least of the 50 states)
- Jobs not generated due to limited housing investment, 2008-2025: 61.9% of current unemployed residents — 16th highest of the 50 states (32,333 total jobs)
- Loss of personal income due to limited housing investment, 2008-2025: $1,305 per resident — 21st most of the 50 states ($2.2 billion total)
- Median home list price in state: $279,000 (3rd lowest of the 50 states)
- Median list price per square foot in state: $168 (11th lowest of the 50 states)
- Total active listings in state: 11,436
15. South Dakota

- Loss of economic output due to housing shortage, 2008-2025: 1.6% of annual GDP
- Total loss of economic output due to housing shortage, 2008-2025: $1.2 billion (4th least of the 50 states)
- Jobs not generated due to limited housing investment, 2008-2025: 108.8% of current unemployed residents — the highest of the 50 states (9,612 total jobs)
- Loss of personal income due to limited housing investment, 2008-2025: $1,332 per resident — 16th most of the 50 states ($658.6 million total)
- Median home list price in state: $373,350 (20th lowest of the 50 states)
- Median list price per square foot in state: $204 (22nd lowest of the 50 states)
- Total active listings in state: 3,567
14. Hawaii

- Loss of economic output due to housing shortage, 2008-2025: 1.6% of annual GDP
- Total loss of economic output due to housing shortage, 2008-2025: $1.9 billion (12th least of the 50 states)
- Jobs not generated due to limited housing investment, 2008-2025: 59.0% of current unemployed residents — 19th highest of the 50 states (11,935 total jobs)
- Loss of personal income due to limited housing investment, 2008-2025: $1,312 per resident — 18th most of the 50 states ($953.1 million total)
- Median home list price in state: $749,500 (2nd highest of the 50 states)
- Median list price per square foot in state: $698 (the highest of the 50 states)
- Total active listings in state: 6,027
13. North Dakota

- Loss of economic output due to housing shortage, 2008-2025: 1.6% of annual GDP
- Total loss of economic output due to housing shortage, 2008-2025: $1.3 billion (6th least of the 50 states)
- Jobs not generated due to limited housing investment, 2008-2025: 82.1% of current unemployed residents — 5th highest of the 50 states (8,514 total jobs)
- Loss of personal income due to limited housing investment, 2008-2025: $1,651 per resident — 8th most of the 50 states ($593.4 million total)
- Median home list price in state: $364,425 (17th lowest of the 50 states)
- Median list price per square foot in state: $164 (8th lowest of the 50 states)
- Total active listings in state: 2,259
12. Wisconsin

- Loss of economic output due to housing shortage, 2008-2025: 1.7% of annual GDP
- Total loss of economic output due to housing shortage, 2008-2025: $7.7 billion (21st most of the 50 states)
- Jobs not generated due to limited housing investment, 2008-2025: 65.5% of current unemployed residents — 11th highest of the 50 states (61,887 total jobs)
- Loss of personal income due to limited housing investment, 2008-2025: $1,297 per resident — 22nd most of the 50 states ($4.7 billion total)
- Median home list price in state: $392,325 (22nd lowest of the 50 states)
- Median list price per square foot in state: $214 (24th lowest of the 50 states)
- Total active listings in state: 13,190
11. Massachusetts

- Loss of economic output due to housing shortage, 2008-2025: 1.7% of annual GDP
- Total loss of economic output due to housing shortage, 2008-2025: $13.5 billion (8th most of the 50 states)
- Jobs not generated due to limited housing investment, 2008-2025: 58.0% of current unemployed residents — 20th highest of the 50 states (91,249 total jobs)
- Loss of personal income due to limited housing investment, 2008-2025: $1,897 per resident — the most of the 50 states ($8.8 billion total)
- Median home list price in state: $753,950 (the highest of the 50 states)
- Median list price per square foot in state: $430 (3rd highest of the 50 states)
- Total active listings in state: 11,826
10. Minnesota

- Loss of economic output due to housing shortage, 2008-2025: 1.7% of annual GDP
- Total loss of economic output due to housing shortage, 2008-2025: $8.9 billion (16th most of the 50 states)
- Jobs not generated due to limited housing investment, 2008-2025: 66.7% of current unemployed residents — 9th highest of the 50 states (62,932 total jobs)
- Loss of personal income due to limited housing investment, 2008-2025: $1,531 per resident — 10th most of the 50 states ($5.1 billion total)
- Median home list price in state: $389,000 (21st lowest of the 50 states)
- Median list price per square foot in state: $201 (20th lowest of the 50 states)
- Total active listings in state: 14,915
9. Washington

- Loss of economic output due to housing shortage, 2008-2025: 1.8% of annual GDP
- Total loss of economic output due to housing shortage, 2008-2025: $15.1 billion (6th most of the 50 states)
- Jobs not generated due to limited housing investment, 2008-2025: 47.5% of current unemployed residents — 20th lowest of the 50 states (86,379 total jobs)
- Loss of personal income due to limited housing investment, 2008-2025: $1,895 per resident — 2nd most of the 50 states ($8.1 billion total)
- Median home list price in state: $648,900 (5th highest of the 50 states)
- Median list price per square foot in state: $341 (5th highest of the 50 states)
- Total active listings in state: 24,463
8. Montana

- Loss of economic output due to housing shortage, 2008-2025: 1.8% of annual GDP
- Total loss of economic output due to housing shortage, 2008-2025: $1.4 billion (9th least of the 50 states)
- Jobs not generated due to limited housing investment, 2008-2025: 67.4% of current unemployed residents — 8th highest of the 50 states (11,536 total jobs)
- Loss of personal income due to limited housing investment, 2008-2025: $1,234 per resident — 25th most of the 50 states ($680.9 million total)
- Median home list price in state: $637,000 (6th highest of the 50 states)
- Median list price per square foot in state: $319 (7th highest of the 50 states)
- Total active listings in state: 6,178
7. Oregon

- Loss of economic output due to housing shortage, 2008-2025: 1.8% of annual GDP
- Total loss of economic output due to housing shortage, 2008-2025: $6.0 billion (24th most of the 50 states)
- Jobs not generated due to limited housing investment, 2008-2025: 47.9% of current unemployed residents — 21st lowest of the 50 states (43,977 total jobs)
- Loss of personal income due to limited housing investment, 2008-2025: $1,397 per resident — 13th most of the 50 states ($3.3 billion total)
- Median home list price in state: $566,000 (12th highest of the 50 states)
- Median list price per square foot in state: $305 (9th highest of the 50 states)
- Total active listings in state: 16,343
6. Idaho

- Loss of economic output due to housing shortage, 2008-2025: 1.9% of annual GDP
- Total loss of economic output due to housing shortage, 2008-2025: $2.5 billion (15th least of the 50 states)
- Jobs not generated due to limited housing investment, 2008-2025: 59.7% of current unemployed residents — 17th highest of the 50 states (21,910 total jobs)
- Loss of personal income due to limited housing investment, 2008-2025: $1,235 per resident — 24th most of the 50 states ($1.4 billion total)
- Median home list price in state: $585,225 (10th highest of the 50 states)
- Median list price per square foot in state: $286 (11th highest of the 50 states)
- Total active listings in state: 9,337
5. Colorado

- Loss of economic output due to housing shortage, 2008-2025: 1.9% of annual GDP
- Total loss of economic output due to housing shortage, 2008-2025: $10.8 billion (13th most of the 50 states)
- Jobs not generated due to limited housing investment, 2008-2025: 57.6% of current unemployed residents — 21st highest of the 50 states (80,374 total jobs)
- Loss of personal income due to limited housing investment, 2008-2025: $1,817 per resident — 4th most of the 50 states ($6.6 billion total)
- Median home list price in state: $587,000 (9th highest of the 50 states)
- Median list price per square foot in state: $285 (12th highest of the 50 states)
- Total active listings in state: 31,060
4. Wyoming
- Loss of economic output due to housing shortage, 2008-2025: 2.0% of annual GDP
- Total loss of economic output due to housing shortage, 2008-2025: $1.0 billion (2nd least of the 50 states)
- Jobs not generated due to limited housing investment, 2008-2025: 69.3% of current unemployed residents — 6th highest of the 50 states (6,654 total jobs)
- Loss of personal income due to limited housing investment, 2008-2025: $1,712 per resident — 6th most of the 50 states ($438.4 million total)
- Median home list price in state: $472,500 (19th highest of the 50 states)
- Median list price per square foot in state: $212 (23rd lowest of the 50 states)
- Total active listings in state: 2,833
3. New Hampshire

- Loss of economic output due to housing shortage, 2008-2025: 2.0% of annual GDP
- Total loss of economic output due to housing shortage, 2008-2025: $2.4 billion (14th least of the 50 states)
- Jobs not generated due to limited housing investment, 2008-2025: 100.7% of current unemployed residents — 2nd highest of the 50 states (20,083 total jobs)
- Loss of personal income due to limited housing investment, 2008-2025: $1,732 per resident — 5th most of the 50 states ($1.9 billion total)
- Median home list price in state: $592,450 (7th highest of the 50 states)
- Median list price per square foot in state: $312 (8th highest of the 50 states)
- Total active listings in state: 3,364
2. Nevada

- Loss of economic output due to housing shortage, 2008-2025: 2.1% of annual GDP
- Total loss of economic output due to housing shortage, 2008-2025: $5.5 billion (25th most of the 50 states)
- Jobs not generated due to limited housing investment, 2008-2025: 40.7% of current unemployed residents — 11th lowest of the 50 states (37,403 total jobs)
- Loss of personal income due to limited housing investment, 2008-2025: $1,690 per resident — 7th most of the 50 states ($2.7 billion total)
- Median home list price in state: $496,889 (16th highest of the 50 states)
- Median list price per square foot in state: $274 (15th highest of the 50 states)
- Total active listings in state: 13,356
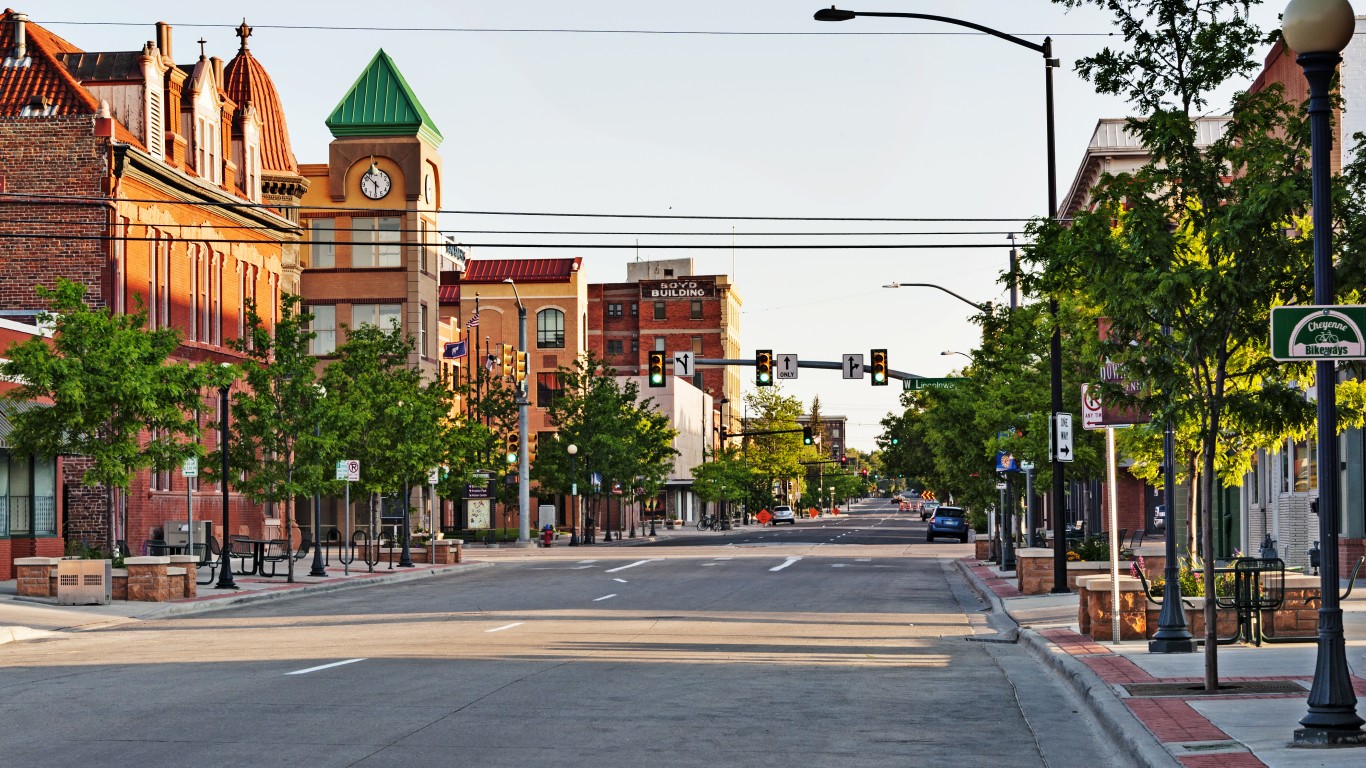
1. Utah

- Loss of economic output due to housing shortage, 2008-2025: 2.2% of annual GDP
- Total loss of economic output due to housing shortage, 2008-2025: $6.5 billion (23rd most of the 50 states)
- Jobs not generated due to limited housing investment, 2008-2025: 85.7% of current unemployed residents — 3rd highest of the 50 states (49,884 total jobs)
- Loss of personal income due to limited housing investment, 2008-2025: $1,856 per resident — 3rd most of the 50 states ($3.5 billion total)
- Median home list price in state: $590,000 (8th highest of the 50 states)
- Median list price per square foot in state: $254 (19th highest of the 50 states)
- Total active listings in state: 14,122
Contact [email protected] for any questions or corrections.