After declining for much of the second half of 2024, home prices are on the rise once again in the United States. As of March 2025, the most recent month of available data from Realtor.com, the typical home was listed on the market for $424,900, up 6% from the median list price in January 2025. Meanwhile, real wages for American workers climbed by only 0.1% in February of this year.
24/7 Wall St. Key Points:
- Supply constraints and growing demand have sent home prices surging in the U.S. in recent years.
- Income growth has not kept pace, and these dynamics have resulted in an affordability crisis — particularly in certain parts of the country.
- Also: Discover the next Nvidia
These numbers suggest that the ongoing housing affordability crisis in the United States is only getting worse, as home prices continue to rise far faster than incomes. These dynamics are compounded by historically high borrowing costs, as for the last two and a half years, the average rate on a 30 year fixed mortgage has exceeded 6% — a threshold not previously crossed in well over a decade.
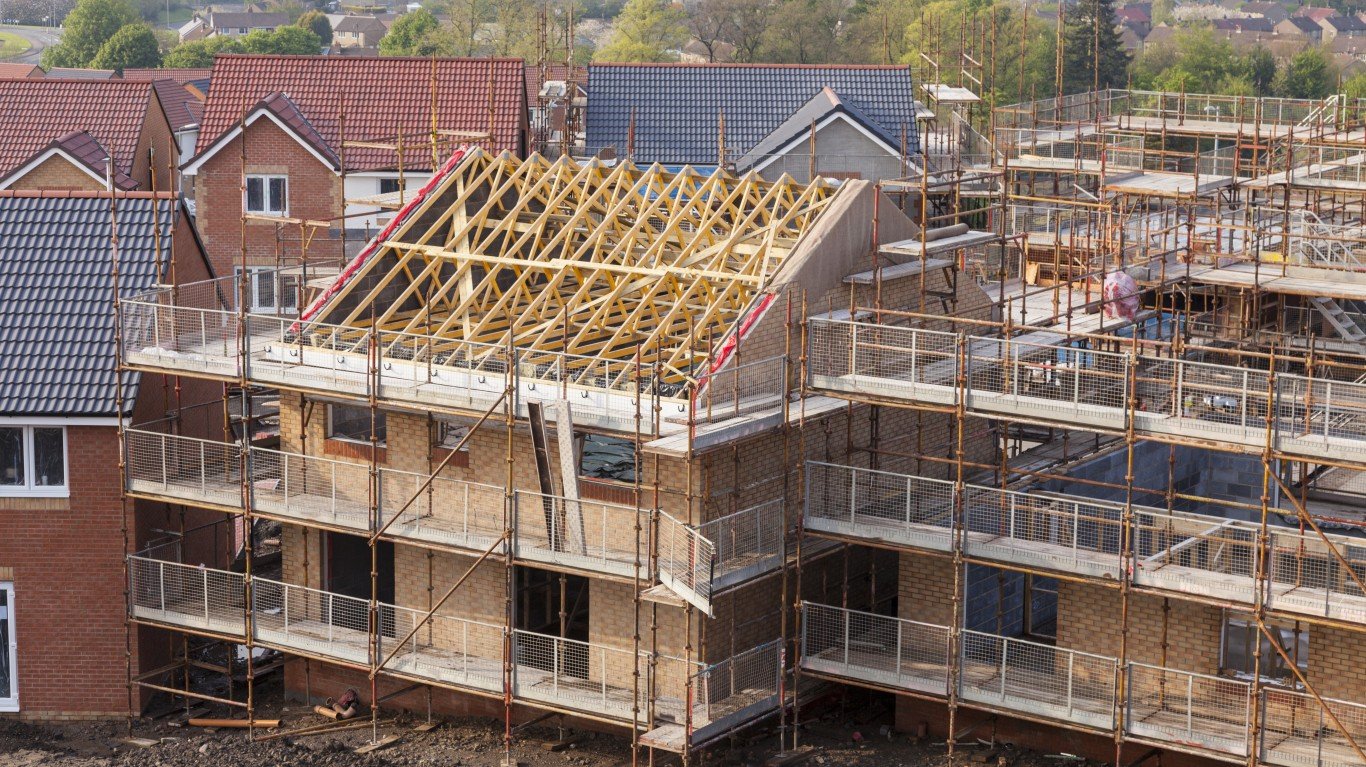
Underlying causes of the mismatch between incomes and home prices are varied, but a severe shortage of housing supply is a leading culprit. Fueled by zoning restrictions and high materials costs, new housing construction has not kept pace with demand, and partially as a result, the U.S. may have as many as 4.5 million fewer homes than it needs, according to some estimates.
Currently, the price of a typical home in the U.S. is 5.4 times higher than the median household income of $78,538 — and in certain parts of the country, the disparity between incomes and home prices is even more pronounced.
Using county-level data from Realtor.com, 24/7 Wall St. identified the least affordable housing market in each state. We reviewed the median list price in March 2025 for over 3,000 U.S. counties and county equivalents and calculated the local housing affordability ratio using five year estimates of median household income from the U.S. Census Bureau’s American Community Survey. To avoid statistical anomalies, only counties with at least 100 listed homes in March 2025 were considered.
Among the counties and county equivalents on this list, median list prices are anywhere from 4.9 to 42.9 times higher than the median household income. In every case, homes in these areas are less affordable than they are across the state as a whole. (Here is a look at the states with the highest foreclosure rates.)
Housing affordability is the product of two factors: income and home prices. As a result, even in wealthy areas, housing can be unaffordable if home prices are high enough. Similarly, a county with below average home prices can also be unaffordable if incomes are low enough. Notably, in the vast majority of counties on this list, not only are incomes lower than they are across the state as a whole, but home prices are also higher than they are statewide. (This is how Baby Boomers impacted the housing market for younger buyers.)
Why It Matters
Supply constraints and rising demand have given way to a housing affordability crisis in the United States. Not even considering historically high mortgage rates, the typical American home has a median list price that is over five times more than what the typical household earns in a year. Still, location matters when it comes to the housing market, and while housing has become less affordable virtually nationwide in recent years, in some parts of the country, the affordability crisis is especially pronounced.
Alabama: Winston County

- Median home price to income ratio: 12.8 to 1 (5.2 to 1 statewide)
- Median home list price in March 2025: $615,000 ($325,000 statewide)
- Median home list price per square foot: $295 ($166 statewide)
- Median household income: $48,032 ($62,027 statewide)
- 1-year change in median list price: -23.0% (-1.4% statewide)
- Listed homes in county, March 2025: 164
- Counties considered in state: 39
Alaska: Kenai Peninsula Borough

- Median home price to income ratio: 5.5 to 1 (4.8 to 1 statewide)
- Median home list price in March 2025: $425,000 ($429,000 statewide)
- Median home list price per square foot: $262 ($249 statewide)
- Median household income: $77,722 ($89,336 statewide)
- 1-year change in median list price: +6.5% (+7.3% statewide)
- Listed homes in borough, March 2025: 323
- County equivalents considered in state: 4
Arizona: Coconino County

- Median home price to income ratio: 10.7 to 1 (6.4 to 1 statewide)
- Median home list price in March 2025: $745,000 ($495,000 statewide)
- Median home list price per square foot: $403 ($269 statewide)
- Median household income: $69,748 ($76,872 statewide)
- 1-year change in median list price: -0.7% (-1.0% statewide)
- Listed homes in county, March 2025: 569
- Counties considered in state: 13
Arkansas: Carroll County

- Median home price to income ratio: 7.7 to 1 (5.0 to 1 statewide)
- Median home list price in March 2025: $425,000 ($295,000 statewide)
- Median home list price per square foot: $200 ($156 statewide)
- Median household income: $55,187 ($58,773 statewide)
- 1-year change in median list price: +1.4% (+0.0% statewide)
- Listed homes in county, March 2025: 194
- Counties considered in state: 33
California: Santa Barbara County

- Median home price to income ratio: 20.6 to 1 (7.8 to 1 statewide)
- Median home list price in March 2025: $1,975,000 ($749,900 statewide)
- Median home list price per square foot: $1,011 ($467 statewide)
- Median household income: $95,977 ($96,334 statewide)
- 1-year change in median list price: +1.3% (+0.0% statewide)
- Listed homes in county, March 2025: 704
- Counties considered in state: 52
Colorado: San Miguel County

- Median home price to income ratio: 42.9 to 1 (6.2 to 1 statewide)
- Median home list price in March 2025: $3,435,000 ($575,000 statewide)
- Median home list price per square foot: $1,700 ($291 statewide)
- Median household income: $80,117 ($92,470 statewide)
- 1-year change in median list price: -21.9% (-4.2% statewide)
- Listed homes in county, March 2025: 230
- Counties considered in state: 35
Connecticut: Western Connecticut Planning Region

- Median home price to income ratio: 8.0 to 1 (5.3 to 1 statewide)
- Median home list price in March 2025: $995,000 ($499,900 statewide)
- Median home list price per square foot: $433 ($291 statewide)
- Median household income: $124,553 ($93,760 statewide)
- 1-year change in median list price: -23.4% (-0.7% statewide)
- Listed homes in region, March 2025: 1,527
- Regions considered in state: 9
Delaware: Sussex County

- Median home price to income ratio: 7.0 to 1 (5.9 to 1 statewide)
- Median home list price in March 2025: $549,900 ($485,000 statewide)
- Median home list price per square foot: $260 ($238 statewide)
- Median household income: $78,162 ($82,855 statewide)
- 1-year change in median list price: -0.0% (-2.0% statewide)
- Listed homes in county, March 2025: 2,366
- Counties considered in state: 3
Florida: Monroe County

- Median home price to income ratio: 15.7 to 1 (6.1 to 1 statewide)
- Median home list price in March 2025: $1,295,000 ($439,000 statewide)
- Median home list price per square foot: $902 ($269 statewide)
- Median household income: $82,430 ($71,711 statewide)
- 1-year change in median list price: -4.1% (-3.5% statewide)
- Listed homes in county, March 2025: 1,862
- Counties considered in state: 53
Georgia: Fannin County

- Median home price to income ratio: 12.5 to 1 (5.2 to 1 statewide)
- Median home list price in March 2025: $724,900 ($389,000 statewide)
- Median home list price per square foot: $330 ($190 statewide)
- Median household income: $58,073 ($74,664 statewide)
- 1-year change in median list price: -9.3% (-0.2% statewide)
- Listed homes in county, March 2025: 623
- Counties considered in state: 79
Hawaii: Kauai County

- Median home price to income ratio: 15.0 to 1 (8.0 to 1 statewide)
- Median home list price in March 2025: $1,399,500 ($785,000 statewide)
- Median home list price per square foot: $1,005 ($723 statewide)
- Median household income: $93,612 ($98,317 statewide)
- 1-year change in median list price: -14.6% (-7.1% statewide)
- Listed homes in county, March 2025: 462
- Counties considered in state: 4
Idaho: Blaine County

- Median home price to income ratio: 27.9 to 1 (7.6 to 1 statewide)
- Median home list price in March 2025: $2,359,500 ($569,993 statewide)
- Median home list price per square foot: $1,073 ($281 statewide)
- Median household income: $84,470 ($74,636 statewide)
- 1-year change in median list price: +57.1% (+0.9% statewide)
- Listed homes in county, March 2025: 238
- Counties considered in state: 18
Illinois: DeKalb County

- Median home price to income ratio: 4.9 to 1 (3.7 to 1 statewide)
- Median home list price in March 2025: $337,990 ($299,984 statewide)
- Median home list price per square foot: $183 ($183 statewide)
- Median household income: $69,022 ($81,702 statewide)
- 1-year change in median list price: +0.9% (-5.3% statewide)
- Listed homes in county, March 2025: 220
- Counties considered in state: 37
Indiana: Tippecanoe County

- Median home price to income ratio: 7.0 to 1 (4.1 to 1 statewide)
- Median home list price in March 2025: $412,400 ($289,900 statewide)
- Median home list price per square foot: $179 ($156 statewide)
- Median household income: $58,622 ($70,051 statewide)
- 1-year change in median list price: +11.5% (-0.6% statewide)
- Listed homes in county, March 2025: 348
- Counties considered in state: 39
Iowa: Story County

- Median home price to income ratio: 5.8 to 1 (3.9 to 1 statewide)
- Median home list price in March 2025: $399,900 ($284,900 statewide)
- Median home list price per square foot: $255 ($174 statewide)
- Median household income: $69,006 ($73,147 statewide)
- 1-year change in median list price: +4.8% (-5.0% statewide)
- Listed homes in county, March 2025: 269
- Counties considered in state: 25
Kansas: Douglas County

- Median home price to income ratio: 6.1 to 1 (4.0 to 1 statewide)
- Median home list price in March 2025: $422,500 ($289,000 statewide)
- Median home list price per square foot: $208 ($152 statewide)
- Median household income: $68,756 ($72,639 statewide)
- 1-year change in median list price: +17.4% (-8.1% statewide)
- Listed homes in county, March 2025: 274
- Counties considered in state: 18
Kentucky: Calloway County

- Median home price to income ratio: 7.0 to 1 (4.8 to 1 statewide)
- Median home list price in March 2025: $361,250 ($300,000 statewide)
- Median home list price per square foot: $159 ($170 statewide)
- Median household income: $51,854 ($62,417 statewide)
- 1-year change in median list price: +5.6% (-1.3% statewide)
- Listed homes in county, March 2025: 110
- Counties considered in state: 36
Louisiana: De Soto Parish

- Median home price to income ratio: 8.0 to 1 (4.6 to 1 statewide)
- Median home list price in March 2025: $367,000 ($279,000 statewide)
- Median home list price per square foot: $169 ($153 statewide)
- Median household income: $46,077 ($60,023 statewide)
- 1-year change in median list price: +11.6% (+0.0% statewide)
- Listed homes in parish, March 2025: 102
- Parishes considered in state: 32
Maine: Lincoln County

- Median home price to income ratio: 8.7 to 1 (6.4 to 1 statewide)
- Median home list price in March 2025: $625,000 ($457,000 statewide)
- Median home list price per square foot: $347 ($289 statewide)
- Median household income: $72,026 ($71,773 statewide)
- 1-year change in median list price: +7.4% (+5.1% statewide)
- Listed homes in county, March 2025: 115
- Counties considered in state: 14
Maryland: Garrett County

- Median home price to income ratio: 9.8 to 1 (4.2 to 1 statewide)
- Median home list price in March 2025: $675,000 ($429,000 statewide)
- Median home list price per square foot: $317 ($236 statewide)
- Median household income: $69,031 ($101,652 statewide)
- 1-year change in median list price: -9.3% (+7.3% statewide)
- Listed homes in county, March 2025: 229
- Counties considered in state: 23
Massachusetts: Nantucket County

- Median home price to income ratio: 37.5 to 1 (7.9 to 1 statewide)
- Median home list price in March 2025: $4,495,000 ($798,000 statewide)
- Median home list price per square foot: $1,765 ($446 statewide)
- Median household income: $119,750 ($101,341 statewide)
- 1-year change in median list price: -5.4% (-0.2% statewide)
- Listed homes in county, March 2025: 106
- Counties considered in state: 13
Michigan: Emmet County

- Median home price to income ratio: 11.4 to 1 (3.9 to 1 statewide)
- Median home list price in March 2025: $839,750 ($275,000 statewide)
- Median home list price per square foot: $389 ($174 statewide)
- Median household income: $73,724 ($71,149 statewide)
- 1-year change in median list price: +46.0% (+0.0% statewide)
- Listed homes in county, March 2025: 168
- Counties considered in state: 52
Minnesota: Cass County

- Median home price to income ratio: 7.3 to 1 (4.6 to 1 statewide)
- Median home list price in March 2025: $475,000 ($399,000 statewide)
- Median home list price per square foot: $256 ($205 statewide)
- Median household income: $64,937 ($87,556 statewide)
- 1-year change in median list price: +1.3% (-0.2% statewide)
- Listed homes in county, March 2025: 159
- Counties considered in state: 29
Mississippi: Lafayette County

- Median home price to income ratio: 9.1 to 1 (5.3 to 1 statewide)
- Median home list price in March 2025: $585,000 ($291,650 statewide)
- Median home list price per square foot: $271 ($147 statewide)
- Median household income: $64,334 ($54,915 statewide)
- 1-year change in median list price: +8.4% (+2.3% statewide)
- Listed homes in county, March 2025: 432
- Counties considered in state: 24
Missouri: Morgan County

- Median home price to income ratio: 7.0 to 1 (4.3 to 1 statewide)
- Median home list price in March 2025: $349,450 ($299,500 statewide)
- Median home list price per square foot: $220 ($172 statewide)
- Median household income: $49,663 ($68,920 statewide)
- 1-year change in median list price: -12.5% (+0.2% statewide)
- Listed homes in county, March 2025: 162
- Counties considered in state: 46
Montana: Lake County

- Median home price to income ratio: 12.9 to 1 (8.9 to 1 statewide)
- Median home list price in March 2025: $799,000 ($624,000 statewide)
- Median home list price per square foot: $364 ($318 statewide)
- Median household income: $61,965 ($69,922 statewide)
- 1-year change in median list price: -8.7% (-0.2% statewide)
- Listed homes in county, March 2025: 180
- Counties considered in state: 12
Nebraska: Lancaster County

- Median home price to income ratio: 5.7 to 1 (4.7 to 1 statewide)
- Median home list price in March 2025: $411,995 ($350,000 statewide)
- Median home list price per square foot: $181 ($174 statewide)
- Median household income: $72,625 ($74,985 statewide)
- 1-year change in median list price: +0.5% (-2.2% statewide)
- Listed homes in county, March 2025: 1,129
- Counties considered in state: 9
Nevada: Douglas County

- Median home price to income ratio: 11.2 to 1 (6.4 to 1 statewide)
- Median home list price in March 2025: $987,000 ($485,000 statewide)
- Median home list price per square foot: $453 ($276 statewide)
- Median household income: $88,018 ($75,561 statewide)
- 1-year change in median list price: +22.5% (-0.4% statewide)
- Listed homes in county, March 2025: 359
- Counties considered in state: 7
New Hampshire: Carroll County
- Median home price to income ratio: 7.3 to 1 (6.1 to 1 statewide)
- Median home list price in March 2025: $604,925 ($585,000 statewide)
- Median home list price per square foot: $322 ($314 statewide)
- Median household income: $82,961 ($95,628 statewide)
- 1-year change in median list price: +13.2% (+2.0% statewide)
- Listed homes in county, March 2025: 270
- Counties considered in state: 10
New Jersey: Cape May County

- Median home price to income ratio: 9.6 to 1 (5.4 to 1 statewide)
- Median home list price in March 2025: $849,000 ($550,000 statewide)
- Median home list price per square foot: $674 ($308 statewide)
- Median household income: $88,046 ($101,050 statewide)
- 1-year change in median list price: -7.7% (+0.2% statewide)
- Listed homes in county, March 2025: 1,270
- Counties considered in state: 21
New Mexico: Taos County

- Median home price to income ratio: 10.2 to 1 (6.3 to 1 statewide)
- Median home list price in March 2025: $599,000 ($390,410 statewide)
- Median home list price per square foot: $352 ($206 statewide)
- Median household income: $58,908 ($62,125 statewide)
- 1-year change in median list price: -7.9% (+1.4% statewide)
- Listed homes in county, March 2025: 251
- Counties considered in state: 16
New York: New York County

- Median home price to income ratio: 14.6 to 1 (8.3 to 1 statewide)
- Median home list price in March 2025: $1,525,000 ($699,000 statewide)
- Median home list price per square foot: $1,508 ($437 statewide)
- Median household income: $104,553 ($84,578 statewide)
- 1-year change in median list price: -9.3% (+2.0% statewide)
- Listed homes in county, March 2025: 8,020
- Counties considered in state: 52
North Carolina: Jackson County

- Median home price to income ratio: 15.0 to 1 (5.7 to 1 statewide)
- Median home list price in March 2025: $800,000 ($400,000 statewide)
- Median home list price per square foot: $311 ($220 statewide)
- Median household income: $53,479 ($69,904 statewide)
- 1-year change in median list price: -4.7% (+0.0% statewide)
- Listed homes in county, March 2025: 327
- Counties considered in state: 77
North Dakota: Burleigh County

- Median home price to income ratio: 5.6 to 1 (4.9 to 1 statewide)
- Median home list price in March 2025: $479,900 ($369,900 statewide)
- Median home list price per square foot: $204 ($170 statewide)
- Median household income: $84,948 ($75,949 statewide)
- 1-year change in median list price: +4.4% (+5.7% statewide)
- Listed homes in county, March 2025: 345
- Counties considered in state: 6
Ohio: Ottawa County

- Median home price to income ratio: 6.0 to 1 (3.9 to 1 statewide)
- Median home list price in March 2025: $454,500 ($269,000 statewide)
- Median home list price per square foot: $321 ($162 statewide)
- Median household income: $75,728 ($69,680 statewide)
- 1-year change in median list price: -7.1% (+3.5% statewide)
- Listed homes in county, March 2025: 203
- Counties considered in state: 54
Oklahoma: McCurtain County

- Median home price to income ratio: 13.0 to 1 (4.7 to 1 statewide)
- Median home list price in March 2025: $650,000 ($299,900 statewide)
- Median home list price per square foot: $374 ($164 statewide)
- Median household income: $50,175 ($63,603 statewide)
- 1-year change in median list price: -7.0% (+0.6% statewide)
- Listed homes in county, March 2025: 633
- Counties considered in state: 40
Oregon: Lincoln County

- Median home price to income ratio: 9.5 to 1 (7.0 to 1 statewide)
- Median home list price in March 2025: $583,900 ($564,000 statewide)
- Median home list price per square foot: $351 ($309 statewide)
- Median household income: $61,314 ($80,426 statewide)
- 1-year change in median list price: -1.7% (+2.6% statewide)
- Listed homes in county, March 2025: 510
- Counties considered in state: 25
Pennsylvania: Wayne County

- Median home price to income ratio: 5.8 to 1 (3.9 to 1 statewide)
- Median home list price in March 2025: $359,950 ($299,999 statewide)
- Median home list price per square foot: $191 ($189 statewide)
- Median household income: $62,182 ($76,081 statewide)
- 1-year change in median list price: -0.0% (+0.3% statewide)
- Listed homes in county, March 2025: 279
- Counties considered in state: 47
Rhode Island: Washington County

- Median home price to income ratio: 8.9 to 1 (6.3 to 1 statewide)
- Median home list price in March 2025: $915,000 ($539,900 statewide)
- Median home list price per square foot: $521 ($324 statewide)
- Median household income: $102,478 ($86,372 statewide)
- 1-year change in median list price: +22.0% (+10.4% statewide)
- Listed homes in county, March 2025: 339
- Counties considered in state: 4
South Carolina: Charleston County

- Median home price to income ratio: 8.9 to 1 (5.4 to 1 statewide)
- Median home list price in March 2025: $749,900 ($360,000 statewide)
- Median home list price per square foot: $413 ($204 statewide)
- Median household income: $84,320 ($66,818 statewide)
- 1-year change in median list price: -14.5% (+2.9% statewide)
- Listed homes in county, March 2025: 2,667
- Counties considered in state: 32
South Dakota: Lawrence County

- Median home price to income ratio: 12.9 to 1 (5.3 to 1 statewide)
- Median home list price in March 2025: $864,000 ($382,128 statewide)
- Median home list price per square foot: $314 ($212 statewide)
- Median household income: $66,766 ($72,421 statewide)
- 1-year change in median list price: +4.2% (+0.8% statewide)
- Listed homes in county, March 2025: 208
- Counties considered in state: 6
Tennessee: Sevier County

- Median home price to income ratio: 10.6 to 1 (6.4 to 1 statewide)
- Median home list price in March 2025: $675,000 ($427,400 statewide)
- Median home list price per square foot: $379 ($231 statewide)
- Median household income: $63,829 ($67,097 statewide)
- 1-year change in median list price: -3.6% (-1.8% statewide)
- Listed homes in county, March 2025: 1,984
- Counties considered in state: 63
Texas: Gillespie County

- Median home price to income ratio: 12.3 to 1 (4.8 to 1 statewide)
- Median home list price in March 2025: $832,000 ($364,900 statewide)
- Median home list price per square foot: $410 ($186 statewide)
- Median household income: $67,799 ($76,292 statewide)
- 1-year change in median list price: +0.6% (-0.0% statewide)
- Listed homes in county, March 2025: 469
- Counties considered in state: 124
Utah: Summit County

- Median home price to income ratio: 14.4 to 1 (6.4 to 1 statewide)
- Median home list price in March 2025: $1,975,000 ($589,990 statewide)
- Median home list price per square foot: $914 ($259 statewide)
- Median household income: $137,058 ($91,750 statewide)
- 1-year change in median list price: +14.5% (-1.7% statewide)
- Listed homes in county, March 2025: 931
- Counties considered in state: 17
Vermont: Bennington County

- Median home price to income ratio: 9.6 to 1 (6.4 to 1 statewide)
- Median home list price in March 2025: $687,000 ($499,900 statewide)
- Median home list price per square foot: $266 ($266 statewide)
- Median household income: $71,494 ($78,024 statewide)
- 1-year change in median list price: -5.2% (+4.4% statewide)
- Listed homes in county, March 2025: 152
- Counties considered in state: 9
Virginia: Northampton County

- Median home price to income ratio: 11.0 to 1 (4.9 to 1 statewide)
- Median home list price in March 2025: $613,450 ($449,000 statewide)
- Median home list price per square foot: $317 ($231 statewide)
- Median household income: $55,933 ($90,974 statewide)
- 1-year change in median list price: +12.8% (+4.3% statewide)
- Listed homes in county, March 2025: 135
- Counties considered in state: 63
Washington: San Juan County

- Median home price to income ratio: 15.8 to 1 (6.6 to 1 statewide)
- Median home list price in March 2025: $1,325,000 ($629,997 statewide)
- Median home list price per square foot: $667 ($343 statewide)
- Median household income: $83,682 ($94,952 statewide)
- 1-year change in median list price: +10.4% (+0.0% statewide)
- Listed homes in county, March 2025: 112
- Counties considered in state: 29
West Virginia: Greenbrier County

- Median home price to income ratio: 6.7 to 1 (4.5 to 1 statewide)
- Median home list price in March 2025: $325,000 ($259,000 statewide)
- Median home list price per square foot: $176 ($144 statewide)
- Median household income: $48,662 ($57,917 statewide)
- 1-year change in median list price: +8.5% (+8.4% statewide)
- Listed homes in county, March 2025: 132
- Counties considered in state: 15
Wisconsin: Vilas County

- Median home price to income ratio: 7.4 to 1 (5.1 to 1 statewide)
- Median home list price in March 2025: $495,000 ($385,450 statewide)
- Median home list price per square foot: $313 ($214 statewide)
- Median household income: $67,132 ($75,670 statewide)
- 1-year change in median list price: +0.8% (+1.5% statewide)
- Listed homes in county, March 2025: 129
- Counties considered in state: 36
Wyoming: Teton County

- Median home price to income ratio: 29.7 to 1 (6.1 to 1 statewide)
- Median home list price in March 2025: $3,350,000 ($459,900 statewide)
- Median home list price per square foot: $1,544 ($208 statewide)
- Median household income: $112,681 ($74,815 statewide)
- 1-year change in median list price: +24.5% (+2.4% statewide)
- Listed homes in county, March 2025: 194
- Counties considered in state: 9
Contact [email protected] for any questions or corrections.