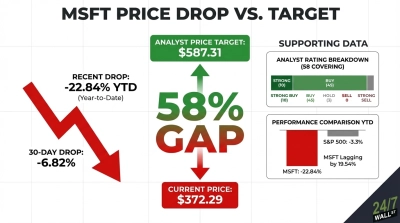
Microsoft (NASDAQ: MSFT | MSFT Price Prediction) was last seen trading near $373, while the average analyst price target sits at $587.31. That gap exceeds 57%, a dislocation that demands explanation. The stock has shed 22.8% year-to-date, falling from $484.35 at the start of the year. When a company of this scale trades this far below where 57 analysts think it belongs, the question is whether the market or Wall Street is right.
Microsoft operates across cloud infrastructure, enterprise software, gaming, and artificial intelligence (AI) services. Its Azure platform is one of the most strategically important assets in global technology, and its OpenAI partnership has made it the default infrastructure layer for the AI buildout. The selloff is the story.
Macro Pressure and Capex Anxiety Drove the Decline
The decline is rooted in capital intensity rather than earnings failure. Microsoft has beaten EPS estimates in each of the past four quarters, with surprises ranging from +7.25% to +12.8%. Revenue grew 16.7% year-over-year in the most recent quarter to $81.27 billion. Azure grew 39% year-over-year. None of those numbers explain the pullback.
Capex jumped 89% year-over-year to $29.88 billion in Q2 FY2026 alone, nearly doubling from the prior quarter. Full-year FY2025 capex reached $64.55 billion, up 45.13%. Free cash flow for FY2025 fell 3.32% to $71.61 billion. A reported hiring freeze in cloud and sales groups and broader big-tech sector rotation round out the narrative, even without an earnings miss.
The S&P 500 is down 3.8% year-to-date. Microsoft’s dramatic underperformance suggests pressure that is at least partly company-specific, tied to AI investment skepticism and concerns about the return timeline on massive infrastructure spending.
Analysts Are Betting the AI Infrastructure Payoff Is Real
Wall Street has not flinched. Of 58 analysts covering Microsoft, 55 rate it a Buy or Strong Buy, with zero Sell or Strong Sell ratings. The bull thesis centers on one number: the commercial remaining performance obligation surged 110% year-over-year to $625 billion in Q2 FY2026. That is committed future revenue analysts believe the market is dramatically undervaluing.
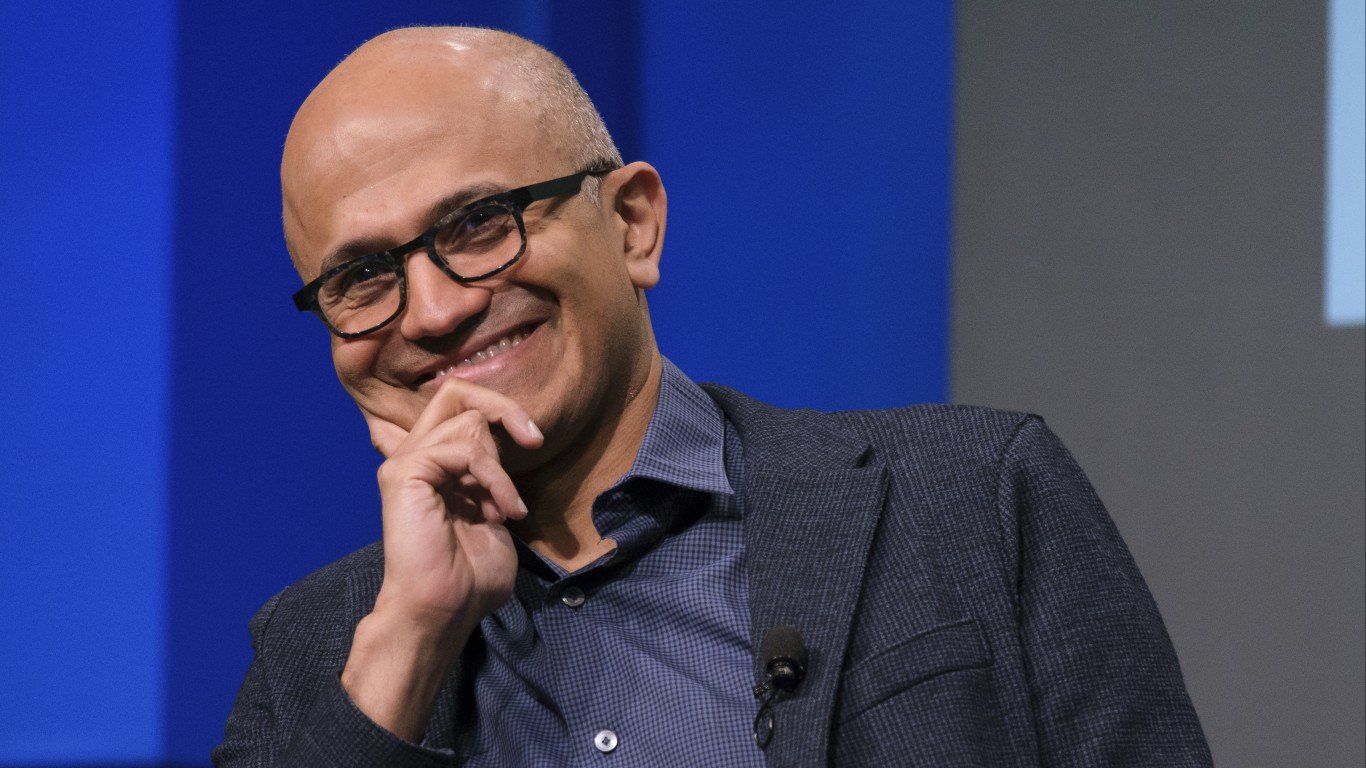
Azure forward guidance calls for 37% to 38% growth next quarter, and the OpenAI partnership restructuring added an incremental $250 billion in contracted Azure purchases. CEO Satya Nadella stated on the most recent earnings call: “We are only at the beginning phases of AI diffusion and already Microsoft has built an AI business that is larger than some of our biggest franchises.” Analysts appear to believe him.
Where Things Stand
- Current Price: $373.46
- Average Analyst Target: $587.31
- Implied Upside: over 57%
- Analysts Covering: 58
- Strong Buy / Buy / Hold / Sell: 10 / 45 / 3 / 0
- MSFT YTD: −22.8%
- S&P 500 YTD: −3.8%
- 52-Week Low: $344.79
- Trailing P/E: 23x
The analyst consensus is unusually strong. A 58-analyst coverage universe with near-unanimous Buy ratings and zero Sells reflects genuine institutional conviction. That said, analyst price targets represent a 12-month view built on assumptions that can shift quickly if Azure growth decelerates or capex returns disappoint.
The Risk/Reward Is Compelling, With Real Dangers Attached
Microsoft becomes compelling if the capex cycle is approaching its peak and the $625 billion cRPO backlog begins converting to recognized revenue at scale. A trailing P/E of 23x on a company growing revenue at 16.7% with 39% profit margin and $12.7 billion returned to shareholders in a single quarter is a genuinely different valuation than this stock has offered in years.
The bear case: Capex keeps climbing, free cash flow stays compressed, and the AI revenue ramp takes longer than the $587 target implies. OpenAI losses hit $3.1 billion in Q1 FY2026 alone. If those losses grow while Azure growth ticks down from 39% toward the guided 37% to 38%, multiple compression has room to run. Retail sentiment is split, with threads titled “Microsoft freefall” alongside posts describing it as deeply undervalued at 52-week lows. The backlog size and analyst conviction lean bull, but the capex trajectory needs to stabilize before the bull case becomes high-conviction.