U.S. gasoline prices climbed above $4 a gallon again, up 30% since late February as Middle East tensions disrupted oil routes. Electric vehicle demand has slowed, and broader markets show their own technical stress. Against that backdrop, Tesla (NASDAQ:TSLA | TSLA Price Prediction) shares slipped into familiar territory this week.
The 50-day simple moving average crossed below the 200-day simple moving average, with the stock trading near $345 per share. Traders label this a “death cross” and treat it as a bearish momentum shift. But for long-term investors, does it warrant action, or is it just a chart statistic? Let’s break it down with the data.
What the Death Cross Actually Means for Traders
The death cross forms when the 50-day SMA falls below the 200-day SMA. Chart watchers see it as evidence that short-term price action has weakened against the longer trend, often preceding additional declines. In Tesla’s case, the latest trigger arrived after shares had already dropped from 2025 peaks, with the 50-day SMA now near $357 and the 200-day near $382.
Simply put, this is a lagging pattern. It confirms a downtrend already in motion rather than forecasting new weakness. In 2022, Tesla also saw a death cross instance, one that unfolded inside a broad market sell-off driven by inflation and rate hikes, not Tesla-specific failures alone. That context matters: death crosses rarely isolate one stock when macro forces dominate.
History Delivers Mixed Results — And a Clear Lesson
This week’s death cross move marks the third death cross in recent memory, and outcomes have varied.
- May 2022: The 50-day crossed below the 200-day early in a bear market. Shares fell as much as 54% before bottoming in January 2023.
- February 2024: The pattern formed again, but shares stayed flat over the next month, then rose 15% over the following six months.
- April 2025: The 50-day crossed at $288.76 versus the 200-day at $290.60; another down leg followed before the current signal.
Broader forces shaped each episode—the 2022 cross coincided with the S&P 500’s own bearish signals. In 2024, inflation, oil, Federal Reserve interest policies, and the looming presidential election all played a role. Of course, Tesla had its own issues: the first annual sales decline in over a decade and price cuts to remain competitive. Last year, trade tariffs and concerns about the economy contributed to a broad market crash. The chart pattern never acted as a reliable sell trigger in isolation.
It is why I don’t worry about these indicators. As a buy-and-hold investor focused on the long game, short-term technicals register as background noise. Had anyone sold right after the May 2022 death cross, for example, they would have missed Tesla’s subsequent 62% run higher before the latest downturn began. The data shows the real cost of reacting to lagging signals.
Growth Catalysts That Matter More Than Any Chart
Tesla’s future rests on execution, not moving averages. The company continues to advance artificial intelligence and robotics through its Optimus platform and Full Self-Driving software. Autonomous vehicle progress remains central to its strategy, with robotaxi ambitions on the horizon. Tesla is also becoming a key player in energy infrastructure.
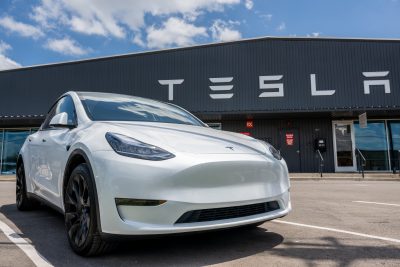
Fresh momentum could arrive from a rumored new model. Reuters reported yesterday Tesla is in early development of an all-new compact electric SUV — shorter than the Model Y, built in China, and priced below the Model 3’s $37,000 U.S. entry point. The vehicle targets a smaller battery, single motor, and lighter weight to hit lower price points while expanding volume.
Even $4.15 per gallon regular gasoline nationwide could rekindle EV interest among cost-conscious drivers. Higher fuel prices have historically lifted demand for alternatives, and Tesla’s cost-focused lineup positions it to benefit if that pattern repeats.
Key Takeaway
The death cross confirms what has already happened — a downtrend — not what comes next. For buy-and-hold investors, it carries no actionable weight. Stay focused on the tangible drivers: AI and robotics leadership, autonomous tech rollout, and the new affordable SUV in the pipeline.
When all is said and done, those fundamentals, not lagging chart patterns, determine long-term results. Tune out the noise, keep your horizon in view, and let the data — not fear — guide your investment decisions.
Contact [email protected] for any questions or corrections.