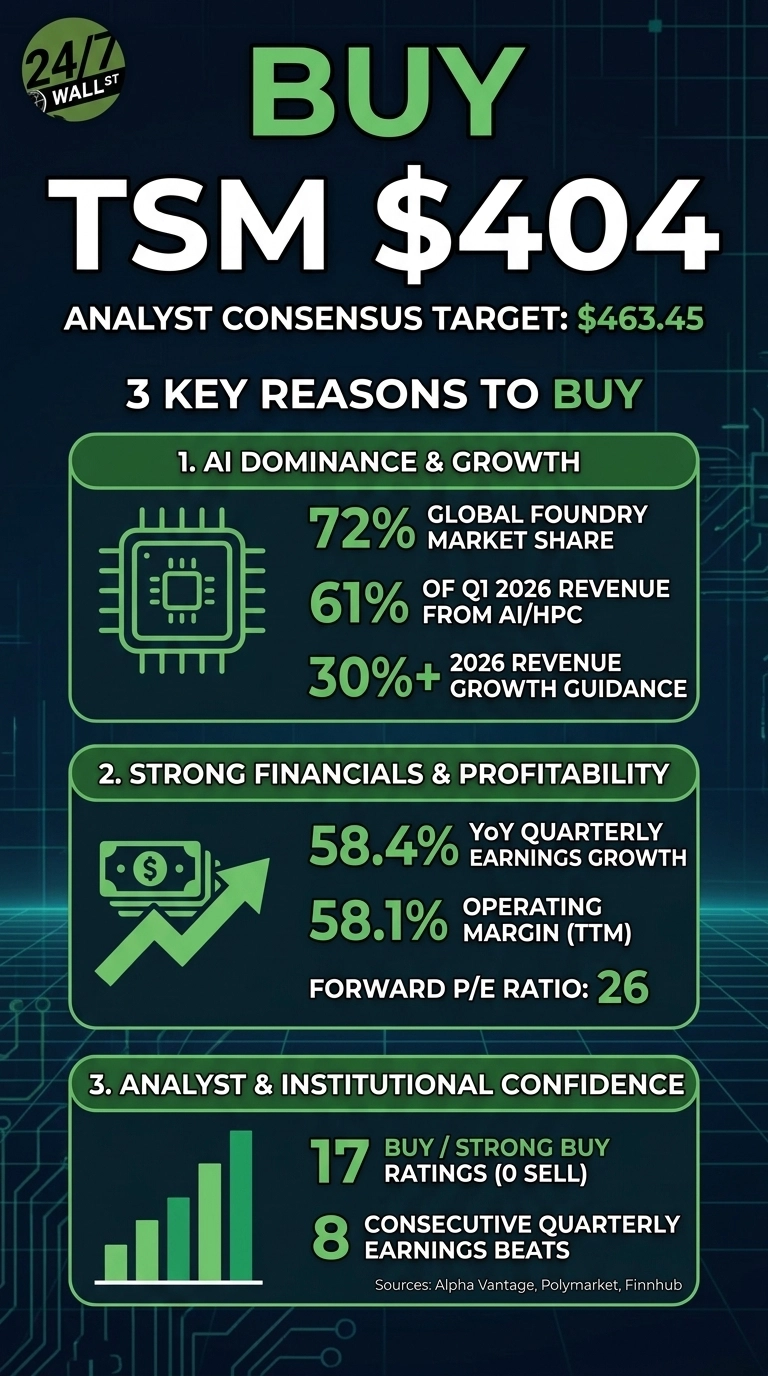
At $394, Taiwan Semiconductor Manufacturing (NYSE:TSM | TSM Price Prediction) screens favorably. The world’s largest contract chipmaker raised full-year guidance at a price still below the average Wall Street target, combining momentum with unfinished upside.
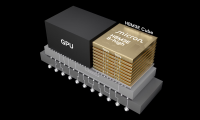
TSMC fabricates the most advanced chips for leading AI and consumer technology customers. It controls a 72% share of the global foundry market and powers nearly every cutting-edge AI accelerator shipping today. The stock rallied 108.21% over the past year as AI capex orders piled up, then cooled slightly in May after a brief push toward overbought territory.
Q1 2026 results, reported on April 15, 2026, drove the latest leg higher. EPS came in at $3.49 versus a $3.22 estimate, the eighth straight beat. Management raised 2026 revenue growth guidance to over 30%.
Why the AI build-out keeps refilling the order book
Structural demand anchors the bull case. AI and HPC chips generated 61% of Q1 2026 revenue, and management cited a major hyperscaler order $150 billion AI data center buildout plus a new joint venture in Kumamoto as locked-in volume for coming years. April 2026 monthly revenue rose 17.5% year over year.
Profitability backs the story. Operating margin runs at 58.1%, return on equity at 36.2%, and quarterly earnings grew 58.4% year over year. A forward P/E of 26 with a PEG of 1.28 looks reasonable for the dominant supplier in tech’s highest-growth category.
Why valuation and Taiwan risk still matter
The bear case centers on concentration. TSMC accounts for over 40% of the Taiwan Taiex, and any cross-strait escalation cuts through the global chip supply chain. A Simply Wall St DCF pegs fair value at $215.69, implying the stock trades roughly 82% above that estimate.
Institutional flows are mixed. Sands Capital trimmed 963,490 shares, First Eagle cut 761,000 shares, and Spear Holdings reduced 99.3% of its position. MACD has rolled over, with the histogram at -0.9953 after a bearish crossover on May 11 and 12, signaling cooled near-term momentum.
Why patience has merit
The hold view rests on price action that has already done substantial work. TSM is up 26.06% year to date and 263.49% over five years. The 50-day moving average sits at $367.59, leaving room for a pullback before the trend breaks.
Waiting for either a dip toward the 50-day or confirmation that Q2 revenue tracks the $40.2 billion guidance lets investors size positions with more clarity, especially with RSI at 56.30 giving no edge.
What the numbers say at $404
TSM trades at $404 against a consensus analyst target of $463.45, implying roughly 15% upside. The analyst target breakdown is unusually one-sided:
- Strong Buy: 5
- Buy: 12
- Hold: 2
- Sell: 0
Trailing P/E sits at 35 on TTM EPS of $11.65. TSM’s 26.06% year-to-date gain compares with roughly a modest advance for the S&P 500, meaningful outperformance even after May’s choppiness.
The bottom line: AI scale at a reasonable forward multiple
At $404, the data leans constructive for Taiwan Semiconductor.
If TSMC delivers on 30%+ revenue growth in 2026 and Q2 lands near the $40.2 billion guide with gross margin in the 65.5% to 67.5% range, the analyst target near $463 becomes the floor of a wider range running to $490.
Risk/reward is favorable because the forward multiple of 26 looks reasonable for a business compounding earnings at 58.4% year over year with 58.1% operating margins and a 72% share of the only foundry capacity that matters for AI. Capacity additions in Arizona, Kumamoto, and Germany reduce the long-running Taiwan concentration discount.

The thesis breaks if AI capex from hyperscalers slows materially, if Q2 monthly revenue prints turn negative year over year, or if cross-strait tensions escalate beyond rhetoric. Watch monthly revenue releases, gross margin direction, and any sign that Apple’s chip diversification is moving from rumor to reality.
TSMC is the cheapest way to own the AI build cycle through its highest-margin layer, and $404 leaves room to ride that compounding higher.
Contact [email protected] for any questions or corrections.