The iShares MSCI Taiwan ETF (NYSEARCA:EWT) has done something most country funds rarely do: it has more than doubled in a year. Shares closed near $103 on May 29, up 103% over the past 12 months and 62% year to date, with a 18% push in May alone. After a run like that, the relevant question for EWT holders is what could now break the trade.
What EWT actually owns right now
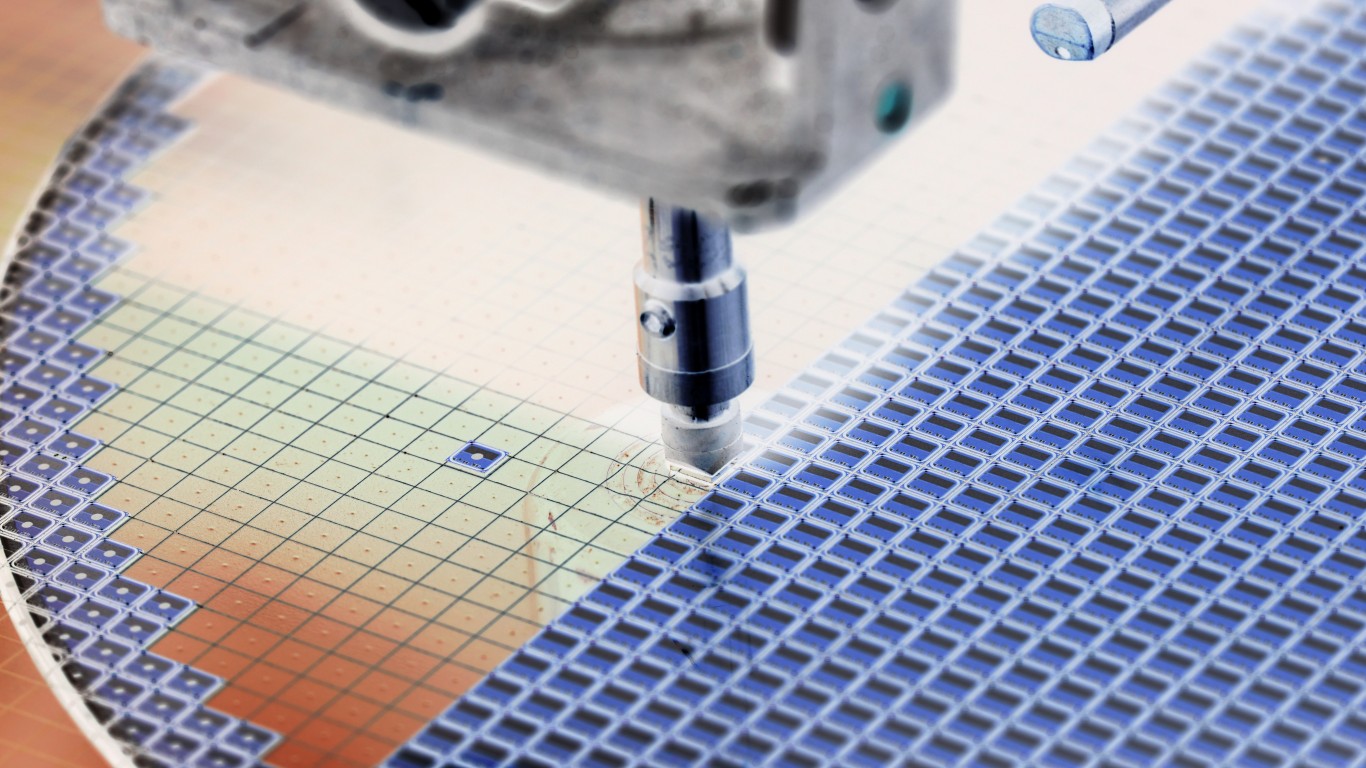
EWT is a $6.1 billion single-country fund that gives U.S. investors direct exposure to large- and mid-cap Taiwanese equities, charging a 0.59% net expense ratio. The portfolio is dominated by the AI hardware supply chain: Taiwan Semiconductor, Hon Hai (Foxconn), MediaTek, Delta Electronics, and Quanta Computer together account for roughly 38% of net assets, with a handful of Taiwanese financials filling out most of the rest. That is the lens through which every macro variable below should be read.
The macro factor: the 10-year Treasury and the dollar
The single macro variable with the most direct path into EWT over the next 12 months is the U.S. 10-year Treasury yield, because of what it does to the dollar against the Taiwan dollar. The 10-year sits at 4.45%, in the 91st percentile of its 12-month range and well above the 3.97% low set in late February. Yields recently peaked at 4.67% on May 19 before easing.
Here is the transmission mechanism EWT holders need to understand. EWT prices Taiwanese shares in dollars, so a stronger U.S. dollar mechanically drags on NAV even when the underlying stocks are flat in Taipei. J.P. Morgan attributes roughly 7 percentage points of 2025’s international-equity outperformance to dollar weakness. If the 10-year breaks back above the May peak of 4.67% on a sticky inflation reading, that tailwind reverses fast. Watch the BLS CPI release and the Treasury’s daily yield curve page monthly, and the CME FedWatch tool around each FOMC meeting.
The yield-curve spread is the secondary signal. The 10Y-2Y stands at 0.47%, compressed from a February high of 0.74%. A flatter curve historically cools the risk-on sentiment EM country funds depend on.
The fund-specific factor: how much of EWT is really just TSMC
EWT is functionally a leveraged bet on Taiwan Semiconductor. TSMC alone is roughly 22% of net assets, and TSMC’s ADRs are up 115% over the past year and 38% year to date through May 29. Add MediaTek, Hon Hai, Delta, and Quanta, and well over a third of the fund tracks the AI capex cycle through one supply chain.
A 10% drawdown in TSMC, on a guidance cut or a tariff headline, would shave roughly 2 percentage points off EWT’s NAV before any contagion to the other AI suppliers, which would almost certainly move with it. The two events to circle are TSMC’s quarterly earnings (the next report and capex guide is the cleanest read on AI hardware demand) and any U.S. Section 232 semiconductor tariff action. Investors who want broader AI hardware exposure without the single-name concentration can compare EWT against iShares Semiconductor ETF (NASDAQ:SOXX), which spreads risk across the global chip complex.
What to watch from here
The actionable signals are narrow. If the U.S. 10-year yield closes above 4.67% on a hotter-than-expected CPI print, expect dollar strength to start eating into EWT’s NAV regardless of what Taipei does. And if TSMC’s next earnings report cuts 2026 capex guidance or trims its AI revenue outlook, more than a fifth of EWT moves immediately, and most of the rest follows.
Contact [email protected] for any questions or corrections.