Which Airline Stock Is Dominating in 2026: United, American, or Delta?
Three major airlines flew the same turbulent skies in 2026, yet their stock performance landed in completely different places. The reason comes down to one structural advantage that only one carrier built into its business model before fuel prices started…

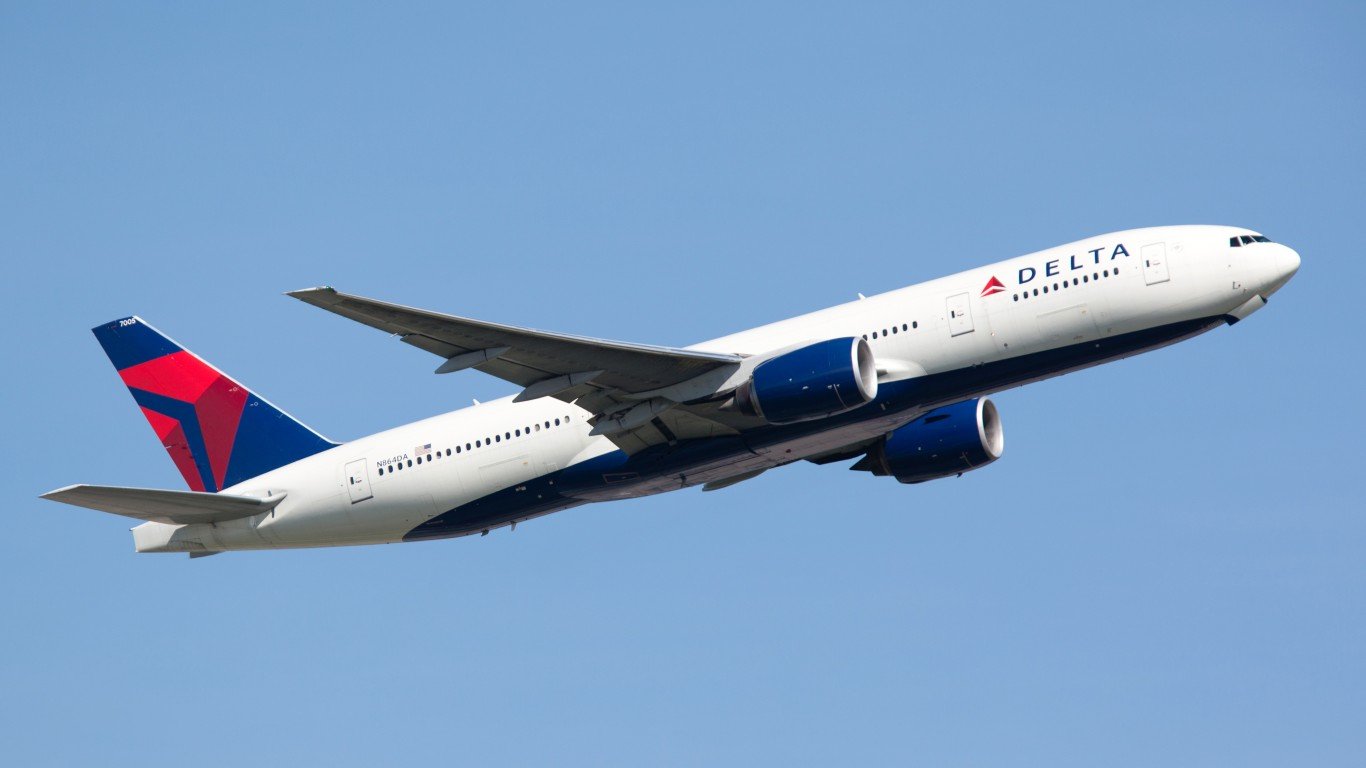
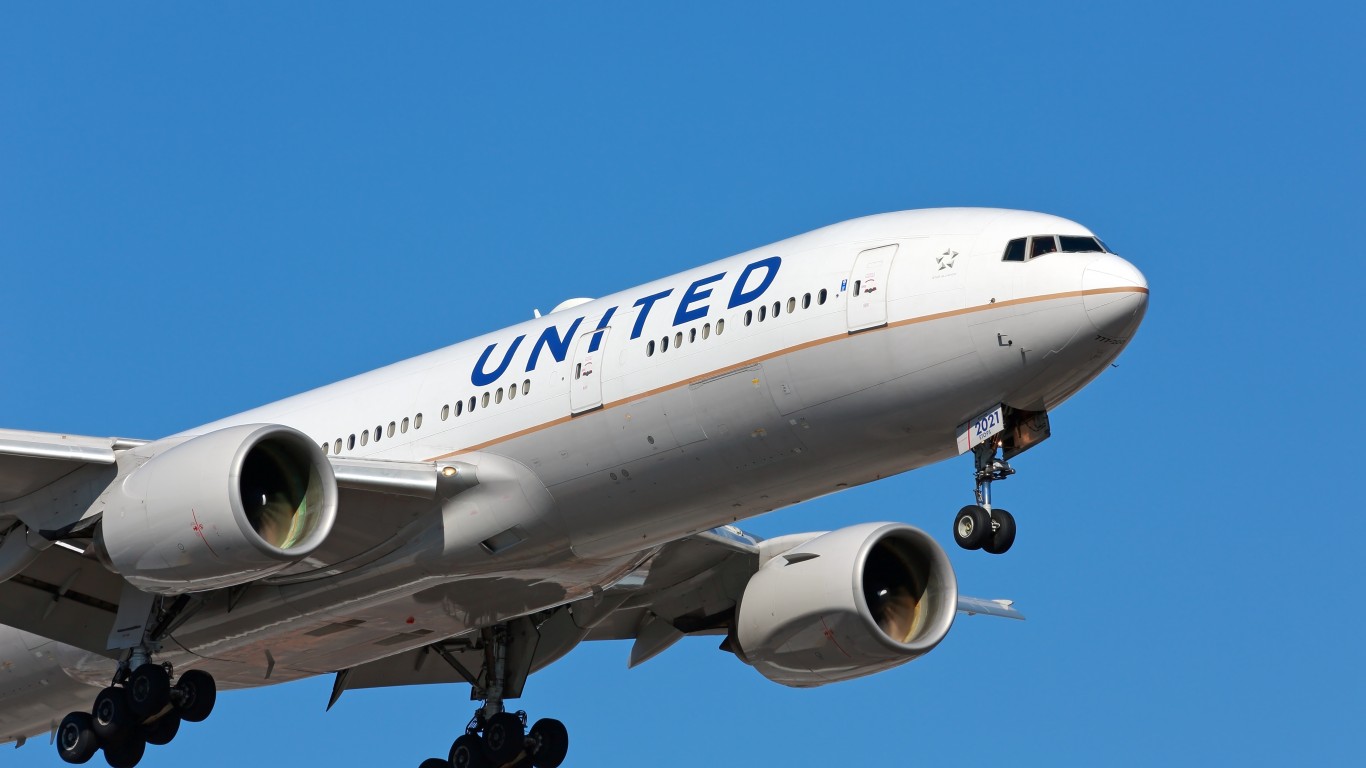
The 2026 airline ranking tells a single story about how much of each carrier’s business sits outside the seat, and Delta has won the year by a wide margin. Delta Air Lines (NYSE:DAL | DAL Price Prediction) stock is up 16% year to date (YTD) at $80.86. United Airlines (NASDAQ:UAL) stock is flat YTD at $111.27.
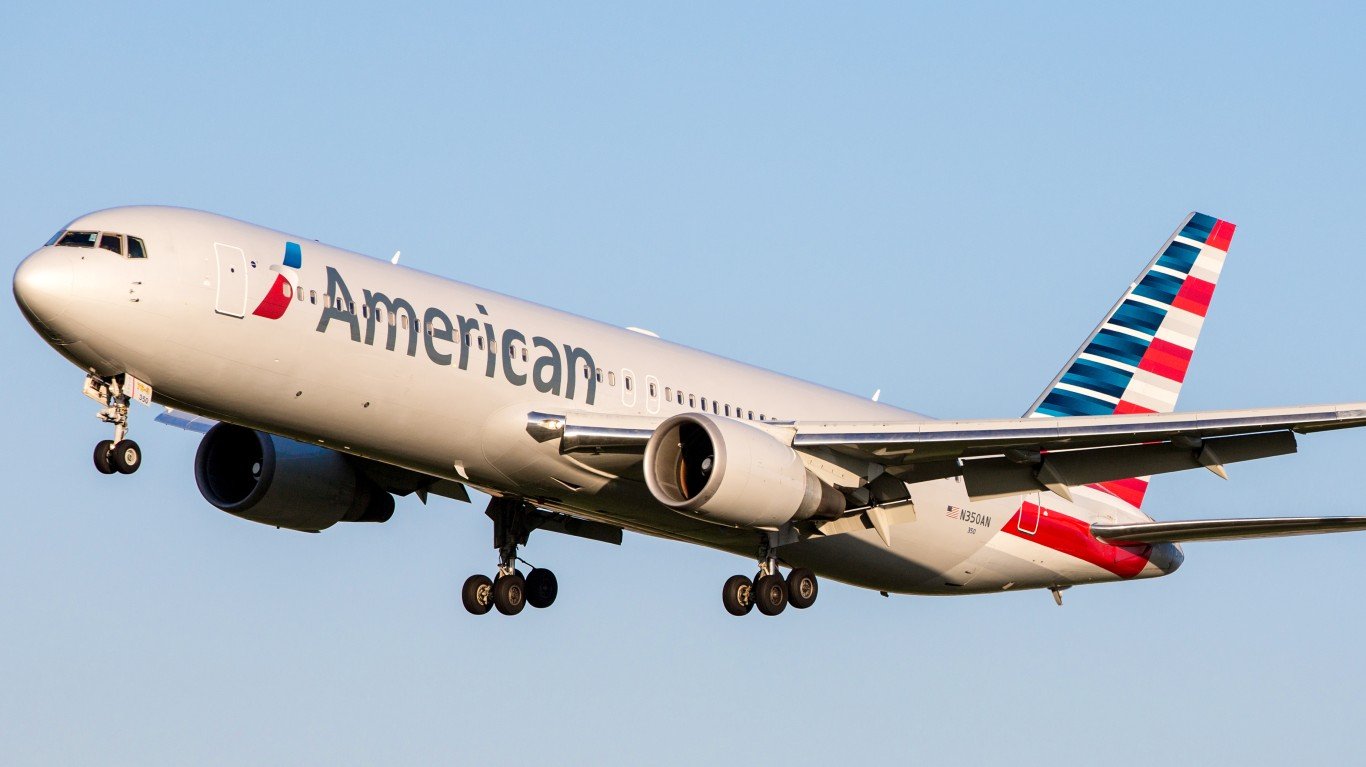
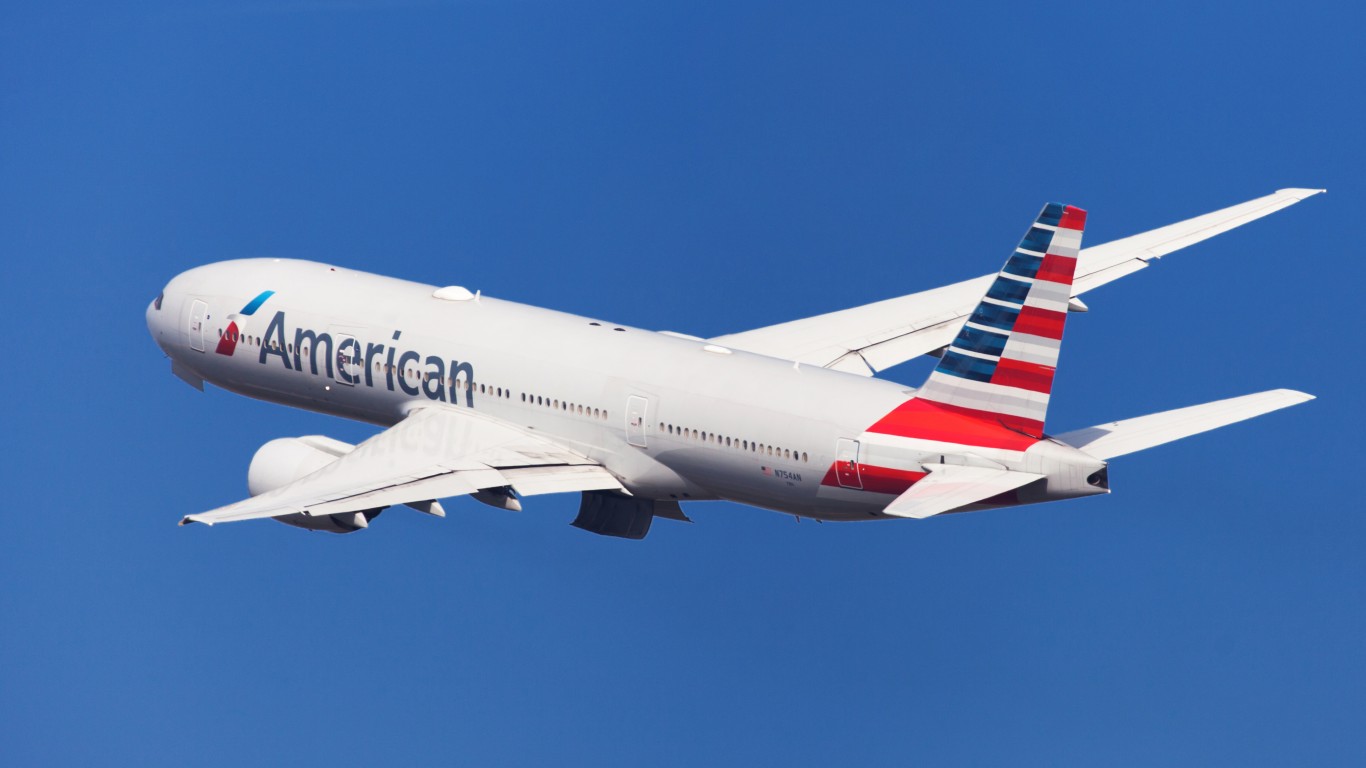
American Airlines Group (NASDAQ:AAL) stock is down 12% YTD at $13.49, the only major U.S. carrier in the red this year. That spread tracks how exposed each airline is to ticket revenue and to the crude price.
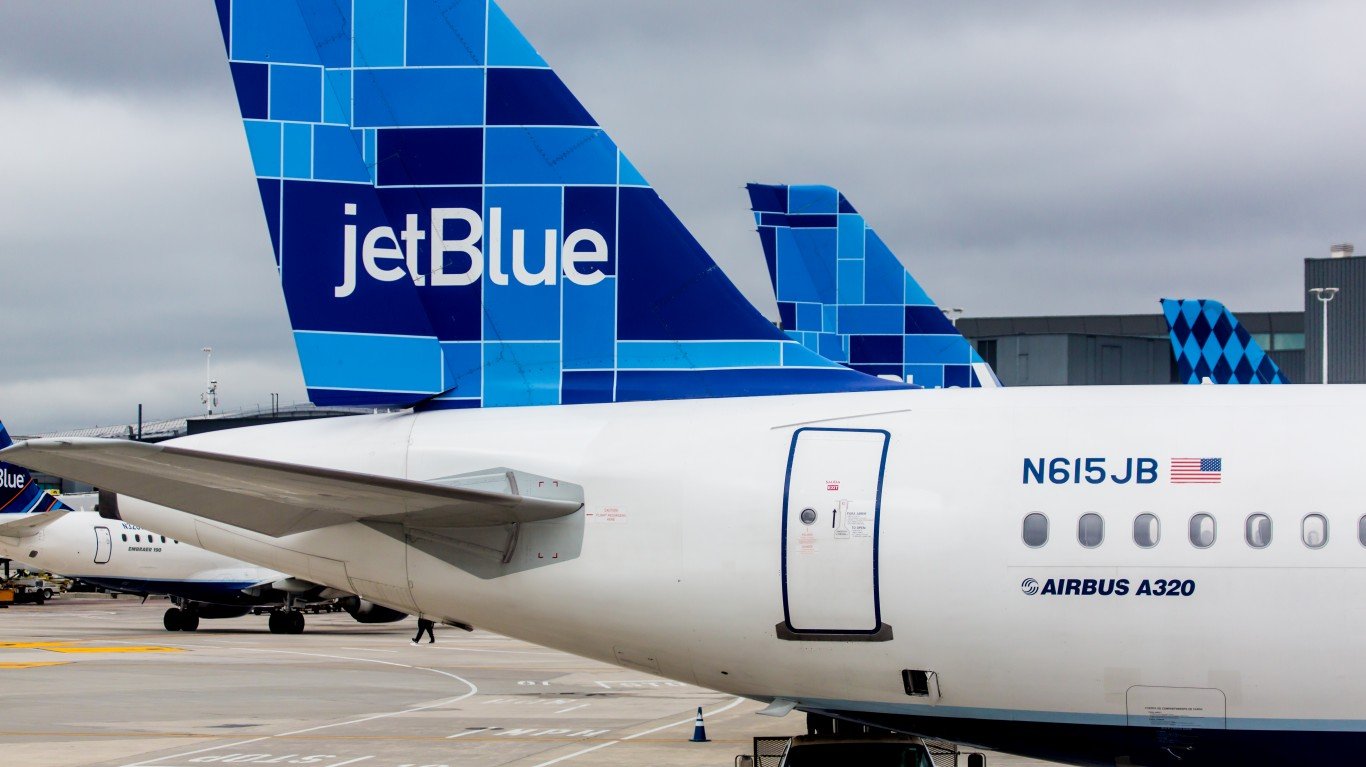
JetBlue Airways (NASDAQ:JBLU) stock is up 4% YTD at $4.70, matching the sector fund almost exactly. The U.S. Global Jets ETF (NYSEARCA:JETS) is up 4% YTD at $29.22, effectively flat exposure for the average airline.
Fuel Backdrop Sets a Direct Cost Test
WTI crude oil printed $86.77 on Thursday afternoon and is up 4% over the past month. Jet fuel is one of the largest line items an airline carries, so a rising crude price is a direct cost pressure rather than a sentiment issue.
Delta Air Lines owns Monroe Energy, an oil refinery subsidiary in Trainer, Pennsylvania, that no other major U.S. carrier operates. The airline also runs a co-branded credit card partnership with American Express through its SkyMiles program, a third-party aircraft maintenance business in Delta TechOps, and a cargo operation.
These streams reduce Delta’s dependence on ticket sales and on the crude print. That structural mix is what separates Delta’s revenue base from the rest of the big three in a year when jet fuel is a rising cost line.
Delta Versus American Tells the Story
American Airlines Group operates more than 6,000 daily flights, more than Delta’s roughly 5,500, and serves a comparable number of annual customers at more than 200 million. Yet American carries a market cap of $8.94 billion against Delta’s $53.15 billion.
The market is valuing the two businesses very differently despite similar operational scale. Delta’s 16% YTD gain against American’s 12% YTD decline is that same judgment expressed in share price.
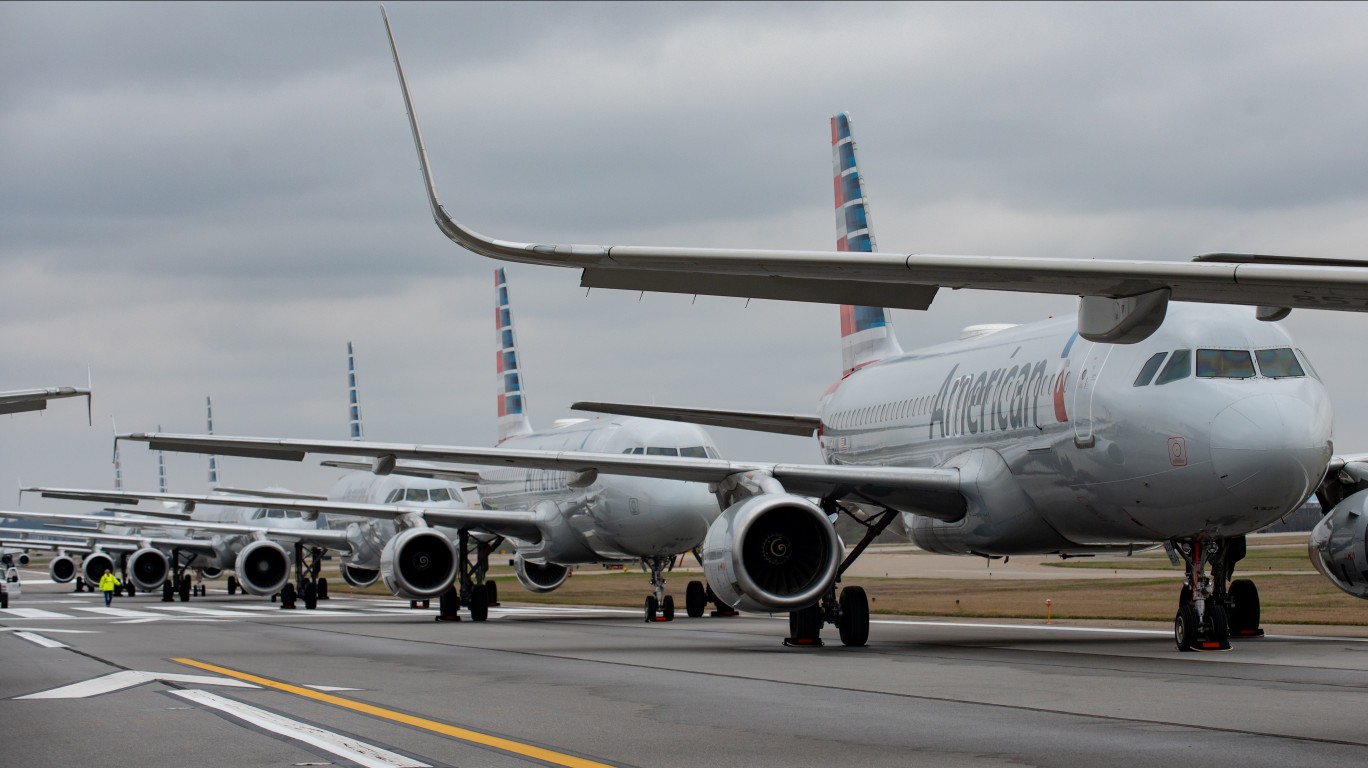
Among the three, American Airlines shares carry the highest ticket-revenue dependence of the three, and the highest exposure to a rising crude price. Without an offsetting refinery, a co-brand at the scale of Delta’s Amex tie-up, or a third-party maintenance line to match Delta TechOps, American’s earnings power moves more directly with fuel and fares.
United and JetBlue Sit in the Middle
United Airlines operates the most comprehensive global route network among North American carriers, with hubs in Chicago, Denver, Houston, Los Angeles, Newark, San Francisco, and Washington. Its shares sit flat on the year rather than tracking either the winner or the loser.
JetBlue Airways stock trades at a $1.78 billion market cap, a fraction of the size of the big three. The airline is running a multi-year turnaround program called JetForward, and its 4% YTD gain matches the sector fund.
What the Sector Fund Signals
The U.S. Global Jets ETF is up 4% YTD at $29.22, and its role here is to show that the average airline has gone almost nowhere in 2026. JETS isn’t a leveraged product.
The fund concentrates exposure in a single industry, so it carries sector risk that a broader fund would dilute. That concentration cuts both ways in a year when the top and bottom of the group are this far apart.
What Investors Should Take Away
The 2026 YTD range in this group runs from Delta Air Lines stock up 16% to American Airlines Group stock down 12%, while the Jets ETF sits at up 4%. Picking the airline has mattered far more in 2026 than owning the industry.
Position sizing should reflect that dispersion. A concentrated single-name airline bet has produced very different outcomes this year than a fund-level exposure to the same sector, so any allocation should be scaled to the individual name rather than assumed to move with the group.
Traders may want to keep an eye on whether crude oil holds above its recent range into the fall. Delta’s structural revenue mix could keep the YTD gap durable if fuel stays elevated, while American Airlines shares carry the least insulation from that same pressure.
Contact [email protected] for any questions or corrections.
David Moadel is financial writer specializing in stocks, ETFs, options, precious metals, and Bitcoin. David has written well over 1,000 articles for leading online publications, helping investors understand markets, income strategies, and risk.His work has appeared in The Motley Fool, InvestorPlace, U.S. News & World Report, TipRanks, ValueWalk, Benzinga, Market Realist, TalkMarkets, Finmasters, 24/7 Wall St., and others.With a master’s degree in education, David has taught at the elementary, high school, and college levels. That teaching background shapes his writing style: clear, educational, and practical. David has also built a loyal social-media audience by providing trustworthy financial content on YouTube, X/Twitter, and StockTwits.