60% of S&P 500 Stocks Are in a Bear Market, With the Index Near a Record
Goldman Sachs called it a hidden bear market, but the S&P 500 sits near a record high. Understanding what that contradiction reveals about where real danger is lurking inside the index changes how you read every market update.

This post may contain links from our sponsors and affiliates, and Flywheel Publishing may receive compensation for actions taken through them.
The S&P 500 closed at 7,568.92 on November 3, 2026, up 0.36%, leaving it 3.2% below its October 6 all-time close. In a client note reported the same day, Bobby Molavi, a Goldman Sachs trader and head of execution services for Europe, the Middle East and Africa, said about 60% of index members are in a bear market.
He called it a “hidden” bear market. The comment came from one trader’s note to clients and is separate from Goldman’s formal research forecasts.
A bear market is a drop of at least 20% from a high, and the choice of high determines the answer. Molavi’s benchmark was not published. The figure holds when measured from all-time highs, which can be years old, while a one-year measure captures only about a third of members.
The SPDR S&P 500 ETF Trust (NYSEARCA:SPY) rose 0.30% to $754.35, while the Invesco S&P 500 Equal Weight ETF (NYSEARCA:RSP) slipped 0.33% to $219.26. After hours, SPY traded at $751.99 and RSP at $219.01.
Our Count Puts the Bear Share Just Under 60%
We checked 502 members at November 3 closes. 289 of them, or 57.6%, sit at least 20% below their all-time highs, with a median gap of 23.5%.
Against 52-week highs, only 169 members, or 33.7%, qualify, and the median gap shrinks to 13.4%. Still, 61% are at least 10% below their one-year highs, which is correction territory.
Truist (NYSE:TFC | TFC Price Prediction) shows the split. It closed at $49.41, 12.1% below its 52-week high but 28.3% below its all-time high of $68.95.
Molavi’s puzzle is that the big AI spenders and the companies receiving that money are falling together. Both are off: Oracle (NYSE:ORCL) sits 50% below its 52-week high, while Microsoft (NASDAQ:MSFT) sits just 5.5% below its own. The Magnificent Seven have shed about $4 trillion in market value since October 15.
Why SPY and RSP Diverge
SPY weights members by market value, with its largest holding alone carrying 7.58% of assets. RSP gives every member a small, similar share, so it tracks the typical stock.
A count published October 30 tracked the index’s advance from its March 30 bottom. It found ten firms produced about 70%.
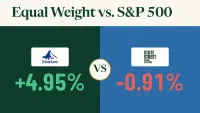
In October, RSP rose 4.95% while SPY fell 0.91%, as technology fell 8.30% and consumer staples jumped 10.94%. That rotation is why the average stock beat the index.
RSP closed 1.28% below its August 26 high close of $222.11. SPY sits 3.18% under its record close of $779.09.
Most Members Are Still Rising
Over the past month, 72.1% of members rose, with a median gain of 7.09%. This year, 67.5% are up, with a median gain of 9.34%.
Both readings hold because a stock far below an old peak can rally for a month and still count in the bear tally. The VIX, Wall Street’s fear gauge, rose to 21.15 on November 2, a level that signals high uncertainty.
ADP employment and ISM services data arrive Wednesday, November 4. October’s employment numbers arrive Friday, November 6, at 8:30 a.m. ET.
What Could Decide the SPY and RSP Gap Next
SPY concentrates its weight in the companies with the most earnings power. But an index fund leans on a few giants, and a small gap from the record can coexist with sharp declines among most other members, which is the uncomfortable pattern we walk through in a free handbook on riding a market near its highs without getting caught when it turns.
RSP has offered broader exposure this year. It is up 14.07% this year on price, ahead of SPY’s 10.01%, and it relies less on mega caps, although it tends to lag when those giants rally.
Should RSP close above $222.11 before SPY regains $779.09, broader participation is winning and the equal-weight approach gains support.
Contact [email protected] for any questions or corrections.
Omor Ibne Ehsan is a writer at 24/7 Wall St. He is a self-taught investor with a focus on growth, cyclical, and dividend equities that have strong fundamentals, value, and long-term potential. He also has an interest in high-risk, high-reward investments such as penny stocks.