Donald Trump was elected to office for a second term on a platform centered, in no small part, around deportations of undocumented migrants living in the United States. While the Trump administration has so far failed to keep pace with its stated goal of deporting one million immigrants per year, these shortcomings have not been for lack of trying—as the president continues to implement extraordinary measures to remove foreign nationals who crossed into the U.S. illegally.
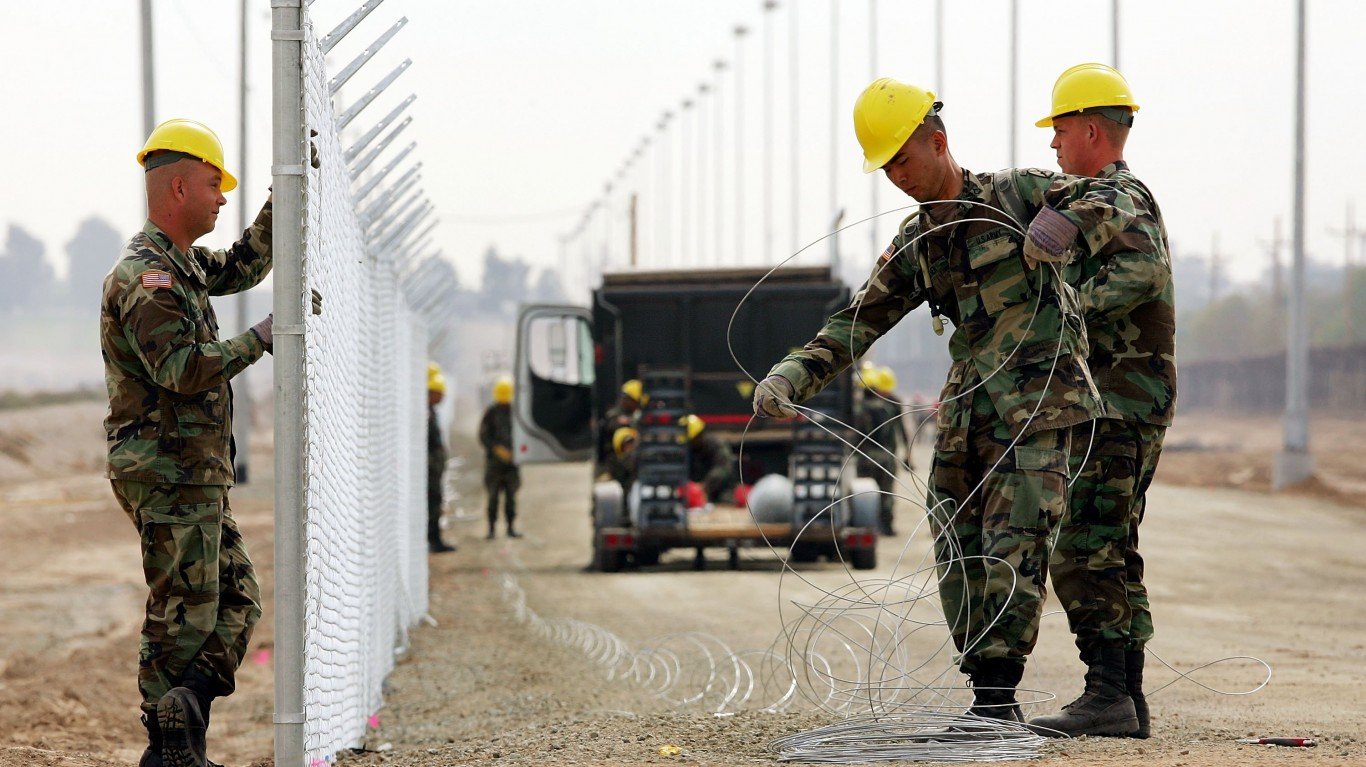
During the first few months of his second term, Trump removed long-standing restrictions that barred immigration enforcement agents from arresting migrants in places like schools, hospitals, or churches. Trump has also implemented and increased daily arrest quotas for U.S. Immigration and Customs Enforcement officials, expanded federal powers to conduct deportations while denying migrants access to legal defense, and pressured foreign governments to retrieve their citizens living illegally in the United States. (Here is a look at the Trump administration’s most and least popular policies so far.)
Whether these or any additional future measures will be sufficient for the Trump administration to meet its ambitious immigration goals remains to be seen. But some of the economic implications of that success are easier to predict.
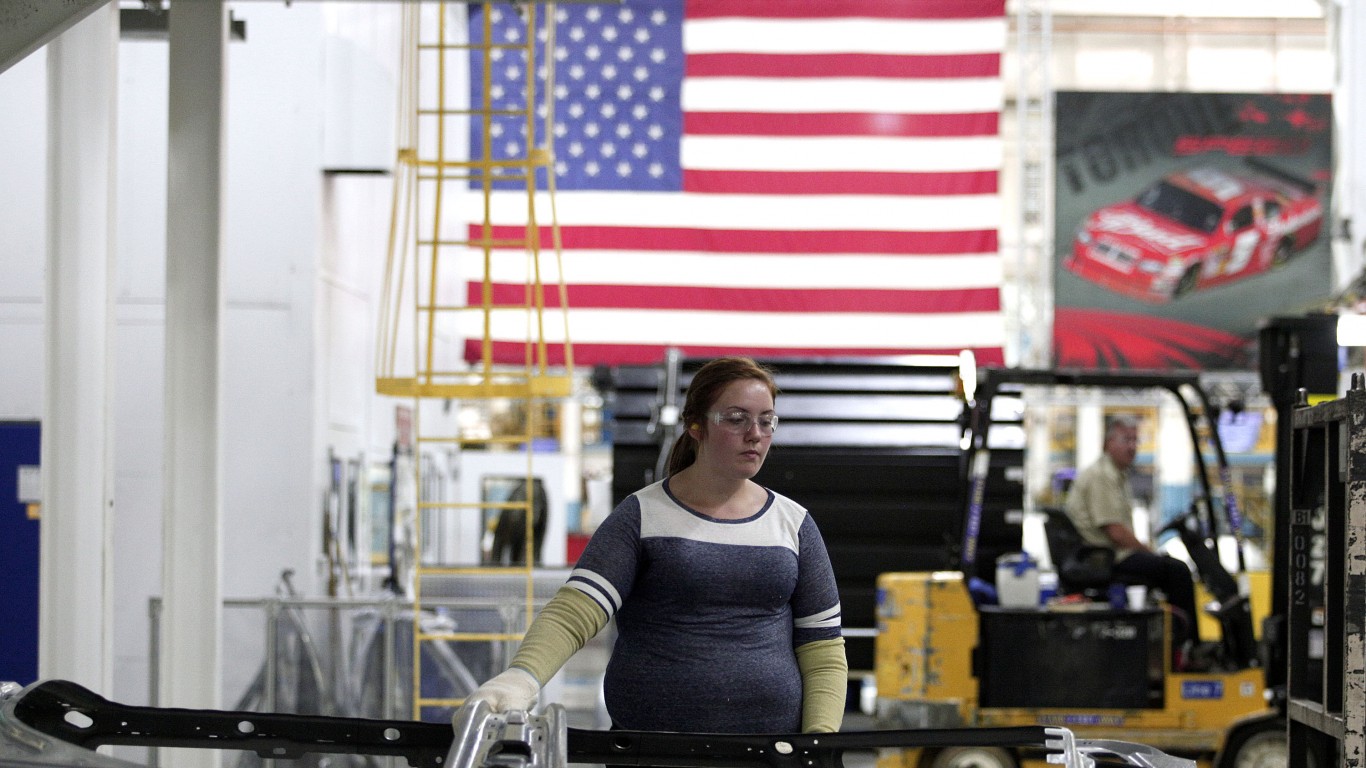
According to a study conducted by the Pew Research Center, there are nearly 8.3 million undocumented migrants working in the United States, accounting for approximately 4.8% of the American labor force. The same study found that these workers tend to be highly concentrated in construction, farming, and services—industries that would be disproportionately impacted by the mass removal of undocumented migrants. Additionally, in certain parts of the country, local economies rely far more on unauthorized labor than the U.S. average. In these places, economic disruptions caused by deportations would likely be magnified.
Using data from the Pew Research Center, 24/7 Wall St. identified the state economies that are most exposed to Trump administration deportations. States are ranked by the estimated number of undocumented workers as a share of their total labor force. Only the states where at least 1% of workers are undocumented were considered in this analysis. All data on undocumented migrants in this story are Pew estimates, current as of 2022. Supplemental data on median and average wages by state and occupation are 2024 estimates from the Bureau of Labor Statistics.
Among the 46 states on this list, the number of undocumented migrant workers ranges from fewer than 5,000 to nearly 1.5 million—accounting for anywhere from 1.1% to 8.6% of a given state’s total labor force.(These are the Americans most likely to approve of the job Trump is doing as president so far.)
In most states, unauthorized immigrant workers are largely concentrated in occupations in the agriculture, construction, or manufacturing industries. Notably, average annual wages for jobs in these and other fields employing large numbers of undocumented workers are often higher than the typical wage across all occupations in the state. It is important to note, however, that the legal status of undocumented migrants often means they are willing to work for wages that are well below average.
These are the state economies that will lose the most under Trump deportations.
Why It Matters

President Trump’s increasingly aggressive approach to the deportation of undocumented migrants could have massive economic implications. Multiple studies, including one conducted by the Economic Policy Institute, found that mass deportations could result in a meaningful economic contraction, reducing wages and driving up unemployment rates among American workers. While the Trump administration maintains its migrant expulsion policies will have the opposite effect, the potential consequences of deportations remain particularly stark in states where undocumented workers make up large shares of the labor force.
46. Mississippi

- Unauthorized immigrants as a share of state labor force: 1.1% (10,000 unauthorized migrant workers)
- Industry with the most unauthorized migrant workers: Construction
- Average annual wage for construction laborer occupations: $52,130
- Industry where unauthorized migrants make up the largest share of labor force: Construction
- Average annual wage for construction laborer occupations: $52,130
- Median annual wage across all occupations statewide: $39,070
45. Ohio

- Unauthorized immigrants as a share of state labor force: 1.5% (75,000 unauthorized migrant workers)
- Industry with the most unauthorized migrant workers: Manufacturing
- Average annual wage for manufacturing occupations: $66,820
- Industry where unauthorized migrants make up the largest share of labor force: Construction
- Average annual wage for construction laborer occupations: $52,130
- Median annual wage across all occupations statewide: $48,060
44. New Hampshire
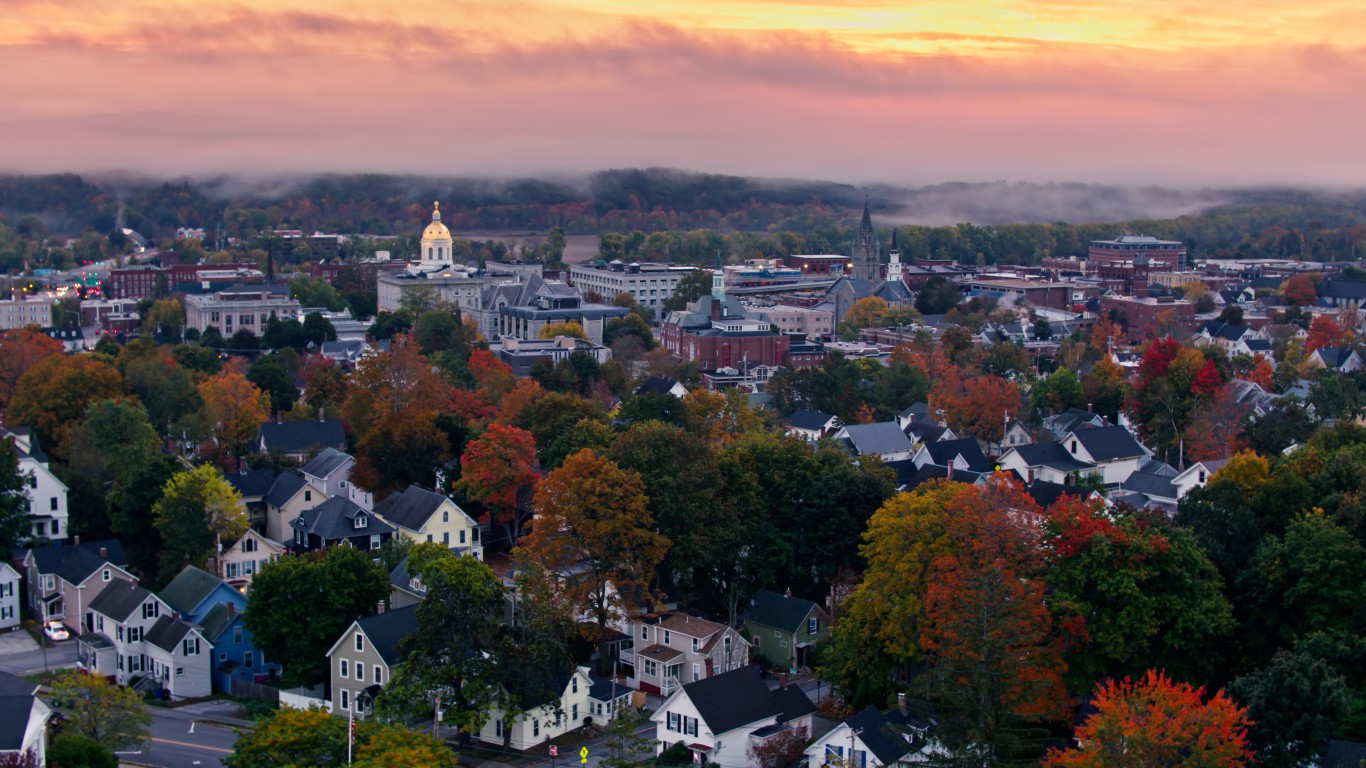
- Unauthorized immigrants as a share of state labor force: 1.5% (15,000 unauthorized migrant workers)
- Industry with the most unauthorized migrant workers: Business services
- Average annual wage for business support services occupations: $52,210
- Industry where unauthorized migrants make up the largest share of labor force: Information
- Average annual wage for information occupations: $112,770
- Median annual wage across all occupations statewide: $52,610
43. Missouri

- Unauthorized immigrants as a share of state labor force: 1.5% (45,000 unauthorized migrant workers)
- Industry with the most unauthorized migrant workers: Manufacturing
- Average annual wage for manufacturing occupations: $66,820
- Industry where unauthorized migrants make up the largest share of labor force: Manufacturing
- Average annual wage for manufacturing occupations: $66,820
- Median annual wage across all occupations statewide: $46,390
42. Kentucky

- Unauthorized immigrants as a share of state labor force: 1.6% (35,000 unauthorized migrant workers)
- Industry with the most unauthorized migrant workers: Manufacturing
- Average annual wage for manufacturing occupations: $66,820
- Industry where unauthorized migrants make up the largest share of labor force: Agriculture
- Average annual wage for agricultural worker occupations: $37,920
- Median annual wage across all occupations statewide: $45,740
41. Wyoming
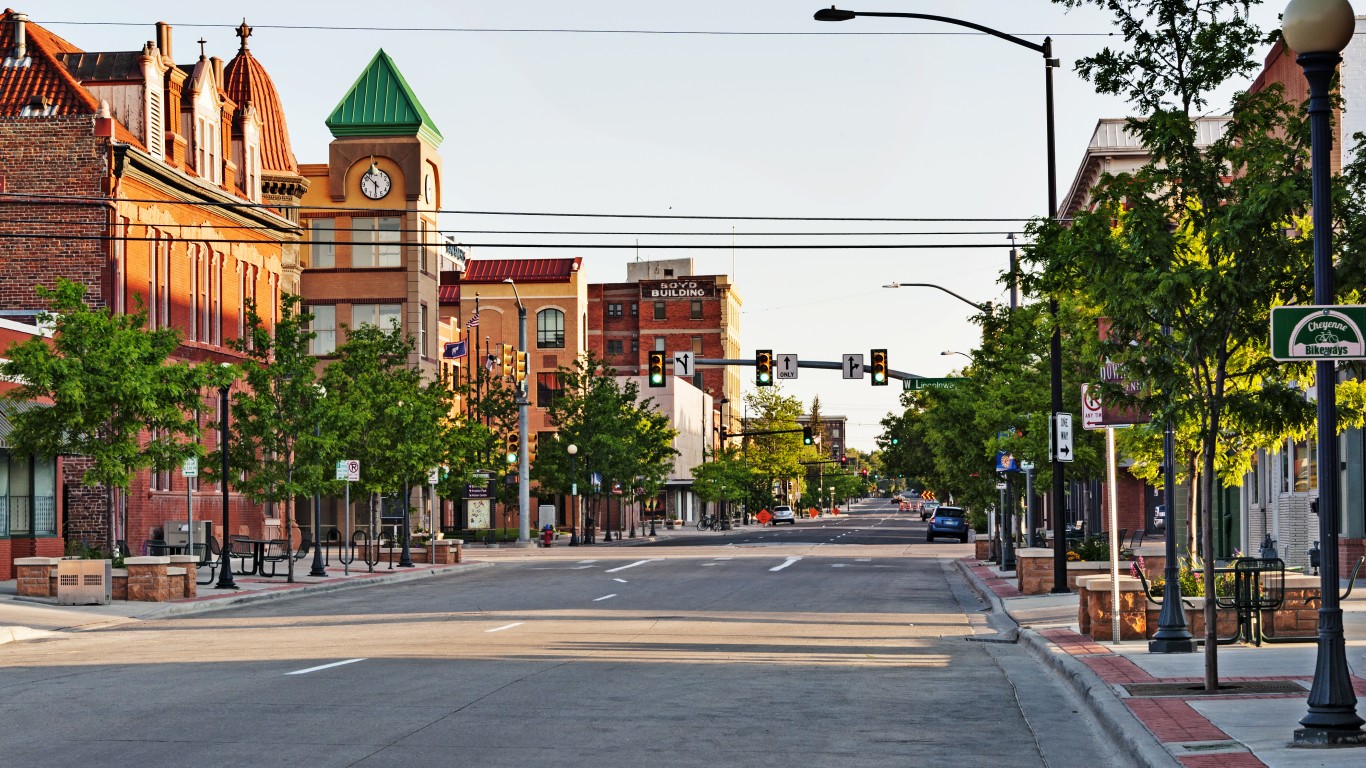
- Unauthorized immigrants as a share of state labor force: 1.7% (<5,000 unauthorized migrant workers)
- Industry with the most unauthorized migrant workers: Other services
- Average annual wage for other services occupations: $55,940
- Industry where unauthorized migrants make up the largest share of labor force: Other services
- Average annual wage for other services occupations: $55,940
- Median annual wage across all occupations statewide: $49,160
40. South Dakota
- Unauthorized immigrants as a share of state labor force: 1.7% (5,000 unauthorized migrant workers)
- Industry with the most unauthorized migrant workers: Manufacturing
- Average annual wage for manufacturing occupations: $66,820
- Industry where unauthorized migrants make up the largest share of labor force: Manufacturing
- Average annual wage for manufacturing occupations: $66,820
- Median annual wage across all occupations statewide: $45,620
39. North Dakota

- Unauthorized immigrants as a share of state labor force: 1.7% (5,000 unauthorized migrant workers)
- Industry with the most unauthorized migrant workers: Education/Health
- Average annual wage for educational services occupations: $67,700
- Industry where unauthorized migrants make up the largest share of labor force: Other services
- Average annual wage for other services occupations: $55,940
- Median annual wage across all occupations statewide: $50,320
38. Michigan

- Unauthorized immigrants as a share of state labor force: 1.8% (90,000 unauthorized migrant workers)
- Industry with the most unauthorized migrant workers: Manufacturing
- Average annual wage for manufacturing occupations: $66,820
- Industry where unauthorized migrants make up the largest share of labor force: Agriculture
- Average annual wage for agricultural worker occupations: $37,920
- Median annual wage across all occupations statewide: $48,300
37. Wisconsin

- Unauthorized immigrants as a share of state labor force: 1.9% (65,000 unauthorized migrant workers)
- Industry with the most unauthorized migrant workers: Manufacturing
- Average annual wage for manufacturing occupations: $66,820
- Industry where unauthorized migrants make up the largest share of labor force: Agriculture
- Average annual wage for agricultural worker occupations: $37,920
- Median annual wage across all occupations statewide: $48,930
36. Alabama

- Unauthorized immigrants as a share of state labor force: 1.9% (40,000 unauthorized migrant workers)
- Industry with the most unauthorized migrant workers: Construction
- Average annual wage for construction laborer occupations: $52,130
- Industry where unauthorized migrants make up the largest share of labor force: Construction
- Average annual wage for construction laborer occupations: $52,130
- Median annual wage across all occupations statewide: $43,830
35. Louisiana

- Unauthorized immigrants as a share of state labor force: 2.0% (45,000 unauthorized migrant workers)
- Industry with the most unauthorized migrant workers: Construction
- Average annual wage for construction laborer occupations: $52,130
- Industry where unauthorized migrants make up the largest share of labor force: Construction
- Average annual wage for construction laborer occupations: $52,130
- Median annual wage across all occupations statewide: $43,770
34. Minnesota

- Unauthorized immigrants as a share of state labor force: 2.2% (70,000 unauthorized migrant workers)
- Industry with the most unauthorized migrant workers: Manufacturing
- Average annual wage for manufacturing occupations: $66,820
- Industry where unauthorized migrants make up the largest share of labor force: Agriculture
- Average annual wage for agricultural worker occupations: $37,920
- Median annual wage across all occupations statewide: $53,810
33. South Carolina

- Unauthorized immigrants as a share of state labor force: 2.4% (65,000 unauthorized migrant workers)
- Industry with the most unauthorized migrant workers: Construction
- Average annual wage for construction laborer occupations: $52,130
- Industry where unauthorized migrants make up the largest share of labor force: Construction
- Average annual wage for construction laborer occupations: $52,130
- Median annual wage across all occupations statewide: $44,760
32. Pennsylvania

- Unauthorized immigrants as a share of state labor force: 2.5% (150,000 unauthorized migrant workers)
- Industry with the most unauthorized migrant workers: Education/Health
- Average annual wage for educational services occupations: $67,700
- Industry where unauthorized migrants make up the largest share of labor force: Agriculture
- Average annual wage for agricultural worker occupations: $37,920
- Median annual wage across all occupations statewide: $48,550
31. Indiana

- Unauthorized immigrants as a share of state labor force: 2.5% (80,000 unauthorized migrant workers)
- Industry with the most unauthorized migrant workers: Manufacturing
- Average annual wage for manufacturing occupations: $66,820
- Industry where unauthorized migrants make up the largest share of labor force: Agriculture
- Average annual wage for agricultural worker occupations: $37,920
- Median annual wage across all occupations statewide: $46,930
30. Alaska
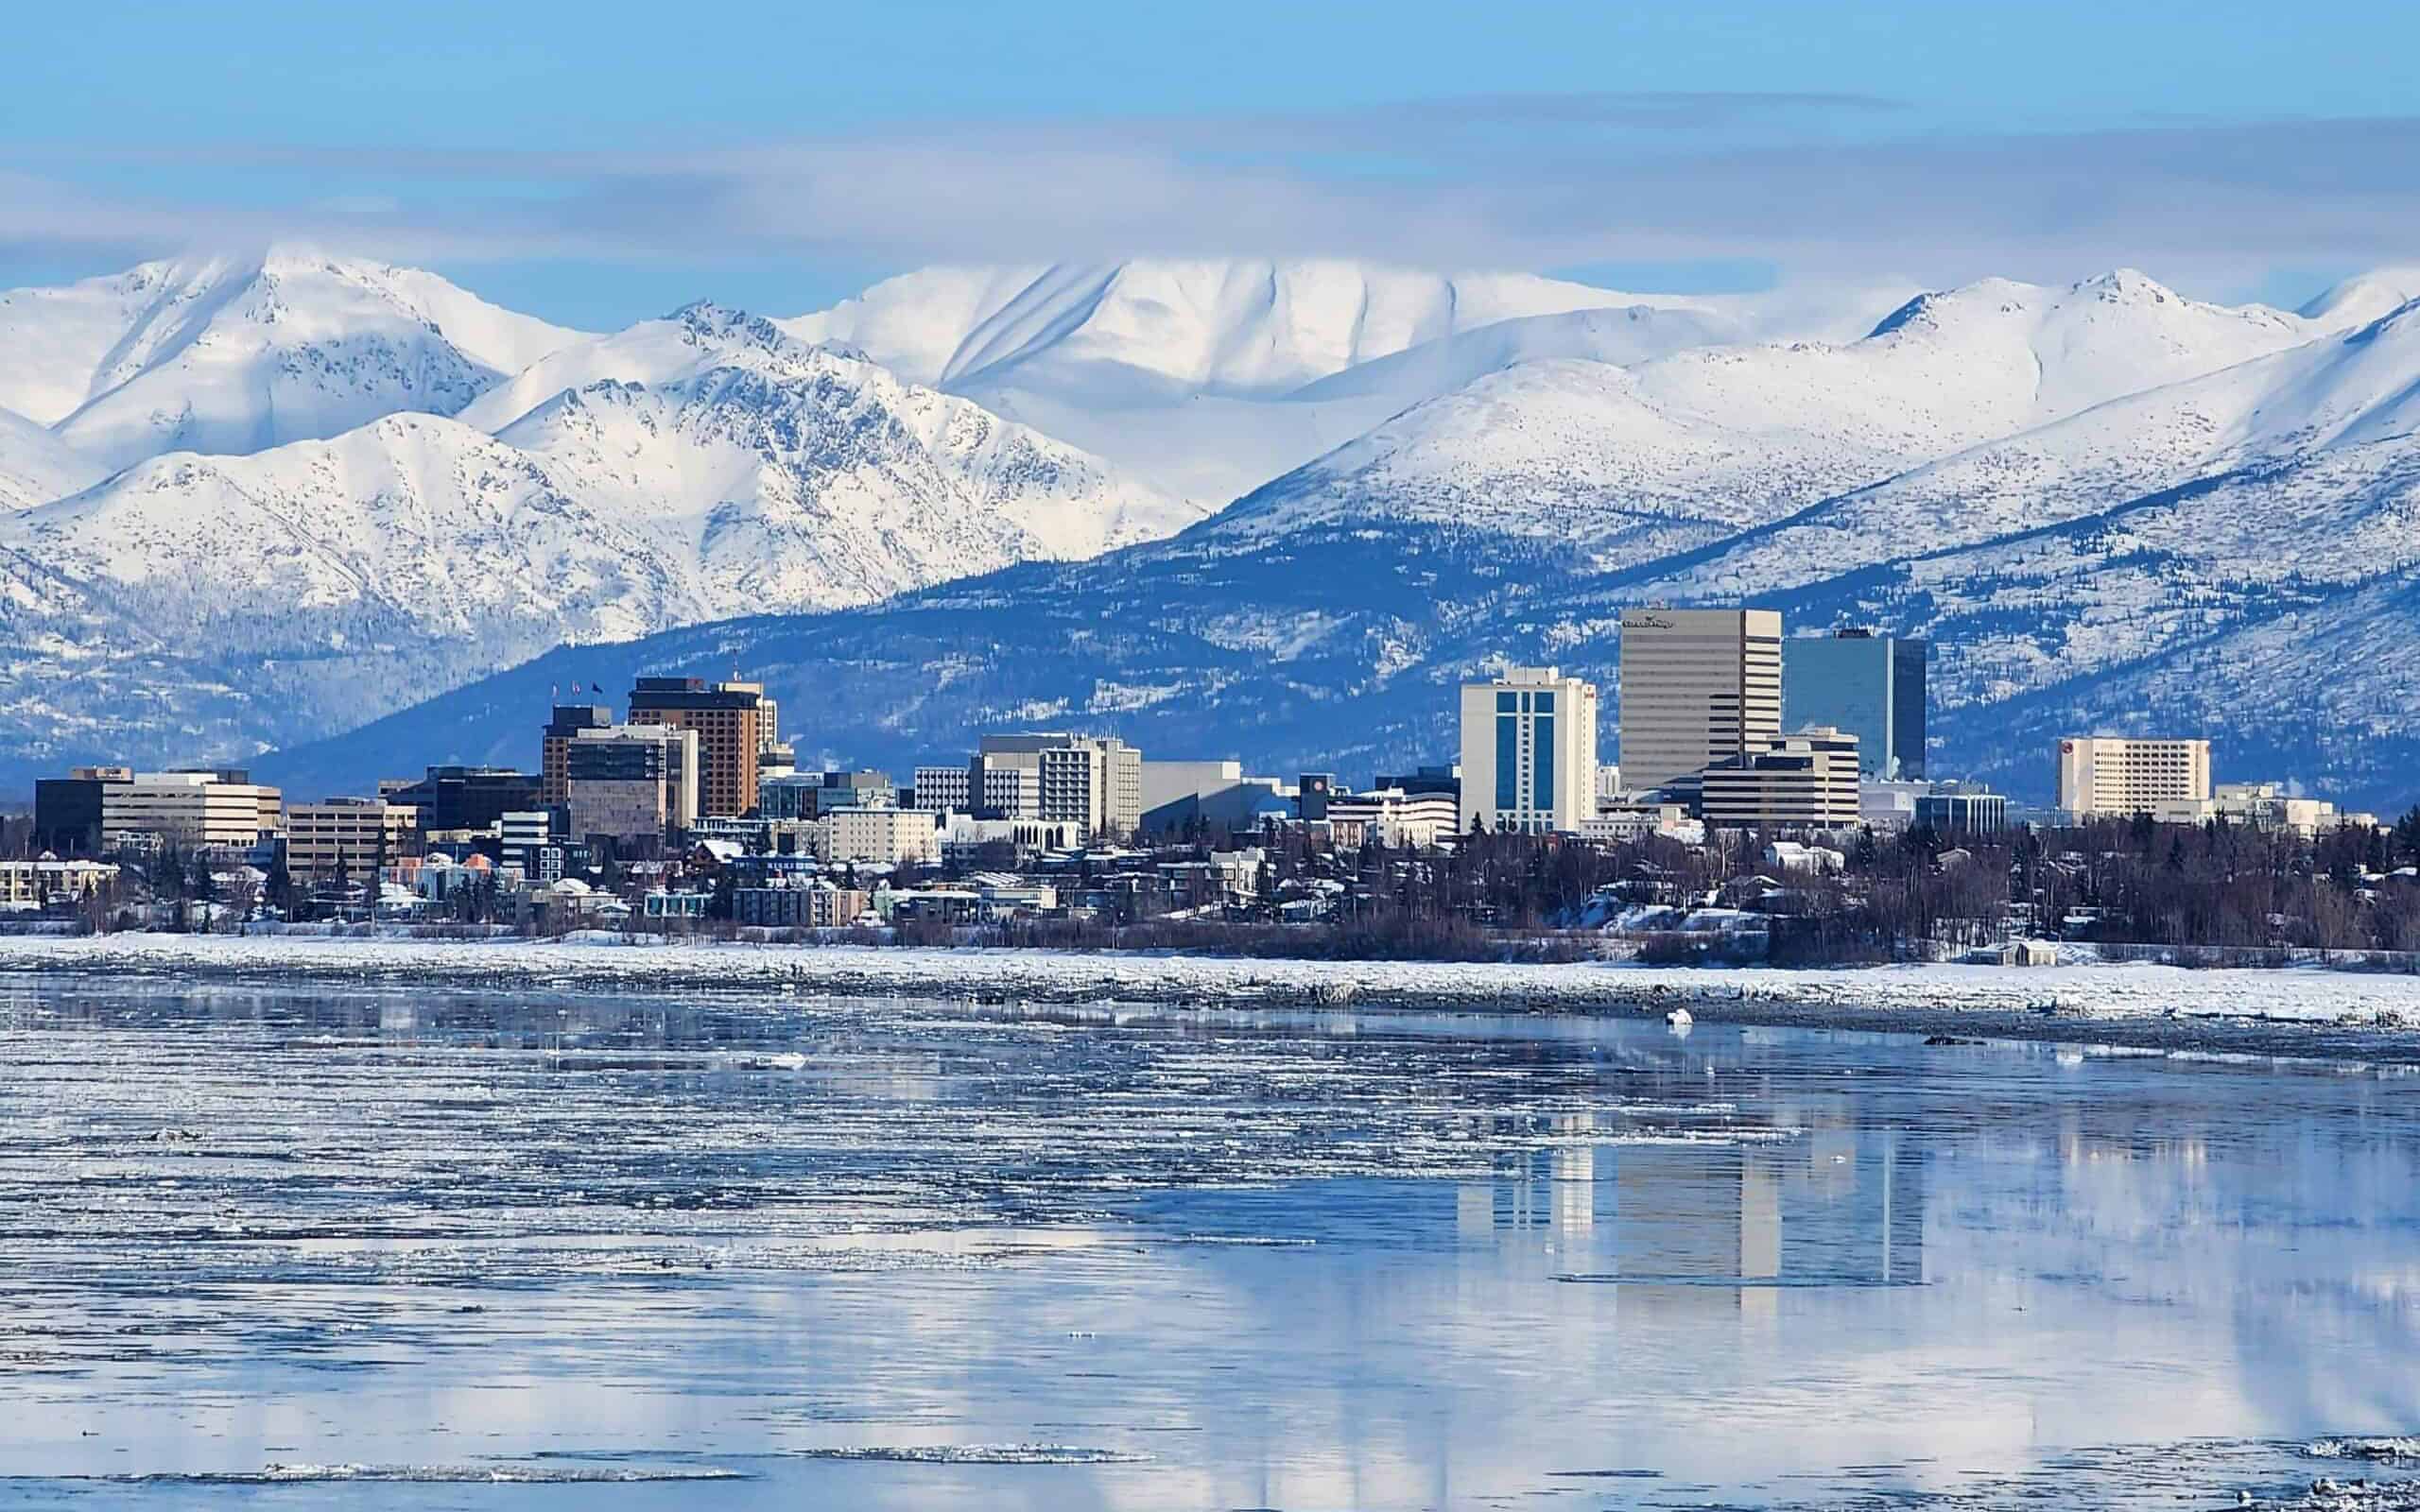
- Unauthorized immigrants as a share of state labor force: 2.6% (5,000 unauthorized migrant workers)
- Industry with the most unauthorized migrant workers: Manufacturing
- Average annual wage for manufacturing occupations: $66,820
- Industry where unauthorized migrants make up the largest share of labor force: Manufacturing
- Average annual wage for manufacturing occupations: $66,820
- Median annual wage across all occupations statewide: $59,400
29. Nebraska

- Unauthorized immigrants as a share of state labor force: 2.7% (35,000 unauthorized migrant workers)
- Industry with the most unauthorized migrant workers: Manufacturing
- Average annual wage for manufacturing occupations: $66,820
- Industry where unauthorized migrants make up the largest share of labor force: Manufacturing
- Average annual wage for manufacturing occupations: $66,820
- Median annual wage across all occupations statewide: $47,990
28. Iowa

- Unauthorized immigrants as a share of state labor force: 2.7% (35,000 unauthorized migrant workers)
- Industry with the most unauthorized migrant workers: Manufacturing
- Average annual wage for manufacturing occupations: $66,820
- Industry where unauthorized migrants make up the largest share of labor force: Manufacturing
- Average annual wage for manufacturing occupations: $66,820
- Median annual wage across all occupations statewide: $47,670
27. Tennessee

- Unauthorized immigrants as a share of state labor force: 2.8% (90,000 unauthorized migrant workers)
- Industry with the most unauthorized migrant workers: Construction
- Average annual wage for construction laborer occupations: $52,130
- Industry where unauthorized migrants make up the largest share of labor force: Agriculture
- Average annual wage for agricultural worker occupations: $37,920
- Median annual wage across all occupations statewide: $46,120
26. Idaho

- Unauthorized immigrants as a share of state labor force: 3.2% (30,000 unauthorized migrant workers)
- Industry with the most unauthorized migrant workers: Construction
- Average annual wage for construction laborer occupations: $52,130
- Industry where unauthorized migrants make up the largest share of labor force: Agriculture
- Average annual wage for agricultural worker occupations: $37,920
- Median annual wage across all occupations statewide: $46,470
25. Arkansas

- Unauthorized immigrants as a share of state labor force: 3.3% (50,000 unauthorized migrant workers)
- Industry with the most unauthorized migrant workers: Manufacturing
- Average annual wage for manufacturing occupations: $66,820
- Industry where unauthorized migrants make up the largest share of labor force: Construction
- Average annual wage for construction laborer occupations: $52,130
- Median annual wage across all occupations statewide: $41,020
24. Delaware

- Unauthorized immigrants as a share of state labor force: 3.5% (25,000 unauthorized migrant workers)
- Industry with the most unauthorized migrant workers: Business services
- Average annual wage for business support services occupations: $52,210
- Industry where unauthorized migrants make up the largest share of labor force: Transport/Utilities
- Average annual wage for transportation/utilities occupations: $62,460/$101,800
- Median annual wage across all occupations statewide: $51,030
23. Oklahoma

- Unauthorized immigrants as a share of state labor force: 3.6% (65,000 unauthorized migrant workers)
- Industry with the most unauthorized migrant workers: Construction
- Average annual wage for construction laborer occupations: $52,130
- Industry where unauthorized migrants make up the largest share of labor force: Construction
- Average annual wage for construction laborer occupations: $52,130
- Median annual wage across all occupations statewide: $43,950
22. Kansas

- Unauthorized immigrants as a share of state labor force: 3.6% (55,000 unauthorized migrant workers)
- Industry with the most unauthorized migrant workers: Manufacturing
- Average annual wage for manufacturing occupations: $66,820
- Industry where unauthorized migrants make up the largest share of labor force: Mining
- Average annual wage for mining occupations: $79,490
- Median annual wage across all occupations statewide: $46,850
21. New Mexico
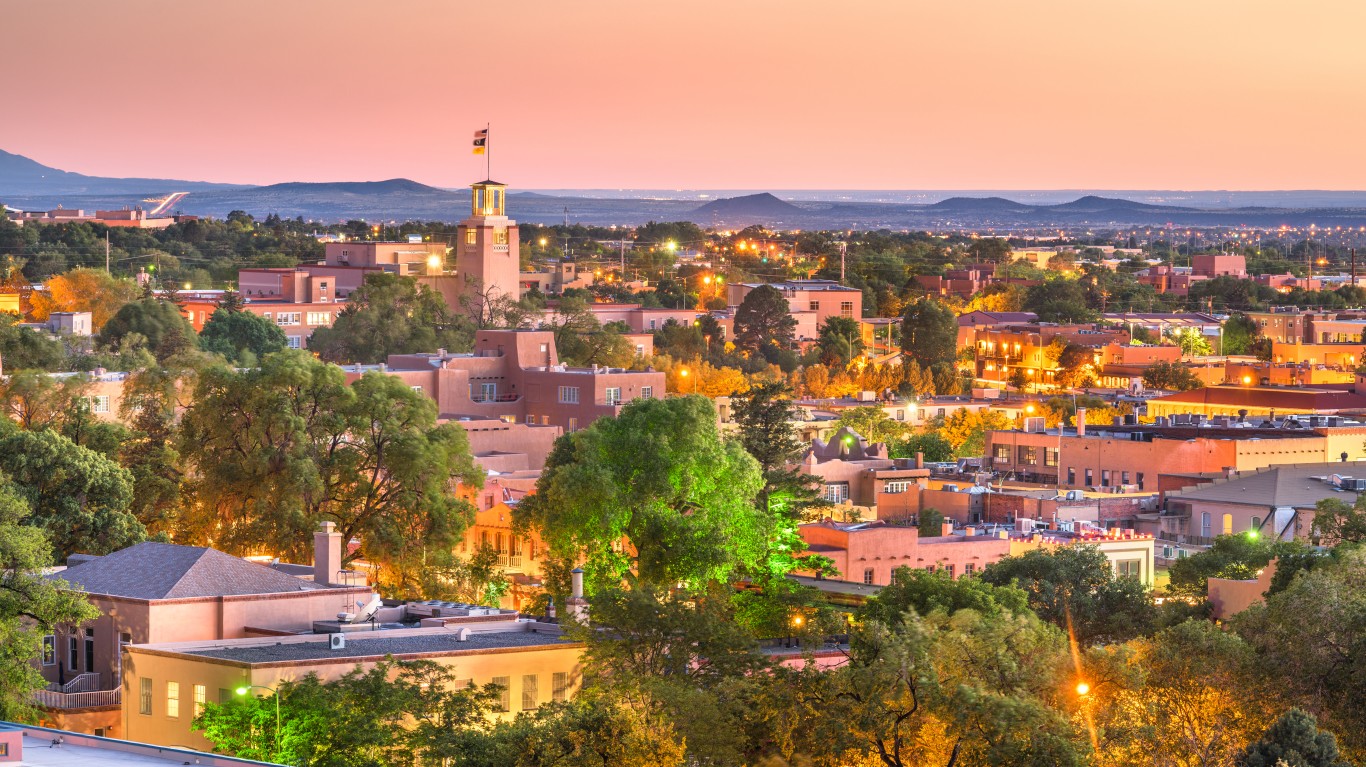
- Unauthorized immigrants as a share of state labor force: 3.7% (45,000 unauthorized migrant workers)
- Industry with the most unauthorized migrant workers: Construction
- Average annual wage for construction laborer occupations: $52,130
- Industry where unauthorized migrants make up the largest share of labor force: Construction
- Average annual wage for construction laborer occupations: $52,130
- Median annual wage across all occupations statewide: $45,870
20. Colorado

- Unauthorized immigrants as a share of state labor force: 3.8% (120,000 unauthorized migrant workers)
- Industry with the most unauthorized migrant workers: Construction
- Average annual wage for construction laborer occupations: $52,130
- Industry where unauthorized migrants make up the largest share of labor force: Construction
- Average annual wage for construction laborer occupations: $52,130
- Median annual wage across all occupations statewide: $N/A
19. North Carolina

- Unauthorized immigrants as a share of state labor force: 4.3% (220,000 unauthorized migrant workers)
- Industry with the most unauthorized migrant workers: Construction
- Average annual wage for construction laborer occupations: $52,130
- Industry where unauthorized migrants make up the largest share of labor force: Construction
- Average annual wage for construction laborer occupations: $52,130
- Median annual wage across all occupations statewide: $46,950
18. Hawaii

- Unauthorized immigrants as a share of state labor force: 4.3% (25,000 unauthorized migrant workers)
- Industry with the most unauthorized migrant workers: Leisure/Hospitality
- Average annual wage for accommodation and food services occupations: $37,960
- Industry where unauthorized migrants make up the largest share of labor force: Agriculture
- Average annual wage for agricultural worker occupations: $37,920
- Median annual wage across all occupations statewide: $53,260
17. Oregon

- Unauthorized immigrants as a share of state labor force: 4.4% (90,000 unauthorized migrant workers)
- Industry with the most unauthorized migrant workers: Manufacturing
- Average annual wage for manufacturing occupations: $66,820
- Industry where unauthorized migrants make up the largest share of labor force: Agriculture
- Average annual wage for agricultural worker occupations: $37,920
- Median annual wage across all occupations statewide: $53,390
16. Virginia

- Unauthorized immigrants as a share of state labor force: 4.5% (210,000 unauthorized migrant workers)
- Industry with the most unauthorized migrant workers: Construction
- Average annual wage for construction laborer occupations: $52,130
- Industry where unauthorized migrants make up the largest share of labor force: Construction
- Average annual wage for construction laborer occupations: $52,130
- Median annual wage across all occupations statewide: $53,020
15. Utah

- Unauthorized immigrants as a share of state labor force: 4.5% (75,000 unauthorized migrant workers)
- Industry with the most unauthorized migrant workers: Construction
- Average annual wage for construction laborer occupations: $52,130
- Industry where unauthorized migrants make up the largest share of labor force: Construction
- Average annual wage for construction laborer occupations: $52,130
- Median annual wage across all occupations statewide: $48,600
14. Georgia

- Unauthorized immigrants as a share of state labor force: 4.9% (250,000 unauthorized migrant workers)
- Industry with the most unauthorized migrant workers: Construction
- Average annual wage for construction laborer occupations: $52,130
- Industry where unauthorized migrants make up the largest share of labor force: Construction
- Average annual wage for construction laborer occupations: $52,130
- Median annual wage across all occupations statewide: $47,020
13. Arizona

- Unauthorized immigrants as a share of state labor force: 4.9% (190,000 unauthorized migrant workers)
- Industry with the most unauthorized migrant workers: Construction
- Average annual wage for construction laborer occupations: $52,130
- Industry where unauthorized migrants make up the largest share of labor force: Agriculture
- Average annual wage for agricultural worker occupations: $37,920
- Median annual wage across all occupations statewide: $48,810
12. New York

- Unauthorized immigrants as a share of state labor force: 5.0% (500,000 unauthorized migrant workers)
- Industry with the most unauthorized migrant workers: Construction
- Average annual wage for construction laborer occupations: $52,130
- Industry where unauthorized migrants make up the largest share of labor force: Construction
- Average annual wage for construction laborer occupations: $52,130
- Median annual wage across all occupations statewide: $58,560
11. Illinois

- Unauthorized immigrants as a share of state labor force: 5.0% (300,000 unauthorized migrant workers)
- Industry with the most unauthorized migrant workers: Manufacturing
- Average annual wage for manufacturing occupations: $66,820
- Industry where unauthorized migrants make up the largest share of labor force: Construction
- Average annual wage for construction laborer occupations: $52,130
- Median annual wage across all occupations statewide: $50,000
10. Rhode Island

- Unauthorized immigrants as a share of state labor force: 5.2% (25,000 unauthorized migrant workers)
- Industry with the most unauthorized migrant workers: Business services
- Average annual wage for business support services occupations: $52,210
- Industry where unauthorized migrants make up the largest share of labor force: Construction
- Average annual wage for construction laborer occupations: $52,130
- Median annual wage across all occupations statewide: $54,040
9. Connecticut

- Unauthorized immigrants as a share of state labor force: 5.5% (100,000 unauthorized migrant workers)
- Industry with the most unauthorized migrant workers: Education/Health
- Average annual wage for educational services occupations: $67,700
- Industry where unauthorized migrants make up the largest share of labor force: Construction
- Average annual wage for construction laborer occupations: $52,130
- Median annual wage across all occupations statewide: $58,400
8. Washington

- Unauthorized immigrants as a share of state labor force: 6.1% (220,000 unauthorized migrant workers)
- Industry with the most unauthorized migrant workers: Business services
- Average annual wage for business support services occupations: $52,210
- Industry where unauthorized migrants make up the largest share of labor force: Agriculture
- Average annual wage for agricultural worker occupations: $37,920
- Median annual wage across all occupations statewide: $61,590
7. Massachusetts

- Unauthorized immigrants as a share of state labor force: 6.4% (220,000 unauthorized migrant workers)
- Industry with the most unauthorized migrant workers: Business services
- Average annual wage for business support services occupations: $52,210
- Industry where unauthorized migrants make up the largest share of labor force: Construction
- Average annual wage for construction laborer occupations: $52,130
- Median annual wage across all occupations statewide: $62,270
6. Maryland

- Unauthorized immigrants as a share of state labor force: 6.5% (200,000 unauthorized migrant workers)
- Industry with the most unauthorized migrant workers: Construction
- Average annual wage for construction laborer occupations: $52,130
- Industry where unauthorized migrants make up the largest share of labor force: Construction
- Average annual wage for construction laborer occupations: $52,130
- Median annual wage across all occupations statewide: $58,050
5. California

- Unauthorized immigrants as a share of state labor force: 7.2% (1,450,000 unauthorized migrant workers)
- Industry with the most unauthorized migrant workers: Construction
- Average annual wage for construction laborer occupations: $52,130
- Industry where unauthorized migrants make up the largest share of labor force: Agriculture
- Average annual wage for agricultural worker occupations: $37,920
- Median annual wage across all occupations statewide: $56,940
4. New Jersey

- Unauthorized immigrants as a share of state labor force: 7.5% (325,000 unauthorized migrant workers)
- Industry with the most unauthorized migrant workers: Business services
- Average annual wage for business support services occupations: $52,210
- Industry where unauthorized migrants make up the largest share of labor force: Construction
- Average annual wage for construction laborer occupations: $52,130
- Median annual wage across all occupations statewide: $57,230
3. Florida

- Unauthorized immigrants as a share of state labor force: 7.5% (625,000 unauthorized migrant workers)
- Industry with the most unauthorized migrant workers: Construction
- Average annual wage for construction laborer occupations: $52,130
- Industry where unauthorized migrants make up the largest share of labor force: Agriculture
- Average annual wage for agricultural worker occupations: $37,920
- Median annual wage across all occupations statewide: $46,860
2. Texas

- Unauthorized immigrants as a share of state labor force: 8.1% (1,250,000 unauthorized migrant workers)
- Industry with the most unauthorized migrant workers: Construction
- Average annual wage for construction laborer occupations: $52,130
- Industry where unauthorized migrants make up the largest share of labor force: Construction
- Average annual wage for construction laborer occupations: $52,130
- Median annual wage across all occupations statewide: $47,500
1. Nevada
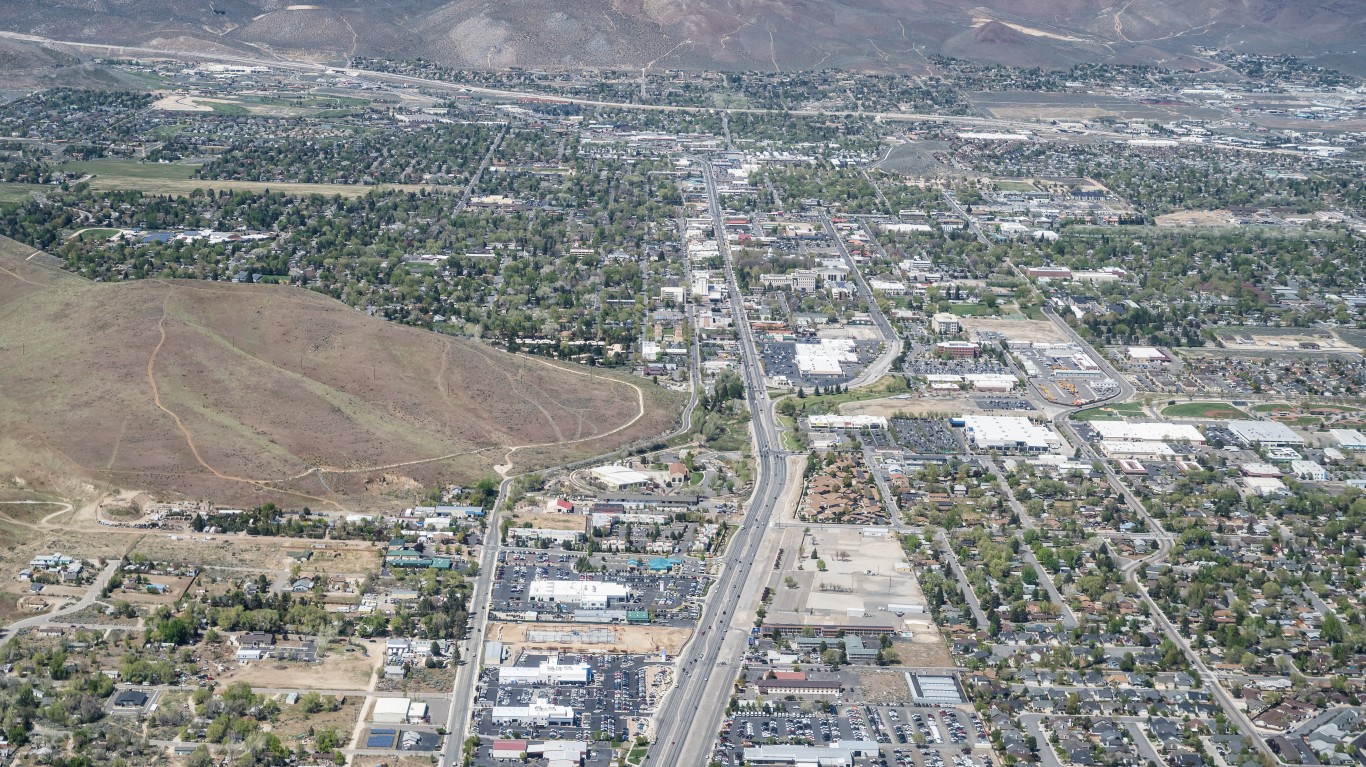
- Unauthorized immigrants as a share of state labor force: 8.6% (150,000 unauthorized migrant workers)
- Industry with the most unauthorized migrant workers: Leisure/Hospitality
- Average annual wage for accommodation and food services occupations: $37,960
- Industry where unauthorized migrants make up the largest share of labor force: Construction
- Average annual wage for construction laborer occupations: $52,130
- Median annual wage across all occupations statewide: $46,440
Contact [email protected] for any questions or corrections.