Throughout the history of the United States, the growth of large cities has been fueled by international immigration. Since 2010, nearly a third of the net 7.7 million Americans who have immigrated to America have settled in just five metro areas.
Large U.S. cities have a number of pull factors that attract new immigrants, such as job opportunities, ease of access, and ethnic neighborhoods and enclaves. While large coastal cities — New York, San Francisco, and Miami — have been the main ports of entry during the country’s major immigration waves, there are a number of other U.S. metro areas with highly diverse populations.
To determine America’s melting pot cities, 24/7 Wall St. ranked metro areas based on the likelihood that two residents picked at random would be from two different world regions: the United States, Europe, Asia, Africa, Oceania, Latin America, and other parts of North America.
Before the Immigration and Naturalization Act of 1965 eliminated immigration quotas based on national origin, there were three main waves of immigration. In the early 19th century, English, Scottish, Dutch, and French immigrants settled throughout the Northeast, seeking religious and political freedom. In the mid-19th century, joblessness, famine, and poverty pushed many German, British, and Irish immigrants across the Atlantic. In the latter half of the century, a large influx of immigrants from Asia settled throughout the West Coast, finding work as miners, farmhands, and railroad laborers.
One major wave of immigration occurred through the Bracero Program, a federal jobs program meant to fill the agricultural labor shortage caused by World War II. Through the program, more than 4.5 million Mexicans entered the United States from 1942 to 1964, settling in border cities. These cities include several on this list, like El Paso, Texas; El Centro, California; and Yuma, Arizona. As hubs for international migration, these cities contribute to larger than typical immigrant populations across the state as a whole. Here is a full list of the states with the largest immigrant populations.
Large immigrant populations do not necessarily mean economic and social conditions are favorable for immigrants. Many of the states with the largest immigrant populations also rank among the worst states for Hispanics and Latinos.
Click here to see America’s melting pot cities.
Click here to see our methodology.
20. Stockton-Lodi, CA
> Odds two residents are from different regions: 38.5%
> Pct. born abroad: 23.0%
> Pct. of foreign-born gained citizenship: 52.1%
> Origin of largest immigrant group: Mexico (48.9% of foreign-born)
In the Stockton-Lodi metro area, there is a 38.5% chance that two residents picked at random will be from different regions of the world, compared to 24.8% nationwide. One of the main waves of immigration to Stockton occurred after the passage of the Immigration Act of 1924, which banned the entry of Asian residents into the United States and created labor shortages throughout the Central Valley. Many residents of the Philippines — which was occupied by the United States at the time and exempt from the ban — came and filled the job gap, working in agricultural jobs and establishing a predominantly Filipino area in downtown Stockton known as Little Manila. Today, foreign-born Filipino Americans constitute 13.5% of Stockton’s foreign-born population, one of the largest shares of any U.S. metro.
[in-text-ad]
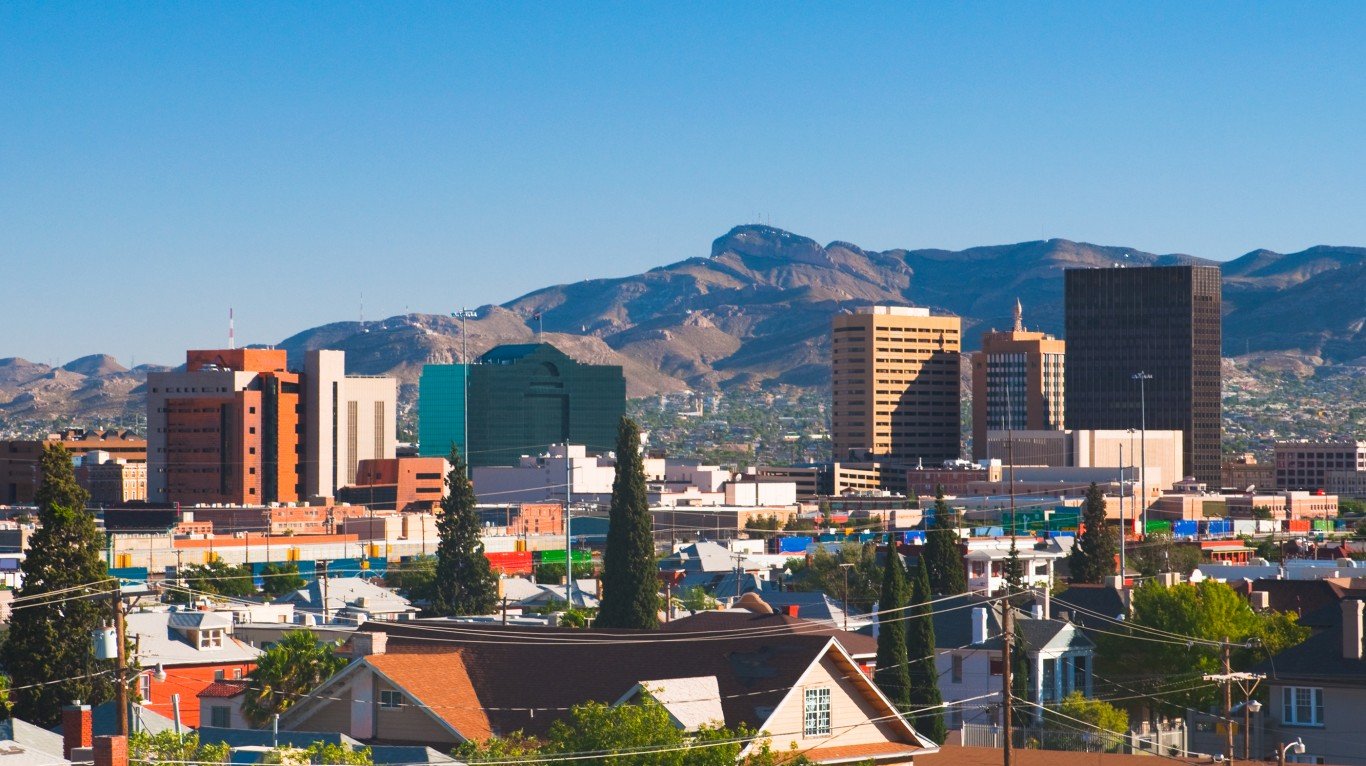
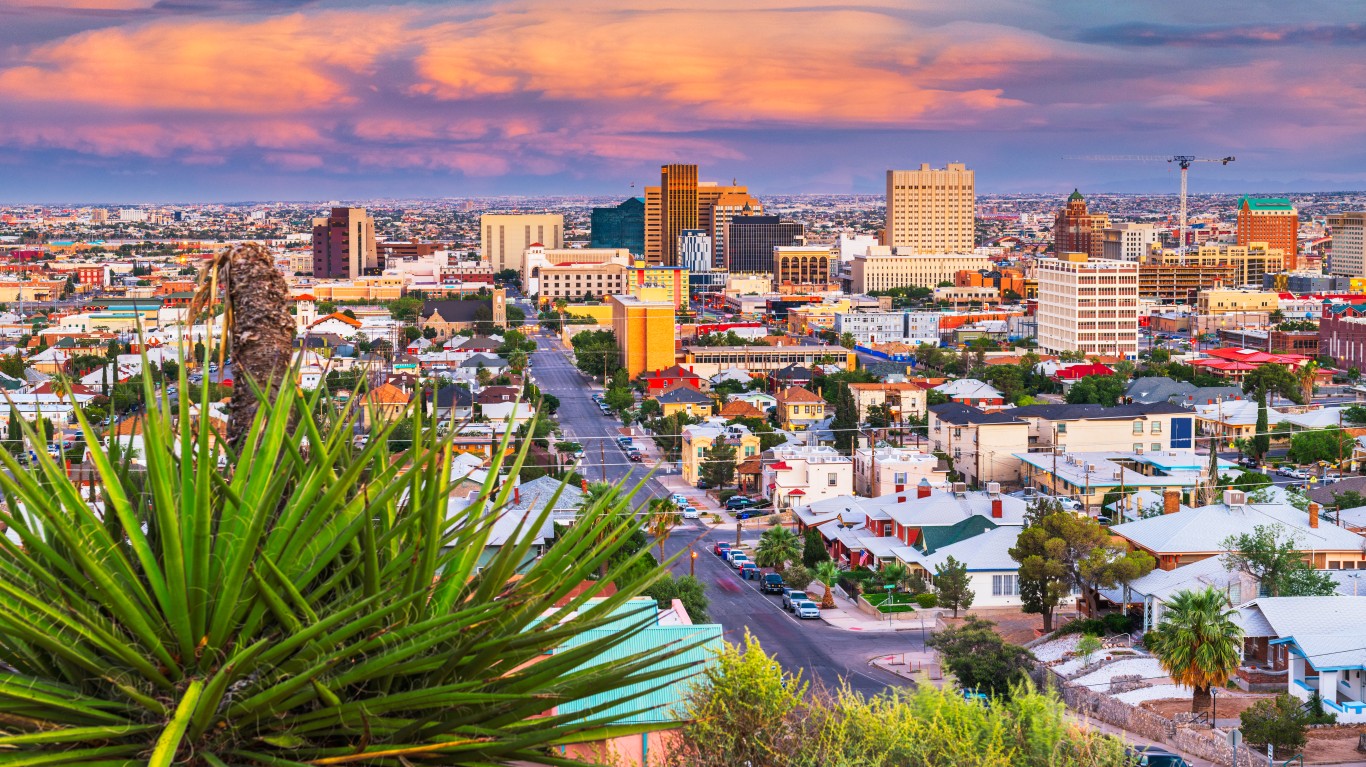
19. El Paso, TX
> Odds two residents are from different regions: 38.6%
> Pct. born abroad: 25.3%
> Pct. of foreign-born gained citizenship: 48.5%
> Origin of largest immigrant group: Mexico (90.7% of foreign-born)
El Paso is one of several cities along the U.S.-Mexico border to rank among the most diverse in America. One major immigration wave in the mid-20th century was during the Bracero Program, a federal labor program meant to fill the labor shortage created by WWII. From 1942 to 1964, more than 4.5 million Mexicans entered the United States through the Bracero Program, and the population of El Paso nearly tripled.
Roughly 23% of the El Paso population was born in Mexico, the fourth largest share and nearly seven times the national figure.
[recirclink id=436289]

18. Las Vegas-Henderson-Paradise, NV
> Odds two residents are from different regions: 38.6%
> Pct. born abroad: 23.1%
> Pct. of foreign-born gained citizenship: 49.2%
> Origin of largest immigrant group: Mexico (38.5% of foreign-born)
While many Americans visit Las Vegas for a temporary stay, in recent decades the city has attracted a large number of permanent residents from outside the country. Today, foreign-born residents constitute 23.1% of the Las Vegas population, far more than the 13.7% national share. Some countries with relatively outsized representation in the Las Vegas metro area include Bulgaria, the Philippines, and Ethiopia.
17. Bridgeport-Stamford-Norwalk, CT
> Odds two residents are from different regions: 38.7%
> Pct. born abroad: 23.1%
> Pct. of foreign-born gained citizenship: 44.7%
> Origin of largest immigrant group: Mexico (7.1% of foreign-born)
Today, foreign-born Europeans constitute an estimated 4.9% of the Bridgeport population, the largest share of any U.S. city. Countries with outsized representation among the Bridgeport foreign-born population include Portugal and Poland, as well as Haiti, Jamaica, Colombia, and Ecuador.
[in-text-ad-2]
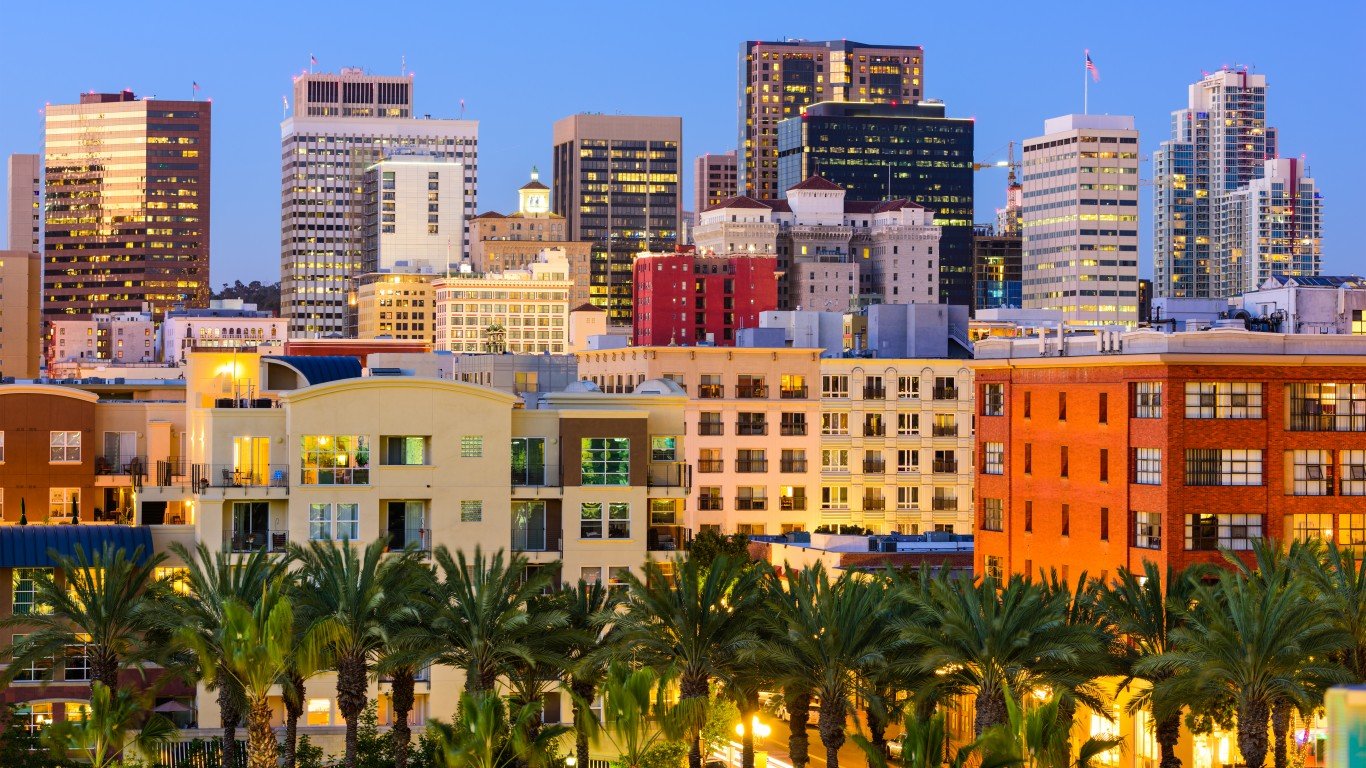
16. San Diego-Carlsbad, CA
> Odds two residents are from different regions: 39.0%
> Pct. born abroad: 23.3%
> Pct. of foreign-born gained citizenship: 55.0%
> Origin of largest immigrant group: Mexico (44.2% of foreign-born)
An estimated 1.9% of San Diego residents were born in Europe; 9.1% in Asia; 0.4% in Africa; 0.1% in Oceana; 11.3% in Latin America; and 0.4% in other parts of North America — each among the largest shares of any city. Overall, there is a 39.0% chance that two San Diego residents picked at random will be from different parts of the world, far more than the 24.8% national diversity probability.
Some of the most diverse neighborhoods in San Diego include Encanto, Rolando, Talmadge, Paradise, Linda Vista, Serra Mesa, and Mira Mesa.

15. Houston-The Woodlands-Sugar Land, TX
> Odds two residents are from different regions: 39.1%
> Pct. born abroad: 23.6%
> Pct. of foreign-born gained citizenship: 39.8%
> Origin of largest immigrant group: Mexico (40.5% of foreign-born)
In Houston, there is a 39.1% chance that two residents picked at random will be from different parts of the world, far more than the 24.8% national figure. One major immigration wave to Houston occurred in the 1970s, when large numbers of Vietnamese refugees moved to the area. There was another wave in the 1980s, when an influx of Hispanic and Latino residents came to the area after a collapse in the price of oil lowered the cost of living in the city.
[in-text-ad]
14. Washington-Arlington-Alexandria, DC-VA-MD-WV
> Odds two residents are from different regions: 39.2%
> Pct. born abroad: 23.1%
> Pct. of foreign-born gained citizenship: 51.3%
> Origin of largest immigrant group: El Salvador (13.6% of foreign-born)
Home to roughly 200 embassies and diplomatic missions, Washington, D.C. is one of the most diverse cities in the United States. An estimated 3.5% of residents in the metro area were born in Africa, the second largest share of any metro area. Additionally, 1.9% of residents were born in Europe, and 8.4% in Asia — each among the largest such shares nationwide. There is a 39.2% chance that any two residents picked at random will be from different parts of the world, compared to a 24.8% chance nationwide. In recent years, Washington’s population growth was due in part to an influx of Central American residents.
[recirclink id=494421]

13. McAllen-Edinburg-Mission, TX
> Odds two residents are from different regions: 39.2%
> Pct. born abroad: 26.2%
> Pct. of foreign-born gained citizenship: 27.8%
> Origin of largest immigrant group: Mexico (93.3% of foreign-born)
McAllen is one of many metro areas along the U.S.-Mexico border to rank among America’s most diverse cities. Approximately one in every four residents was born in Latin America, the fourth highest such proportion nationwide. A majority of McAllen residents speak Spanish at home, and most of the street signs in the city are written in both English and Spanish.
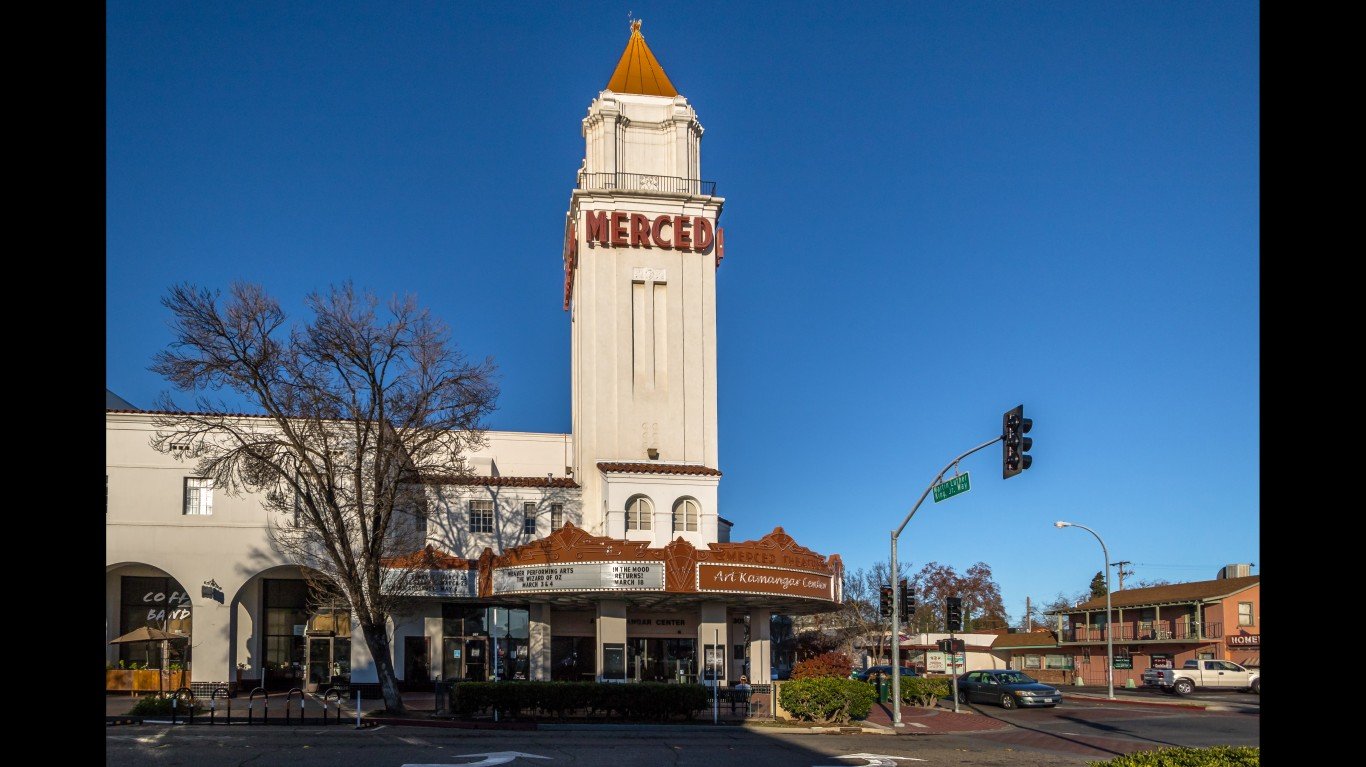
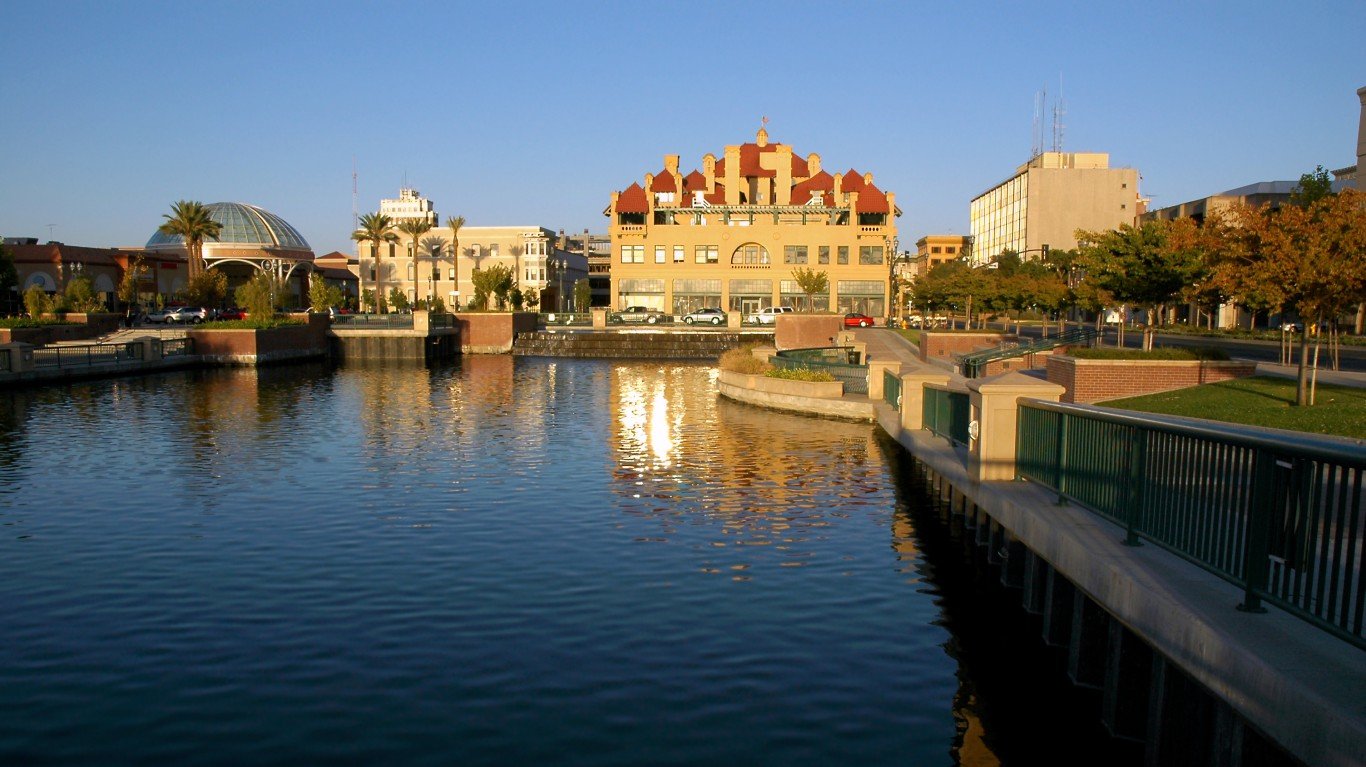
12. Merced, CA
> Odds two residents are from different regions: 39.8%
> Pct. born abroad: 24.8%
> Pct. of foreign-born gained citizenship: 37.0%
> Origin of largest immigrant group: Mexico (72.5% of foreign-born)
There is a 39.8% chance that two residents picked at random in the Merced metro area will be from different parts of the world, far more than the 24.8% national diversity probability. One of the largest immigrant groups in Merced is the Hmong. During the 1970s, a large wave of Hmong refugees from Laos settled in Merced and throughout the Central Valley. Other countries that are well represented in the Merced metro area include Portugal, Thailand, and Mexico.
[in-text-ad-2]

11. Trenton, NJ
> Odds two residents are from different regions: 40.1%
> Pct. born abroad: 23.8%
> Pct. of foreign-born gained citizenship: 45.2%
> Origin of largest immigrant group: India (15.8% of foreign-born)
Like many major cities in the Northeast, Trenton’s industrial growth in the 19th century was fueled by international immigration. One of the major waves was in the mid-1800s, when large groups of German and Irish immigrants settled in the metro area. Towards the end of the century, there were major waves of Italian and Eastern European immigrants moving to the city.
Today, foreign-born Europeans constitute 3.3% of Trenton’s population. Asian immigrants account for 8.1% of the population; African immigrants 2.1%; and Latin American immigrants 9.7% — each some of the largest shares nationwide. The metro area’s largest immigrant group is from India, representing 15.8% of the city’s foreign-born population.
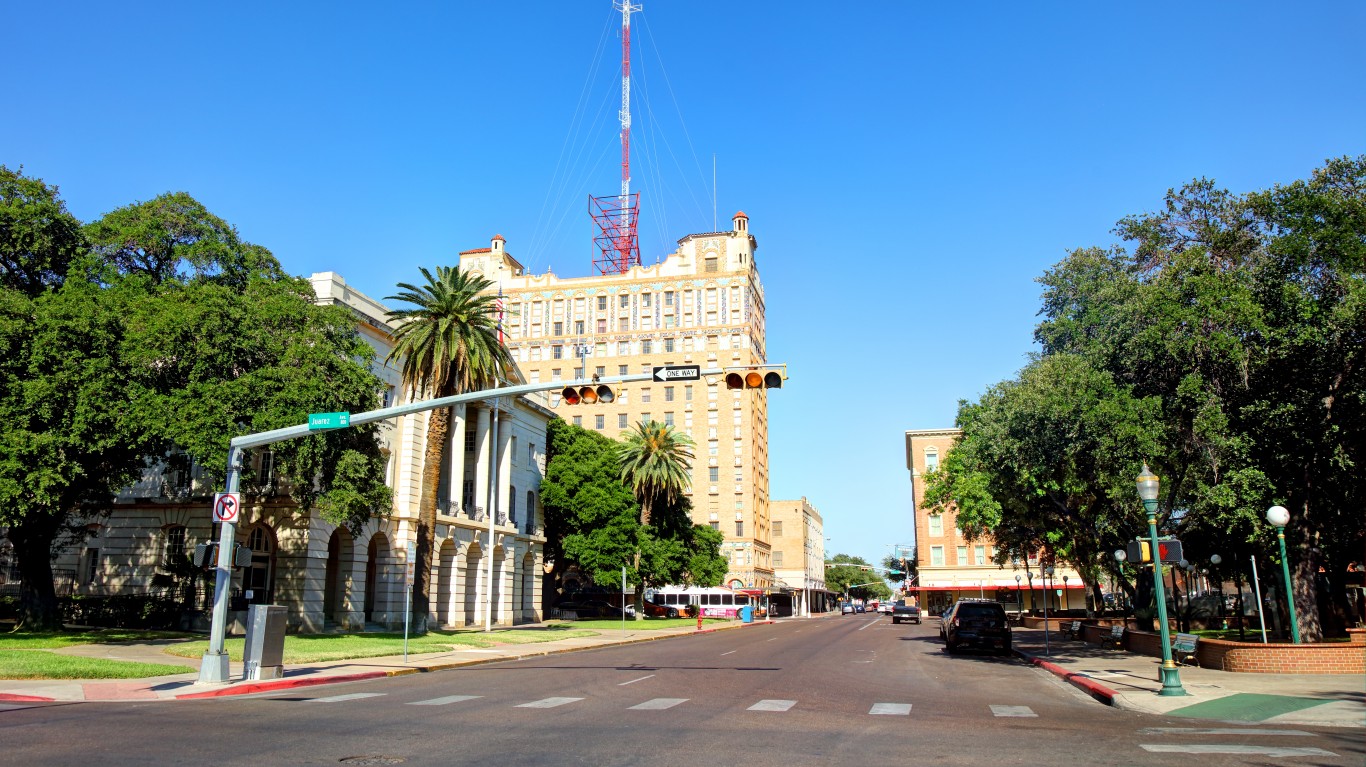
10. Laredo, TX
> Odds two residents are from different regions: 40.2%
> Pct. born abroad: 27.5%
> Pct. of foreign-born gained citizenship: 29.6%
> Origin of largest immigrant group: Mexico (94.6% of foreign-born)
Laredo is one of several cities along the U.S.-Mexico border to rank among the most diverse cities in America. Some 26.9% of the population was born in Latin America, the third largest share of any metro area and nearly four times the national figure. The city’s largest immigrant group is from Mexico, representing 94.6% of the foreign-born population.
Like other border cities, a large share of immigrants in Laredo live in poverty, and relatively few have naturalized. Just 29.6% of the foreign-born population has U.S. citizenship, far less than the 49.3% national naturalization rate.
[in-text-ad]

9. Naples-Immokalee-Marco Island, FL
> Odds two residents are from different regions: 40.7%
> Pct. born abroad: 25.7%
> Pct. of foreign-born gained citizenship: 40.8%
> Origin of largest immigrant group: Mexico (22.3% of foreign-born)
The Naples metro area is one of America’s fastest growing cities, due in no small part to international immigration. Since 2010, the population grew by 5.7% from international migration, more than double the comparable 2.4% increase nationwide. Today, immigrants account for 25.7% of the Naples metro area population, the 11th largest share in the country. European immigrants account for 3.2%, and Latin American immigrants for 19.8% — each among the largest such shares nationwide.
The largest share of foreign-born Naples residents — 22.3% — are from Mexico.
[recirclink id=492014]
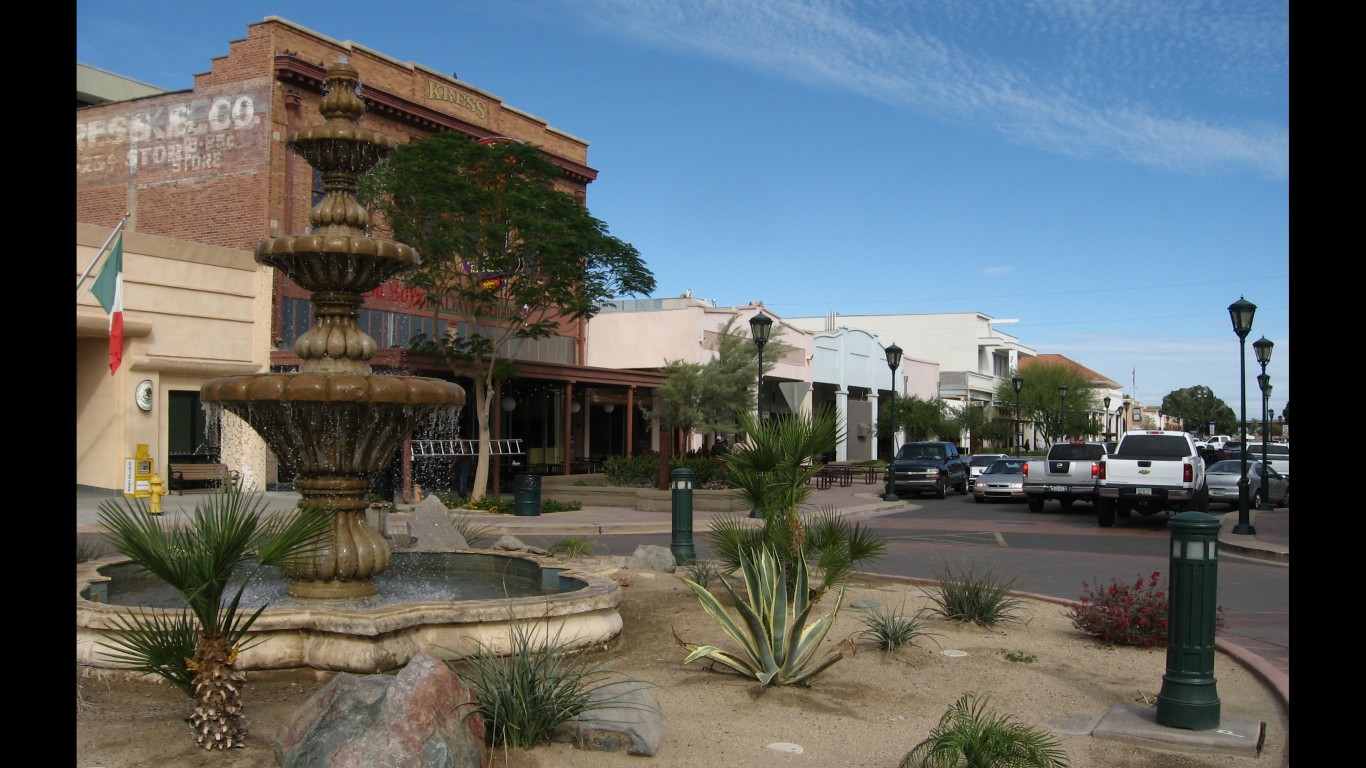
8. Yuma, AZ
> Odds two residents are from different regions: 41.7%
> Pct. born abroad: 27.5%
> Pct. of foreign-born gained citizenship: 43.6%
> Origin of largest immigrant group: Mexico (84.9% of foreign-born)
Laredo is one of several border cities to rank among the most diverse U.S. cities. Some 22.7% of the population was born in Mexico, the fifth largest share of any metro area and more than six times the national figure. While America’s melting pots tend to have smaller socioeconomic gaps between the native and foreign-born populations, immigrants in Yuma are much worse off than residents of the metro area who were born in the United States.
7. El Centro, CA
> Odds two residents are from different regions: 42.9%
> Pct. born abroad: 30.6%
> Pct. of foreign-born gained citizenship: 51.2%
> Origin of largest immigrant group: Mexico (93.0% of foreign-born)
Located in southern California, El Centro is one of several cities along the U.S.-Mexico border to rank among the most diverse cities in America. Over 30% of the metro area’s population was born in a foreign country — most commonly, Mexico. Immigrants from Mexico constitute 93.0% of the foreign-born population. Other Central and South American nationalities represented in El Centro’s population include El Salvador, Guatemala, Honduras, Nicaragua, and Panama. The metro area also has a small population of people born in Eastern Asia, from countries like China, Japan, and Korea.
[in-text-ad-2]
6. Salinas, CA
> Odds two residents are from different regions: 45.5%
> Pct. born abroad: 30.4%
> Pct. of foreign-born gained citizenship: 25.9%
> Origin of largest immigrant group: Mexico (74.6% of foreign-born)
In Salinas, there is a 45.5% chance that any two residents picked at random will be from different parts of the world, the sixth highest probability of any U.S. metro area. The city’s largest immigrant group is from Mexico, which accounts for 74.6% of the foreign-born population. One factor contributing to the size of the Mexican immigrant population is Monterey County’s agriculture industry, which produces 61% of the nation’s leaf lettuce, 57% of its celery, and 48% of its broccoli.

5. New York-Newark-Jersey City, NY-NJ-PA
> Odds two residents are from different regions: 46.8%
> Pct. born abroad: 29.2%
> Pct. of foreign-born gained citizenship: 56.2%
> Origin of largest immigrant group: Dominican Republic (10.8% of foreign-born)
The port of entry to the United States during the country’s major immigration waves of the 19th and early 20th centuries, the New York metro area is one of the most diverse in the nation. The city’s largest immigrant group is from the Dominican Republic, which constitutes 10.8% of the foreign-born population. New York is home to some of the nation’s most concentrated ethnic enclaves. Examples include Little Italy, Chinatown, and Koreatown in Manhattan; Little Odessa and Little Poland in Brooklyn; and Little India and Little Guyana in Queens.
[in-text-ad]

4. San Francisco-Oakland-Hayward, CA
> Odds two residents are from different regions: 48.8%
> Pct. born abroad: 31.3%
> Pct. of foreign-born gained citizenship: 55.7%
> Origin of largest immigrant group: China (20.3% of foreign-born)
San Francisco served as the port of entry to the United States for most Chinese immigrants during the mid-19th century. Many early Chinese immigrants found work as farm laborers or workers on the Central Pacific and Transcontinental railroads and settled in the district today known as Chinatown. Chinese immigrants today constitute 20.3% of the San Francisco foreign-born population, the most of any country. Other major immigrant groups include residents from Mexico, the Philippines, India, and Vietnam.
[recirclink id=545465]
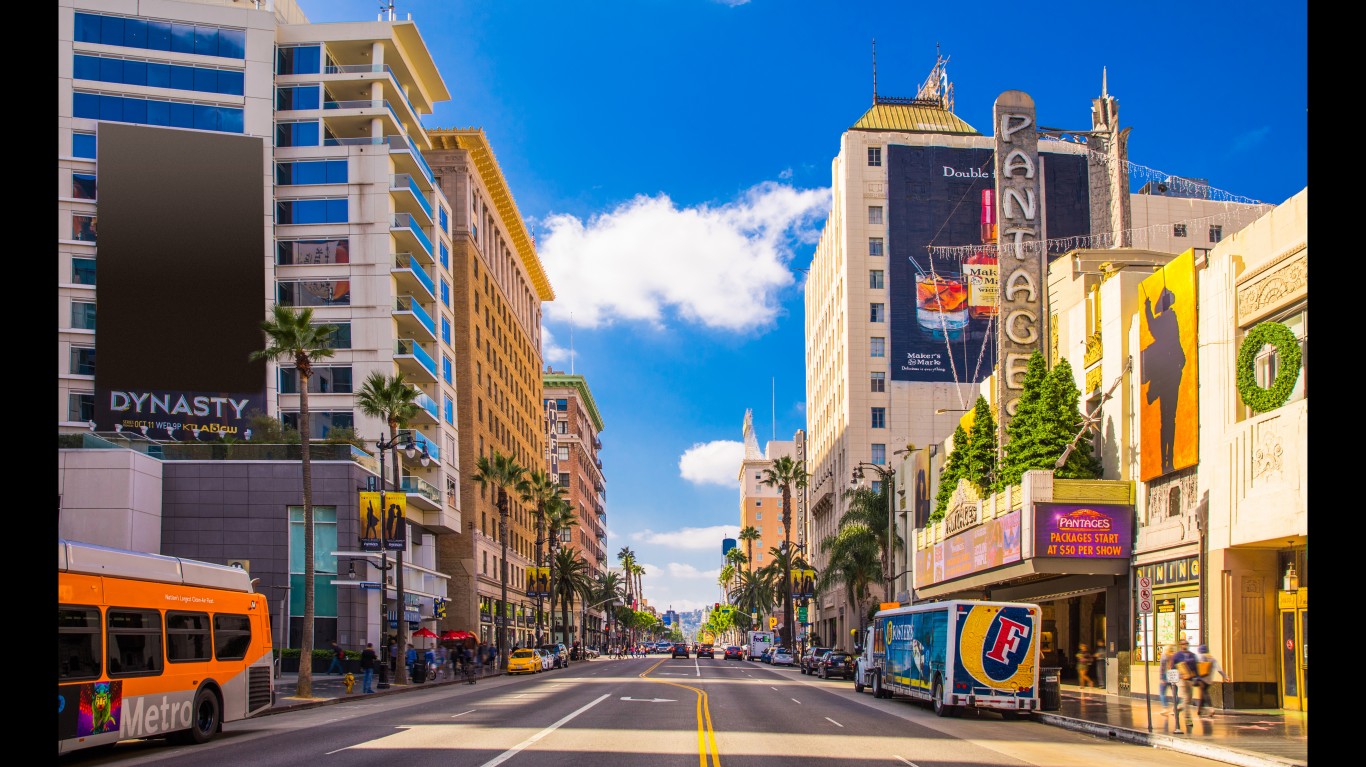
3. Los Angeles-Long Beach-Anaheim, CA
> Odds two residents are from different regions: 50.7%
> Pct. born abroad: 33.3%
> Pct. of foreign-born gained citizenship: 53.0%
> Origin of largest immigrant group: Mexico (37.8% of foreign-born)
The chance of two random residents in Los Angeles being from different continents is 50.7%, more than twice the national probability of 24.8%. One major wave of immigration occurred in the mid-19th century, as Chinese laborers were brought to the city to work as farmhands and workers on the Southern Pacific Railroad. In the early 20th century, a large influx of immigrants from Mexico settled in the city, seeking economic opportunity and fleeing the violence of the Mexican Revolution of 1910. Today, Mexican residents account for 37.8% of the foreign-born population in Los Angeles, the largest share of any immigrant group. Other major immigrant groups in the city include residents from China, the Philippines, El Salvador, Vietnam, and Korea.

2. Miami-Fort Lauderdale-West Palm Beach, FL
> Odds two residents are from different regions: 52.3%
> Pct. born abroad: 41.0%
> Pct. of foreign-born gained citizenship: 57.1%
> Origin of largest immigrant group: Cuba (32.4% of foreign-born)
The main port of entry for Caribbean migrants into the United States, Miami is one of the most diverse cities in the country. There is a 52.3% chance that two random residents are from different parts of the world, more than twice the national probability of 24.8%. One of the major waves of immigration occurred in the wake of the 1959 Cuban Revolution, when the number of Cuban admissions to the United States more than doubled. Many settled in the west downtown neighborhood today known as Little Havana.
Today, Cuban immigrants constitute 32.4% of the Miami foreign-born population, by far the largest share of any city. Other major immigrant groups include residents from Haiti, Colombia, Jamaica, and Nicaragua.
[in-text-ad-2]
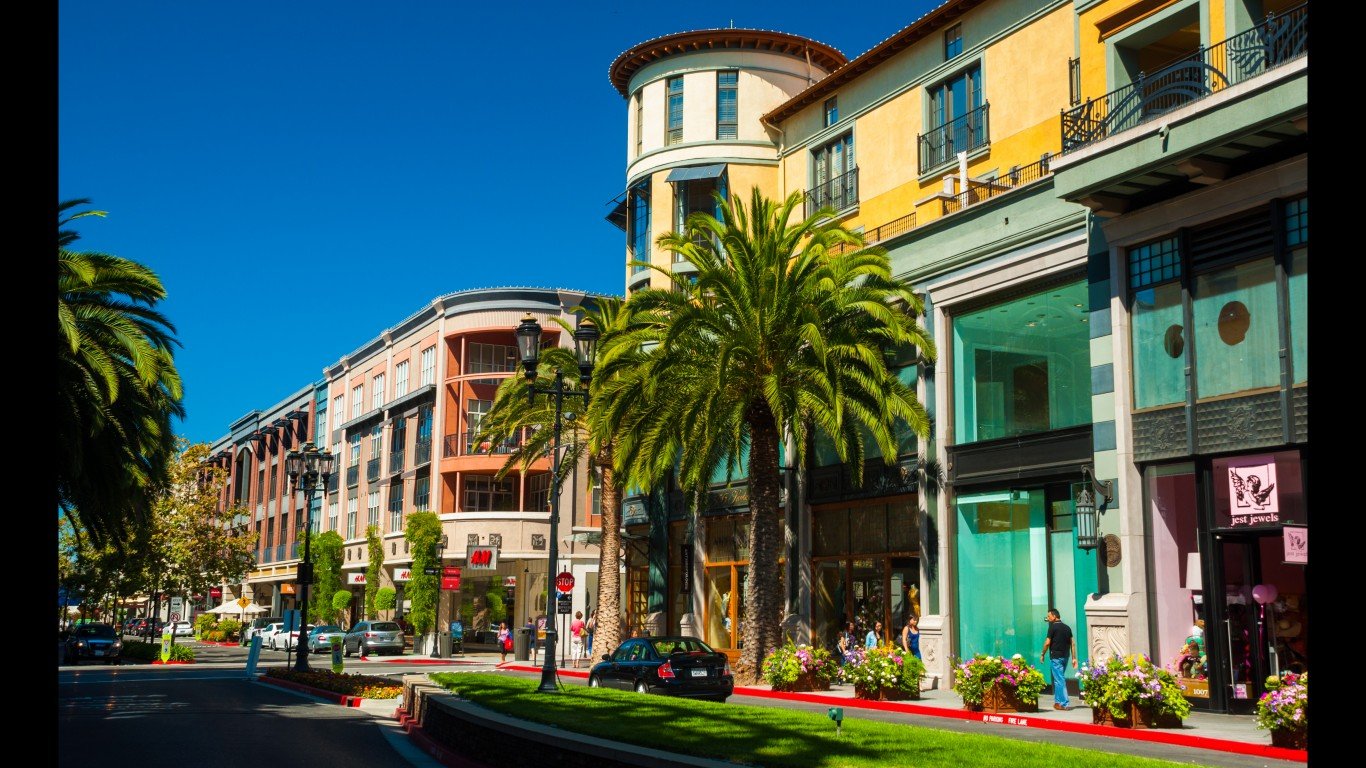
1. San Jose-Sunnyvale-Santa Clara, CA
> Odds two residents are from different regions: 55.4%
> Pct. born abroad: 38.9%
> Pct. of foreign-born gained citizenship: 53.3%
> Origin of largest immigrant group: Mexico (19.9% of foreign-born)
There is a 55.4% chance that two residents in San Jose are from different parts of the world, the highest probability of any city. There was a major wave of immigration between the late 19th and early 20th centuries, as large numbers of Mexican and Chinese immigrants moved to the Santa Clara Valley to work in the mining and agriculture sectors. More recently, international immigration has been driven by the city’s booming tech industry. San Jose is home to over 800 high tech companies, which have attracted large numbers of migrants from all over the world, particularly India. Today, Indian immigrants account for 15.8% of the city’s foreign-born population, the second largest share of any immigrant group. Mexican immigrants account for 19.9%, the largest share.
Methodology
To determine America’s melting pot cities, 24/7 Wall St. ranked metro areas based on the likelihood that two residents picked at random would be from two different world regions: the United States, Europe, Asia, Africa, Oceania, Latin America, and other parts of North America. The measure refers to the birthplace of the current residents. The index is based on the share of residents of a specific national origin with 5-year data from the U.S. Census Bureau’s 2017 American Community Survey and is the sum total of the individual probabilities that two residents will not share a national origin. The same method is used in the USA Today Diversity Index. Supplemental data on race, ancestry, income, poverty, and population also came from the Census Bureau. Data on unemployment came from the Bureau of Labor Statistics and is seasonally adjusted for June 2019. Data on regional price parity, or cost of living, came from the Bureau of Economic Analysis and is for 2017.
Contact [email protected] for any questions or corrections.