Motor vehicle theft, one of the most serious offenses tracked by the FBI, is on the rise in the United States. There were a total of 810,400 motor vehicle thefts nationwide in 2020, the most in over a decade.
Motor vehicle theft can be either the theft or attempted theft of a vehicle, such as a car, truck, ATV, or motorcycle. Some experts attribute the rising rates of vehicle theft to the COVID-19 pandemic, which led to vehicles sitting unattended and unused for longer than usual. Additionally, vehicle theft is often committed for monetary gain, and the pandemic sent unemployment soaring and left many Americans struggling financially.
While motorists nationwide now face a greater risk of vehicle theft than they have in many years, in some parts of the country, car owners are far more likely to be victims of car theft than in others.
Using data from the FBI’s 2020 Uniform Crime Report, 24/7 Wall St. identified the 50 cities where your car is most likely to be stolen. Cities, defined as places with populations greater than 25,000, are ranked by the number of motor vehicle thefts reported for every 100,000 people.
In every city on this list, vehicle theft rates are far higher than — and in some cases more than five times — the national rate of 246 incidents per 100,000 people. Most of the cities on this list are in the West, including 15 in California alone.
Motor vehicle theft — along with larceny and burglary — is one of three criminal offenses that comprise the property crime category. Due in large part to higher than average vehicle theft rates, in every city on this list, the overall property crime rate exceeds the national rate of 1,958 incidents per 100,000 people. Here is a look at the 10 most stolen cars in America.
Click here to see cities where your car is most likely to be stolen
Click here to see our detailed methodology
50. Gardena, California
> 2020 vehicle thefts per 100K people: 791.4
> Total vehicle thefts: 470 — 182nd highest of 1,446 cities (tied)
> Property crimes per 100K people: 2,229.5 — 544th highest of 1,361 cities
> Total property crimes: 1,324 — 535th highest of 1,361 cities (tied)
> Population: 59,709
[in-text-ad]
49. Raytown, Missouri
> 2020 vehicle thefts per 100K people: 795.2
> Total vehicle thefts: 230 — 385th highest of 1,446 cities (tied)
> Property crimes per 100K people: 4,052.3 — 102nd highest of 1,361 cities
> Total property crimes: 1,172 — 613th highest of 1,361 cities (tied)
> Population: 29,264
[recirclink id=997124]

48. Auburn, Washington
> 2020 vehicle thefts per 100K people: 797.3
> Total vehicle thefts: 660 — 131st highest of 1,446 cities
> Property crimes per 100K people: 4,100.1 — 96th highest of 1,361 cities
> Total property crimes: 3,394 — 181st highest of 1,361 cities (tied)
> Population: 80,134
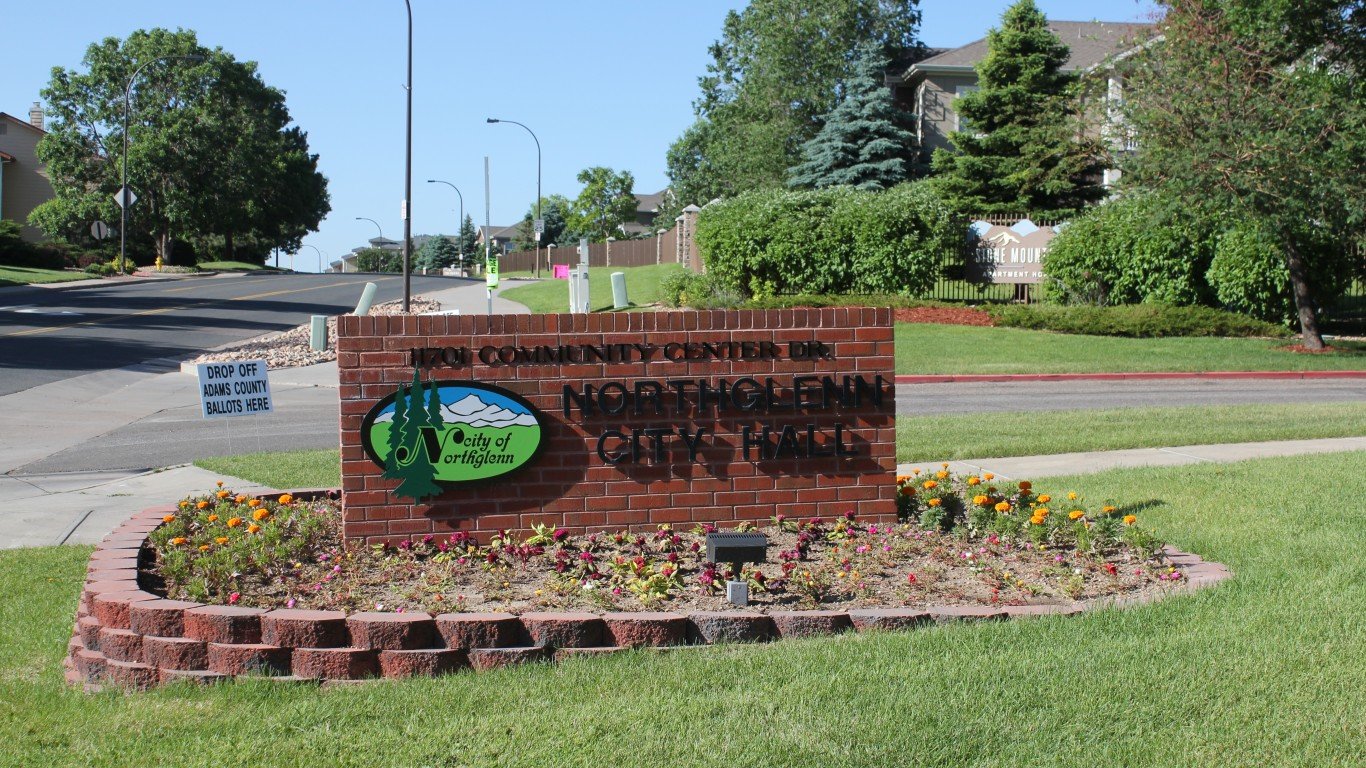
47. Northglenn, Colorado
> 2020 vehicle thefts per 100K people: 799.3
> Total vehicle thefts: 313 — 285th highest of 1,446 cities (tied)
> Property crimes per 100K people: 3,695.0 — 135th highest of 1,361 cities
> Total property crimes: 1,447 — 492nd highest of 1,361 cities (tied)
> Population: 38,973
[in-text-ad-2]
46. Florissant, Missouri
> 2020 vehicle thefts per 100K people: 801.0
> Total vehicle thefts: 407 — 228th highest of 1,446 cities (tied)
> Property crimes per 100K people: 2,296.7 — 506th highest of 1,361 cities
> Total property crimes: 1,167 — 616th highest of 1,361 cities (tied)
> Population: 51,455
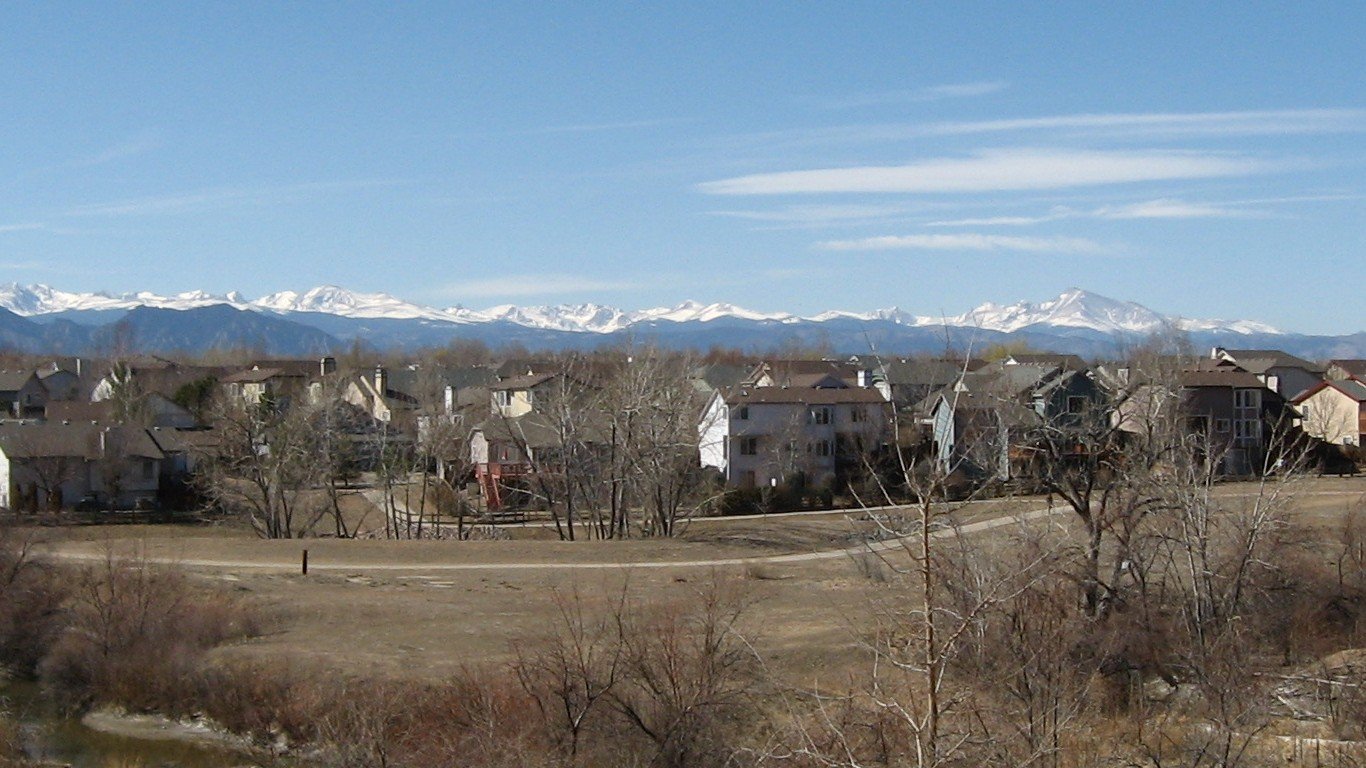
45. Westminster, Colorado
> 2020 vehicle thefts per 100K people: 818.8
> Total vehicle thefts: 933 — 95th highest of 1,446 cities
> Property crimes per 100K people: 3,539.6 — 159th highest of 1,361 cities
> Total property crimes: 4,033 — 141st highest of 1,361 cities
> Population: 112,962
[in-text-ad]

44. Inglewood, California
> 2020 vehicle thefts per 100K people: 823.3
> Total vehicle thefts: 889 — 101st highest of 1,446 cities
> Property crimes per 100K people: 2,310.5 — 499th highest of 1,361 cities
> Total property crimes: 2,495 — 270th highest of 1,361 cities (tied)
> Population: 109,613
[recirclink id=1000581]

43. Gresham, Oregon
> 2020 vehicle thefts per 100K people: 825.4
> Total vehicle thefts: 906 — 100th highest of 1,446 cities
> Property crimes per 100K people: 2,804.1 — 327th highest of 1,361 cities
> Total property crimes: 3,078 — 214th highest of 1,361 cities (tied)
> Population: 110,494

42. Balch Springs, Texas
> 2020 vehicle thefts per 100K people: 829.7
> Total vehicle thefts: 209 — 412th highest of 1,446 cities (tied)
> Property crimes per 100K people: 3,263.3 — 219th highest of 1,361 cities
> Total property crimes: 822 — 556th lowest of 1,361 cities
> Population: 25,190
[in-text-ad-2]
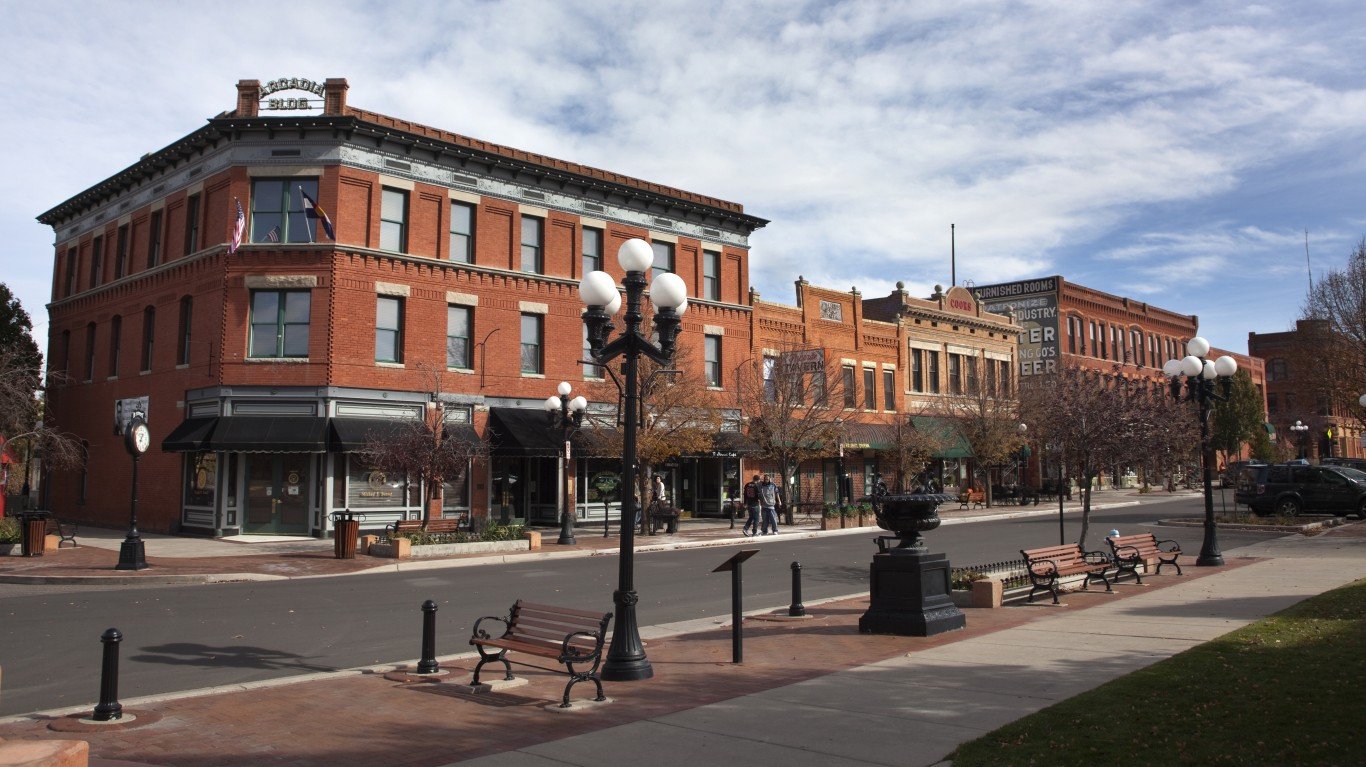
41. Pueblo, Colorado
> 2020 vehicle thefts per 100K people: 830.1
> Total vehicle thefts: 938 — 94th highest of 1,446 cities
> Property crimes per 100K people: 4,630.9 — 55th highest of 1,361 cities
> Total property crimes: 5,233 — 109th highest of 1,361 cities
> Population: 110,841

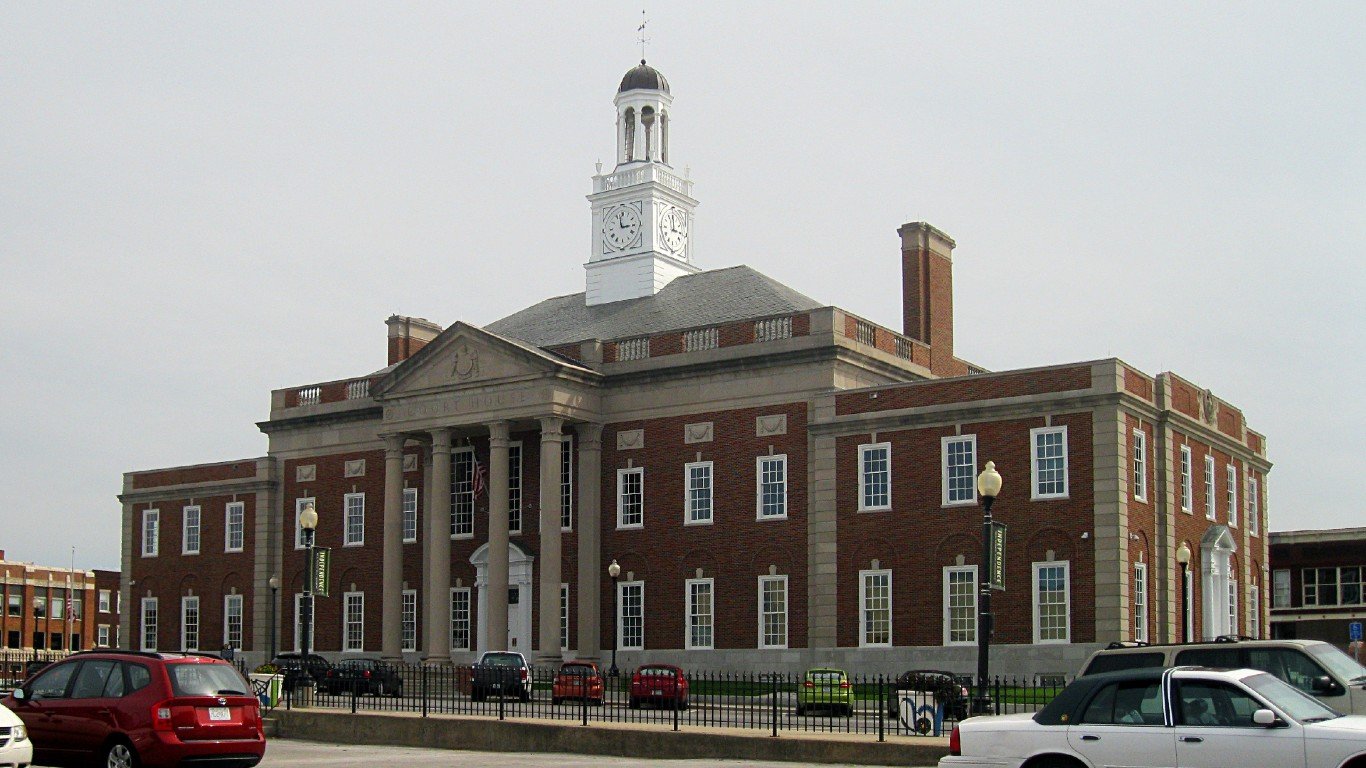
40. Independence, Missouri
> 2020 vehicle thefts per 100K people: 835.8
> Total vehicle thefts: 975 — 87th highest of 1,446 cities
> Property crimes per 100K people: 4,576.2 — 61st highest of 1,361 cities
> Total property crimes: 5,338 — 107th highest of 1,361 cities
> Population: 117,084
[in-text-ad]

39. Detroit, Michigan
> 2020 vehicle thefts per 100K people: 845.6
> Total vehicle thefts: 5,578 — 14th highest of 1,446 cities
> Property crimes per 100K people: 3,210.7 — 225th highest of 1,361 cities
> Total property crimes: 21,178 — 26th highest of 1,361 cities
> Population: 674,841
[recirclink id=1007332]

38. Grandview, Missouri
> 2020 vehicle thefts per 100K people: 847.5
> Total vehicle thefts: 211 — 408th highest of 1,446 cities (tied)
> Property crimes per 100K people: 4,169.0 — 89th highest of 1,361 cities
> Total property crimes: 1,038 — 680th lowest of 1,361 cities
> Population: 25,069

37. San Rafael, California
> 2020 vehicle thefts per 100K people: 854.5
> Total vehicle thefts: 500 — 174th highest of 1,446 cities
> Property crimes per 100K people: 3,267.7 — 216th highest of 1,361 cities
> Total property crimes: 1,912 — 371st highest of 1,361 cities
> Population: 58,775
[in-text-ad-2]

36. Vallejo, California
> 2020 vehicle thefts per 100K people: 872.3
> Total vehicle thefts: 1,067 — 77th highest of 1,446 cities
> Property crimes per 100K people: 3,333.7 — 197th highest of 1,361 cities
> Total property crimes: 4,078 — 140th highest of 1,361 cities
> Population: 121,267

35. Lakewood, Colorado
> 2020 vehicle thefts per 100K people: 872.8
> Total vehicle thefts: 1,394 — 58th highest of 1,446 cities
> Property crimes per 100K people: 5,040.1 — 34th highest of 1,361 cities
> Total property crimes: 8,050 — 69th highest of 1,361 cities
> Population: 155,146
[in-text-ad]

34. Compton, California
> 2020 vehicle thefts per 100K people: 877.4
> Total vehicle thefts: 838 — 105th highest of 1,446 cities
> Property crimes per 100K people: 2,354.7 — 476th highest of 1,361 cities
> Total property crimes: 2,249 — 307th highest of 1,361 cities
> Population: 96,803
[recirclink id=1011842]
33. Calumet City, Illinois
> 2020 vehicle thefts per 100K people: 880.4
> Total vehicle thefts: 315 — 284th highest of 1,446 cities
> Property crimes per 100K people: N/A
> Total property crimes: N/A
> Population: 36,551

32. Albuquerque, New Mexico
> 2020 vehicle thefts per 100K people: 883.3
> Total vehicle thefts: 4,965 — 16th highest of 1,446 cities
> Property crimes per 100K people: 5,012.1 — 37th highest of 1,361 cities
> Total property crimes: 28,171 — 17th highest of 1,361 cities
> Population: 559,374
[in-text-ad-2]

31. New Orleans, Louisiana
> 2020 vehicle thefts per 100K people: 894.9
> Total vehicle thefts: 3,524 — 28th highest of 1,446 cities
> Property crimes per 100K people: 4,539.6 — 64th highest of 1,361 cities
> Total property crimes: 17,876 — 31st highest of 1,361 cities
> Population: 390,845

30. Kansas City, Missouri
> 2020 vehicle thefts per 100K people: 909.2
> Total vehicle thefts: 4,540 — 19th highest of 1,446 cities
> Property crimes per 100K people: 4,119.5 — 94th highest of 1,361 cities
> Total property crimes: 20,570 — 27th highest of 1,361 cities
> Population: 486,404
[in-text-ad]

29. Minneapolis, Minnesota
> 2020 vehicle thefts per 100K people: 911.3
> Total vehicle thefts: 3,965 — 23rd highest of 1,446 cities
> Property crimes per 100K people: 4,558.1 — 62nd highest of 1,361 cities
> Total property crimes: 19,833 — 30th highest of 1,361 cities
> Population: 420,324
[recirclink id=1011738]

28. St. Paul, Minnesota
> 2020 vehicle thefts per 100K people: 913.0
> Total vehicle thefts: 2,829 — 38th highest of 1,446 cities
> Property crimes per 100K people: 3,802.7 — 124th highest of 1,361 cities
> Total property crimes: 11,783 — 46th highest of 1,361 cities
> Population: 304,547
27. Commerce City, Colorado
> 2020 vehicle thefts per 100K people: 920.1
> Total vehicle thefts: 572 — 150th highest of 1,446 cities
> Property crimes per 100K people: 3,299.3 — 209th highest of 1,361 cities
> Total property crimes: 2,051 — 343rd highest of 1,361 cities
> Population: 56,448
[in-text-ad-2]

26. South Gate, California
> 2020 vehicle thefts per 100K people: 932.1
> Total vehicle thefts: 870 — 103rd highest of 1,446 cities
> Property crimes per 100K people: 3,156.3 — 243rd highest of 1,361 cities
> Total property crimes: 2,946 — 227th highest of 1,361 cities
> Population: 94,642

25. Burien, Washington
> 2020 vehicle thefts per 100K people: 932.9
> Total vehicle thefts: 484 — 180th highest of 1,446 cities
> Property crimes per 100K people: 4,207.9 — 86th highest of 1,361 cities
> Total property crimes: 2,183 — 318th highest of 1,361 cities
> Population: 51,477
[in-text-ad]
24. Santa Maria, California
> 2020 vehicle thefts per 100K people: 952.5
> Total vehicle thefts: 1,030 — 83rd highest of 1,446 cities
> Property crimes per 100K people: 2,285.9 — 510th highest of 1,361 cities
> Total property crimes: 2,472 — 275th highest of 1,361 cities
> Population: 106,224
[recirclink id=997124]
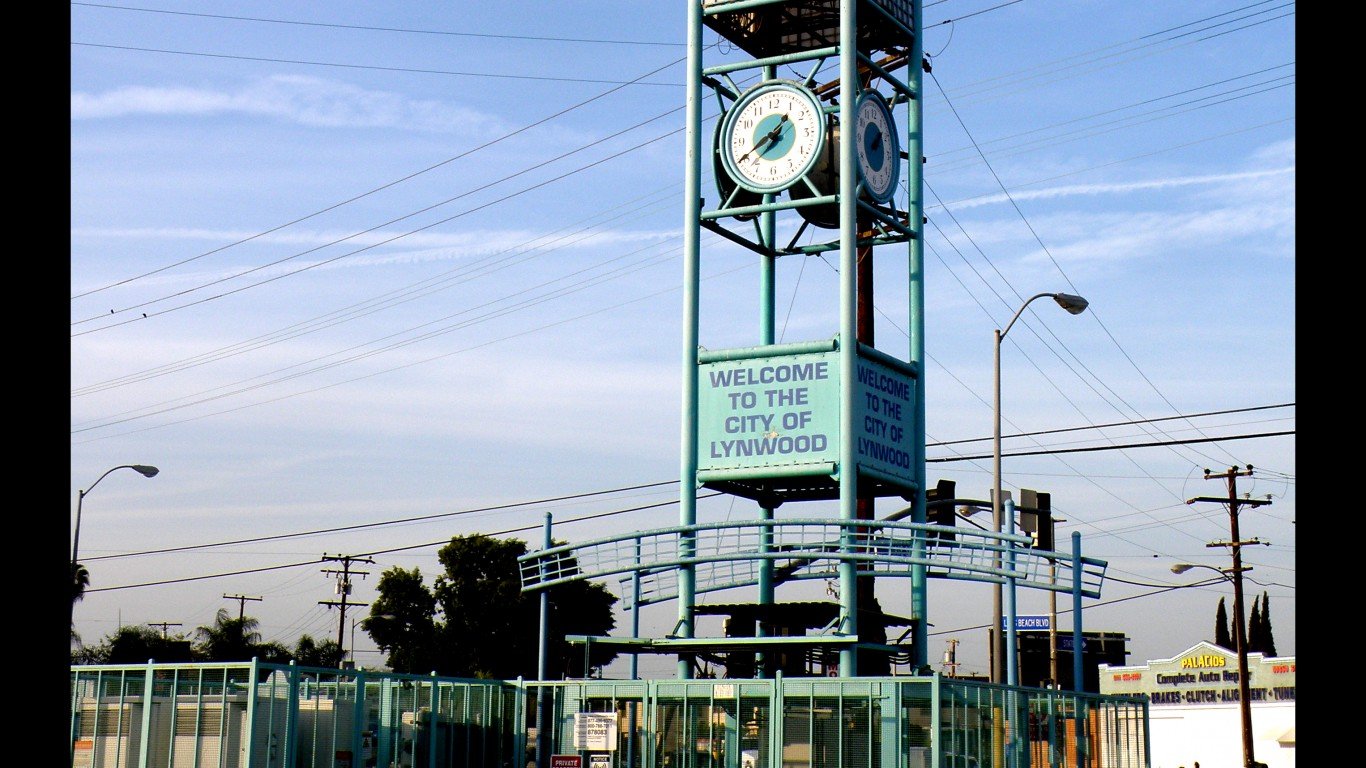
23. Lynwood, California
> 2020 vehicle thefts per 100K people: 956.8
> Total vehicle thefts: 669 — 130th highest of 1,446 cities
> Property crimes per 100K people: 2,161.0 — 566th highest of 1,361 cities
> Total property crimes: 1,511 — 469th highest of 1,361 cities
> Population: 70,635

22. Portland, Oregon
> 2020 vehicle thefts per 100K people: 960.9
> Total vehicle thefts: 6,370 — 12th highest of 1,446 cities
> Property crimes per 100K people: 4,738.9 — 51st highest of 1,361 cities
> Total property crimes: 31,416 — 14th highest of 1,361 cities
> Population: 645,291
[in-text-ad-2]

21. Tulsa, Oklahoma
> 2020 vehicle thefts per 100K people: 970.7
> Total vehicle thefts: 3,904 — 25th highest of 1,446 cities
> Property crimes per 100K people: 5,111.6 — 32nd highest of 1,361 cities
> Total property crimes: 20,557 — 28th highest of 1,361 cities
> Population: 402,324

20. Woodburn, Oregon
> 2020 vehicle thefts per 100K people: 980.4
> Total vehicle thefts: 260 — 338th highest of 1,446 cities (tied)
> Property crimes per 100K people: 3,288.0 — 211th highest of 1,361 cities
> Total property crimes: 872 — 588th lowest of 1,361 cities (tied)
> Population: 25,738
[in-text-ad]

19. San Pablo, California
> 2020 vehicle thefts per 100K people: 981.9
> Total vehicle thefts: 306 — 293rd highest of 1,446 cities
> Property crimes per 100K people: 2,740.3 — 352nd highest of 1,361 cities
> Total property crimes: 854 — 570th lowest of 1,361 cities (tied)
> Population: 30,967
[recirclink id=1000581]

18. Tacoma, Washington
> 2020 vehicle thefts per 100K people: 985.4
> Total vehicle thefts: 2,169 — 44th highest of 1,446 cities
> Property crimes per 100K people: 5,507.4 — 22nd highest of 1,361 cities
> Total property crimes: 12,123 — 45th highest of 1,361 cities
> Population: 212,869

17. Bakersfield, California
> 2020 vehicle thefts per 100K people: 986.2
> Total vehicle thefts: 3,829 — 26th highest of 1,446 cities
> Property crimes per 100K people: 4,022.8 — 107th highest of 1,361 cities
> Total property crimes: 15,619 — 36th highest of 1,361 cities
> Population: 377,917
[in-text-ad-2]

16. Aurora, Colorado
> 2020 vehicle thefts per 100K people: 1,018.6
> Total vehicle thefts: 3,929 — 24th highest of 1,446 cities
> Property crimes per 100K people: 3,390.8 — 189th highest of 1,361 cities
> Total property crimes: 13,079 — 42nd highest of 1,361 cities
> Population: 369,111

15. St. Louis, Missouri
> 2020 vehicle thefts per 100K people: 1,079.3
> Total vehicle thefts: 3,221 — 31st highest of 1,446 cities
> Property crimes per 100K people: 5,830.3 — 15th highest of 1,361 cities
> Total property crimes: 17,399 — 32nd highest of 1,361 cities
> Population: 308,174
[in-text-ad]

14. Salt Lake City, Utah
> 2020 vehicle thefts per 100K people: 1,084.1
> Total vehicle thefts: 2,192 — 43rd highest of 1,446 cities
> Property crimes per 100K people: 7,352.1 — 3rd highest of 1,361 cities
> Total property crimes: 14,865 — 39th highest of 1,361 cities
> Population: 197,756
[recirclink id=1007332]

13. Hazelwood, Missouri
> 2020 vehicle thefts per 100K people: 1,097.8
> Total vehicle thefts: 275 — 318th highest of 1,446 cities
> Property crimes per 100K people: 3,149.6 — 244th highest of 1,361 cities
> Total property crimes: 789 — 526th lowest of 1,361 cities
> Population: 25,319

12. Englewood, Colorado
> 2020 vehicle thefts per 100K people: 1,108.2
> Total vehicle thefts: 393 — 234th highest of 1,446 cities
> Property crimes per 100K people: 5,667.7 — 19th highest of 1,361 cities
> Total property crimes: 2,010 — 349th highest of 1,361 cities (tied)
> Population: 34,259
[in-text-ad-2]

11. Huntington Park, California
> 2020 vehicle thefts per 100K people: 1,128.1
> Total vehicle thefts: 648 — 133rd highest of 1,446 cities (tied)
> Property crimes per 100K people: 2,994.3 — 279th highest of 1,361 cities
> Total property crimes: 1,720 — 408th highest of 1,361 cities
> Population: 58,353
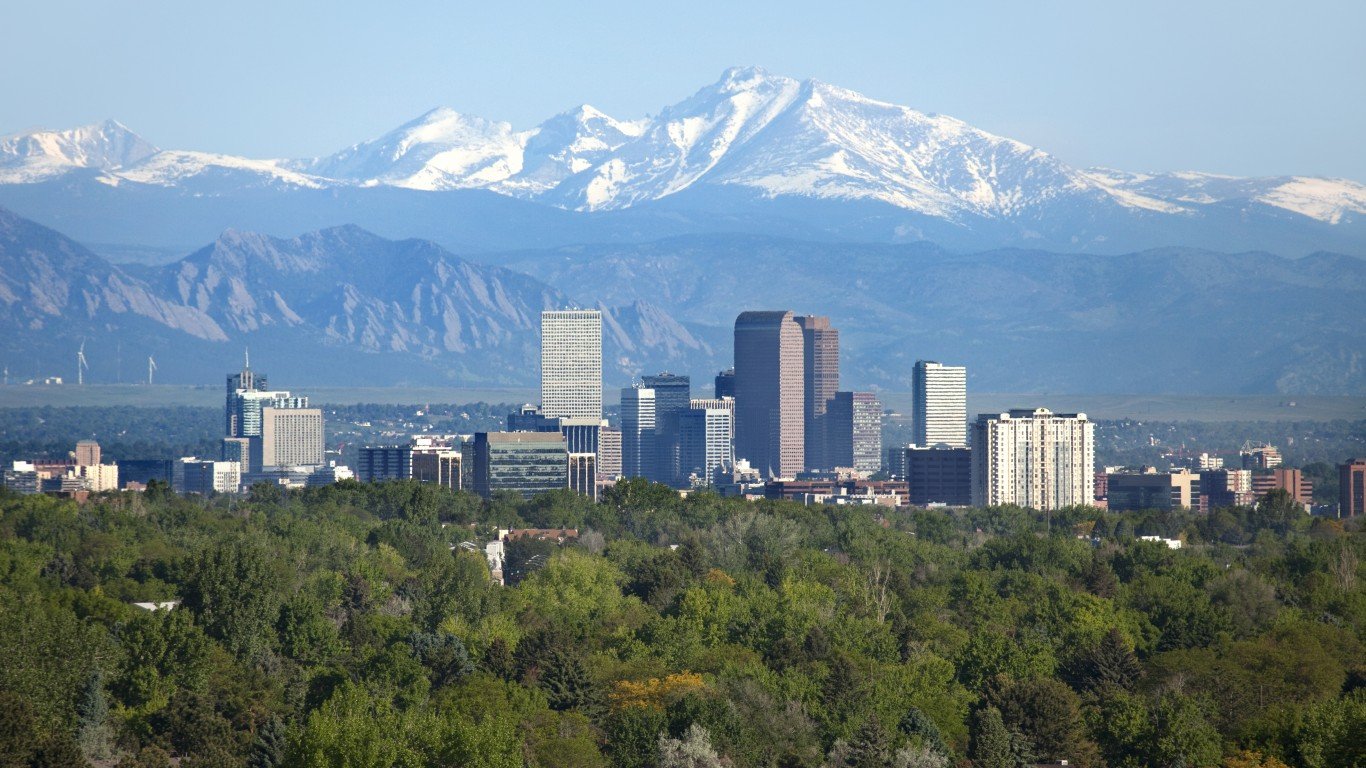
10. Denver, Colorado
> 2020 vehicle thefts per 100K people: 1,139.9
> Total vehicle thefts: 8,409 — 6th highest of 1,446 cities
> Property crimes per 100K people: 4,648.7 — 53rd highest of 1,361 cities
> Total property crimes: 34,294 — 12th highest of 1,361 cities
> Population: 705,576
[in-text-ad]

9. Chattanooga, Tennessee
> 2020 vehicle thefts per 100K people: 1,140.5
> Total vehicle thefts: 2,101 — 45th highest of 1,446 cities
> Property crimes per 100K people: 6,356.3 — 9th highest of 1,361 cities
> Total property crimes: 11,709 — 48th highest of 1,361 cities
> Population: 179,690
[recirclink id=1011842]

8. Hayward, California
> 2020 vehicle thefts per 100K people: 1,167.2
> Total vehicle thefts: 1,878 — 47th highest of 1,446 cities (tied)
> Property crimes per 100K people: 3,325.2 — 200th highest of 1,361 cities
> Total property crimes: 5,350 — 105th highest of 1,361 cities
> Population: 159,293
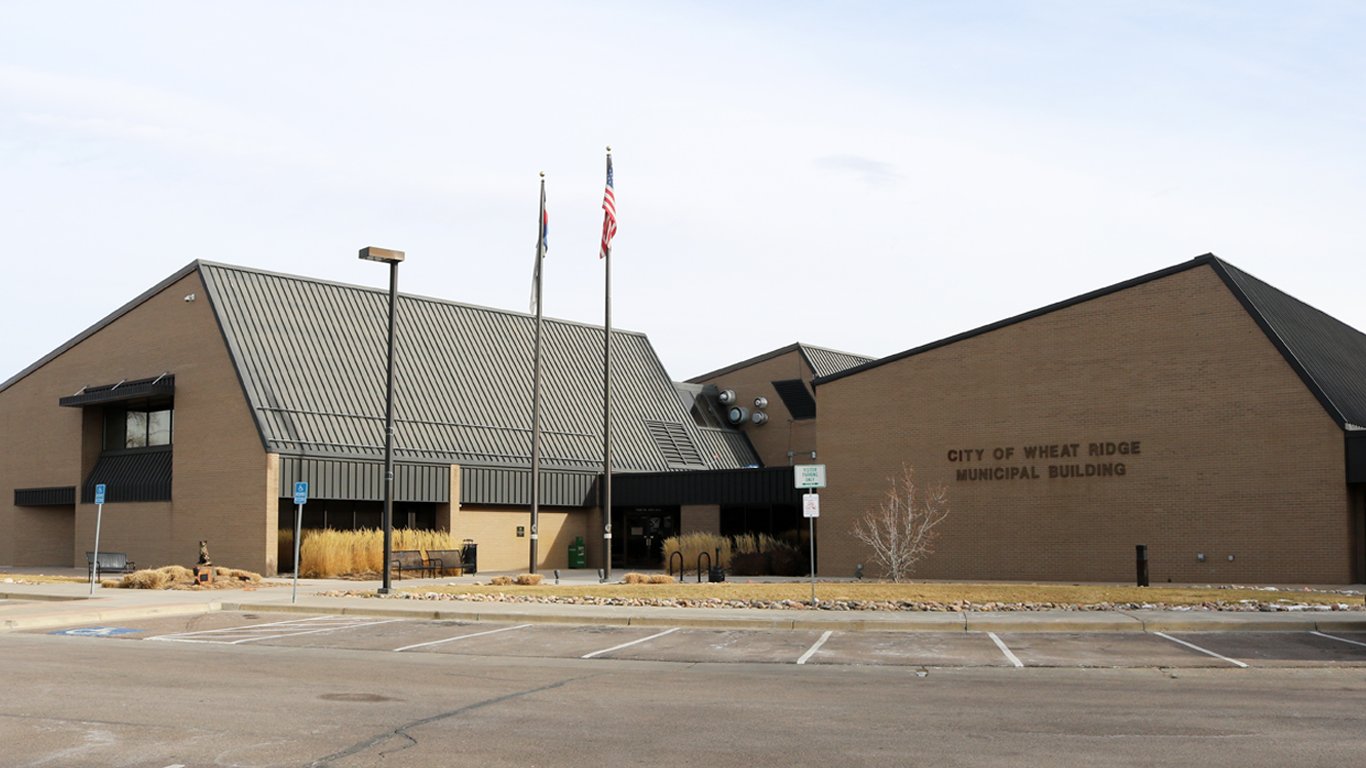
7. Wheat Ridge, Colorado
> 2020 vehicle thefts per 100K people: 1,173.3
> Total vehicle thefts: 369 — 245th highest of 1,446 cities (tied)
> Property crimes per 100K people: 5,322.6 — 23rd highest of 1,361 cities
> Total property crimes: 1,674 — 425th highest of 1,361 cities
> Population: 31,331
[in-text-ad-2]

6. San Leandro, California
> 2020 vehicle thefts per 100K people: 1,181.1
> Total vehicle thefts: 1,054 — 81st highest of 1,446 cities
> Property crimes per 100K people: 3,827.9 — 122nd highest of 1,361 cities
> Total property crimes: 3,416 — 179th highest of 1,361 cities
> Population: 90,025
5. Murray, Utah
> 2020 vehicle thefts per 100K people: 1,197.9
> Total vehicle thefts: 589 — 147th highest of 1,446 cities
> Property crimes per 100K people: 6,652.6 — 6th highest of 1,361 cities
> Total property crimes: 3,271 — 191st highest of 1,361 cities
> Population: 49,105
[in-text-ad]

4. SeaTac, Washington
> 2020 vehicle thefts per 100K people: 1,236.3
> Total vehicle thefts: 362 — 248th highest of 1,446 cities (tied)
> Property crimes per 100K people: 4,760.6 — 50th highest of 1,361 cities
> Total property crimes: 1,394 — 510th highest of 1,361 cities
> Population: 29,019
[recirclink id=1011738]
3. Richmond, California
> 2020 vehicle thefts per 100K people: 1,356.8
> Total vehicle thefts: 1,511 — 54th highest of 1,446 cities
> Property crimes per 100K people: 3,303.5 — 207th highest of 1,361 cities
> Total property crimes: 3,679 — 167th highest of 1,361 cities
> Population: 109,884

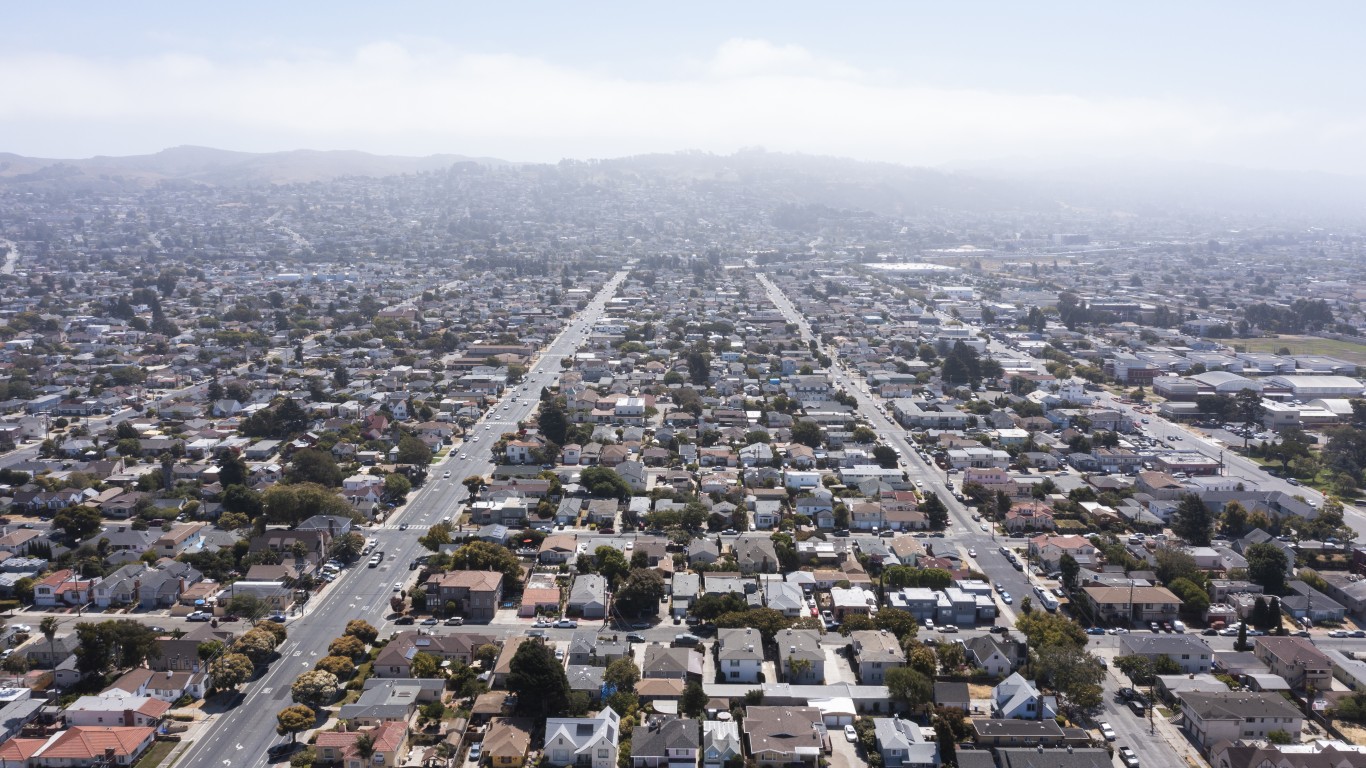
2. Oakland, California
> 2020 vehicle thefts per 100K people: 1,532.7
> Total vehicle thefts: 6,712 — 11th highest of 1,446 cities
> Property crimes per 100K people: 5,165.7 — 27th highest of 1,361 cities
> Total property crimes: 22,622 — 25th highest of 1,361 cities
> Population: 425,097
[in-text-ad-2]

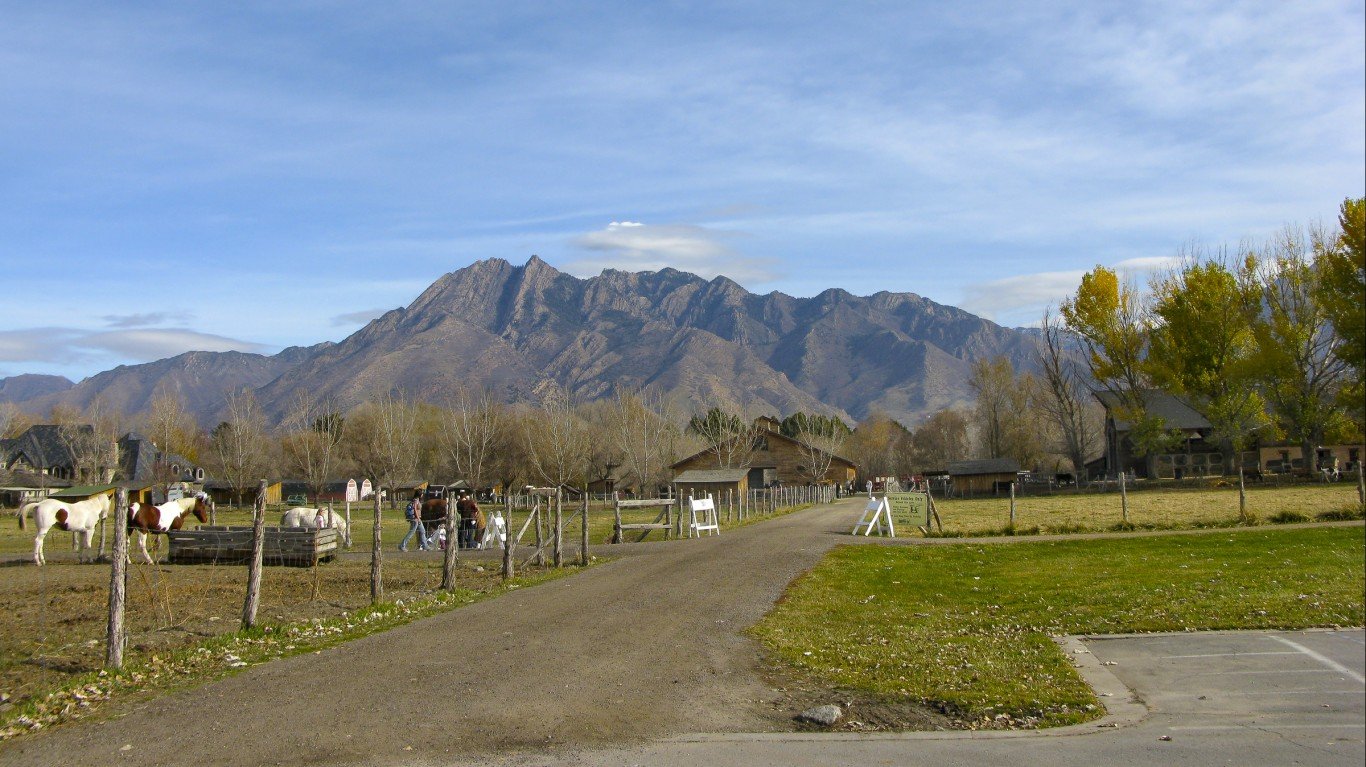
1. South Salt Lake, Utah
> 2020 vehicle thefts per 100K people: 1,789.6
> Total vehicle thefts: 462 — 190th highest of 1,446 cities
> Property crimes per 100K people: 9,203.6 — the highest of 1,361 cities
> Total property crimes: 2,376 — 290th highest of 1,361 cities
> Population: 25,017
Methodology
To determine the cities where your car is most likely to be stolen, 24/7 Wall St. reviewed motor vehicle theft figures from the FBI’s 2020 Uniform Crime Report.
We included cities that have more than 25,000 people based on five-year estimates from the U.S. Census Bureau’s 2019 American Community Survey. Limited data was available in the 2020 UCR for areas in Alabama, Maryland, Pennsylvania, and Illinois, though cities in these states were not excluded from analysis.
Data for property crime — a category that includes larceny-theft, burglary, and motor vehicle theft — also came from the 2020 FBI UCR. Population figures are five-year estimates from the U.S. Census Bureau’s 2019 American Community Survey. However, these estimates were not used to calculate crime rates. Crime rates per 100,000 people were calculated using population figures provided by the FBI in the 2020 UCR.
Contact [email protected] for any questions or corrections.