 Despite signs of economic recovery, the number of U.S. residents living in poverty remains stubbornly high. An average of 15.7% of the U.S. population lived below the poverty line during the three-year period of 2010-2012, a considerable increase from an average of 13.6% during the previous three-year period of 2007-2009.
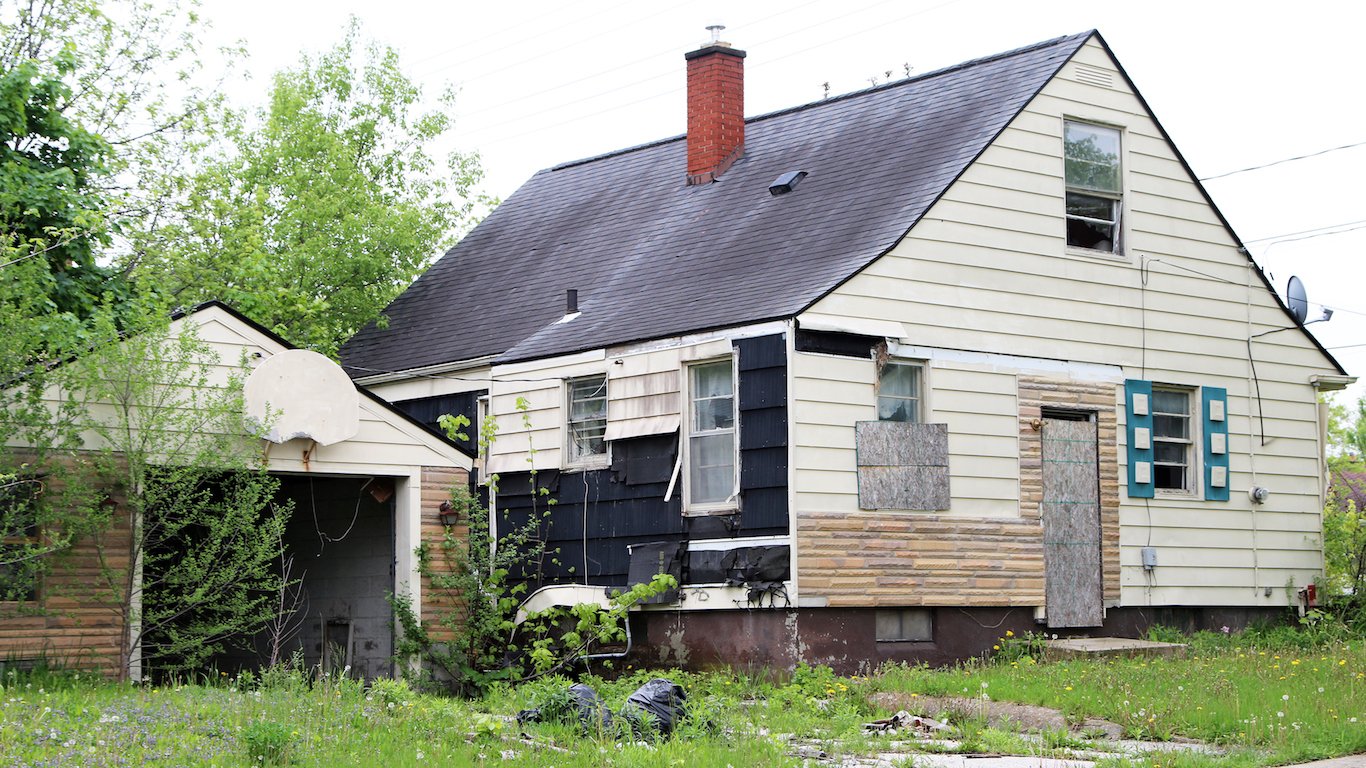
In some of the nation’s smaller cities, poverty is an even more severe problem. In Eastpointe, Michigan, the poverty rate rose from 12.2% during 2007-2009, slightly below the U.S. average rate, to a 27.1% average rate during 2010-2012. According to the latest data provided by the U.S. Census Bureau, the poverty rate in more than 20 cities with populations of 25,000 or more increased by at least 10 percentage points between those two three-year periods. 24/7 Wall St. examined the 10 cities with the biggest increases in poverty rates.
Click here to read the Ten Cities Where Poverty Is Soaring
Many of these cities show a symptom of the regions hit hardest by the recession — a significant decline in real estate value. Nationally, the average home value during the three-year period of 2010-2012 was down by 9% compared to the previous three-year period. In eight of the 10 cities with soaring poverty rates, property values fell by at least 10%. Homes in Eastpointe lost nearly half of their value. In Inkster, Michigan, another city where poverty grew substantially, an average of 43.3% of homes were worth less than $50,000 between 2010 and 2012, compared to just 11.8% of homes during the 2007-2009 period.
Job losses also hit these cities hard. Nationally, unemployment rose from 4.6% in 2007 to 8.1% last year. In the majority of these cities, unemployment increased, and remained above the national rate. In North Chicago, which had one of the largest increases in poverty, unemployment rose from 10.5% in 2007 to 15.4% in 2012.
Because the housing crash was a major factor in the recession, construction was one the industries hurt most. Between 2007 and 2012, national construction employment fell by 26%, or nearly 2 million jobs. Many of the cities with the biggest increases in poverty saw a similar decline in construction employment. In Cookeville, Tennessee, which had the second-largest increase in poverty in the country, nearly 10% of the workforce was employed in the industry between 2007 and 2009, compared to just 5.6% on average between 2010 and 2012.
Several of these cities were already struggling prior to the recession, in part because of their reliance on manufacturing. The industry had been declining for years, and the recession only made matters worse. In Salisbury, North Carolina, employment in manufacturing fell from 15.5% of all jobs to 8.3%. Goshen, Indiana, another city with a major increase in poverty, is heavily dependent on the auto industry — more than a third of the working population was employed in manufacturing between 2010 and 2012. According to Joe Frank at the Indiana Department of Workforce Development, this dependence had particularly dire consequences during the recession.
Local governments in these cities with rising poverty rates are struggling to cope with their area’s declining prosperity. In North Chicago, which had a 12.3 percentage point increase in poverty, the school district is struggling with the threat of bankruptcy. Earlier this year, the Inkster, Michigan, school district was dissolved because of declining enrollment and increasing budget deficits. Revenues in Eastpointe, which is suffering from a declining population and property values, have plummeted, and city officials have proposed additional taxes to keep the city out of a state of fiscal emergency.
To identify the cities with the biggest increases in poverty, 24/7 Wall St. reviewed the U.S. Census Bureau’s American Community Survey 2012 three-year estimates. Because this release averages three years worth of data (2010-2012) it allows for the review of smaller cities. Checking the Census Bureau’s comparison table for statistical significance, we compared this three-year period to the 2007-2009 period. The cities with populations of 25,000 or more with the largest percentage point increase in poverty made our list. To be consistent, we used three-year averages for national figures as well. In addition to poverty figures, we collected home values, income, and employment by industry, all using the ACS. From the U.S. Bureau of Labor Statistics, we reviewed annual average unemployment figures from the past six full years.
These are the ten cities where poverty is soaring.
10. Seaside, Calif.
> Poverty increase: 11.4 ppt (tied for 9th)
> 2010-2012 Poverty rate: 20.5%
> Median household income: $51,659
> Population: 33,454
On California’s Central Coast, the city of Seaside has been under financial pressure lately due in part to the lingering effects of the recession. Between the three years ending in 2009 and the three years ending in 2012, the city’s median income declined by more than $12,000 a year to $51,659, slightly lower than the national median income. The national decline in median income during that time was $3,180. During last year’s budget preparation process, Seaside was in a state of crisis, facing a projected budget deficit of $2.4 million. To balance its budget, the city had to make substantial cuts. California’s recent elimination of redevelopment agencies last year, which helped fund low-income housing, has also strained the city’s recovery, according Seaside’s 2013-2014 preliminary budget.
9. Bonita Springs, Florida
> Poverty increase: 11.4 ppts (tied for 9th)
> 2010-2012 Poverty rate: 21.8%
> Median household income: $48,489
> Population: 45,146
Bonita Springs, located in Southwestern Florida, was one of the cities hardest-hit by the housing bubble. Average home prices during 2010-2012 declined by 22% compared to average prices during the previous three-year period. Nationwide, home prices declined by just 9% during that time period. Because of the residential boom in the area prior to the crash, nearly 15% of the area’s employment was in construction between 2007 and 2009. Over the following three years, construction employment averaged just 8.6% of total employment.
ALSO READ: Cities with the Widest Gap Between the Rich and Poor
8. Inkster, Mich.
> Poverty increase: 11.5 ppt
> 2010-2012 Poverty rate: 38.6%
> Median household income: $26,181
> Population: 25,120
Even before the recession, unemployment was high in Inkster, Michigan, a city located just 20 miles west of Detroit. In 2007, the rate was 9.8%, more than double the national figure that year. When the recession hit, things got even worse for the city, with the unemployment rate nearly doubling to a high of 18.1% by 2009. While the unemployment rate fell to 13.2% last year, it was still among the highest in the U.S. Like neighboring Detroit, Inkster’s housing market took a beating during the home price collapse. Between 2007 and 2009, 11.8% of homes on average were worth less than $50,000. Over the following three years, an average of 43.3% of homes were worth less than $50,000, the fifth-highest proportion in the country among cities with a population of 25,000 or more. During these time periods, home prices fell by 40%, from $90,600 to $54,200. Not only was the decline in home prices much steeper than the 9% decline nationwide, but also the median value of a home in Inkster was less than a third of the national median home value. Earlier this year, the county permanently dissolved the Inkster school district, which had a $15 million budget deficit.
7. Newburgh, N.Y.
> Poverty increase: 11.8 ppt
> 2010-2012 Poverty rate: 34.0%
> Median household income: $32,263
> Population: 28,791
During the 2007-2009 period, 9.1% of households in Newburgh, New York, earned less than $10,000 per year. That rate rose even more during the recession, with 16.9% of homes in the 2010-2012 period earning so little. This was the 14th-highest rate in the country for homes earning less than $10,000 a year. During that same time, Newburgh homes lost 22% of their value, compared to the 9% decline nationwide. The unemployment rate also jumped from 4.2% in 2007 to 8.5% in 2012. While that was only slightly above the U.S. rate that year, the city is continuing to shed jobs. Between October 2012 and October 2013, Poughkeepsie-Newburgh-Middletown lost 4,400 jobs, more than any U.S. metro area except for the greater Cleveland area.
ALSO READ: The Best Cities to Flip a House
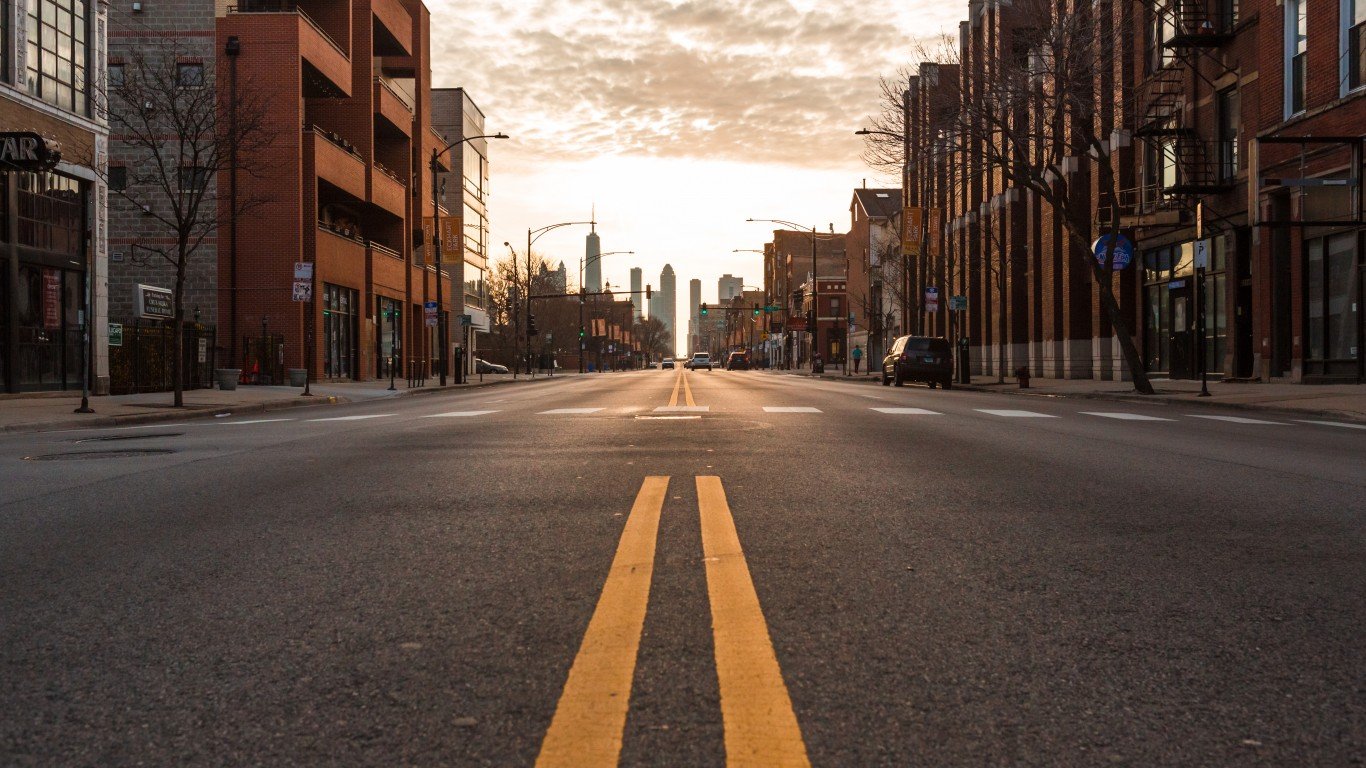
6. North Chicago, Ill.
> Poverty increase: 12.3 ppt
> 2010-2012 Poverty rate: 27.3%
> Median household income: $40,176
> Population: 31,359
North Chicago’s 2014 budget, which is currently under review, has an estimated budget shortfall of about $3 million. The city suffered from already high unemployment before the recession, which then skyrocketed during the downturn. The unemployment rate rose from 10.4% in 2007 to 17.5% in 2010. As of 2012, it was a still very high 15.4%, compared to a national rate of 8.1%. The North Chicago school district is flirting with bankruptcy. After working as a consultant for the Illinois State Board of Education, former CEO of the Chicago public school system Paul Vallas has recommended nearly half of the of the district’s schools permanently to avoid an even greater crisis.
5. Salisbury, N.C.
> Poverty increase: 12.4 ppt
> 2010-2012 Poverty rate: 28.4%
> Median household income: $33,083
> Population: 33,596
During the three-year period ending in 2009, Salisbury’s poverty rate of 16% was about 3% higher than the national rate. In the following three-year period between 2010 and 2012, the city’s poverty rate was approaching 30%. Salisbury has traditionally relied heavily on the manufacturing sector, particularly textiles and fabrics. In recent decades, however, manufacturing activity has declined significantly and continues to do so. Between 2010 and 2012, manufacturing jobs in Salisbury — as a percent of the workforce — shrank from 15.5% to 8.3%.
ALSO READ: Eight Hot Housing Markets That Are Cooling Down
4. College Park, Md.
> Poverty increase: 13.0 ppt
> 2010-2012 Poverty rate: 32.0%
> Median household income: $53,913
> Population: 30,921
Five years ago, households in College Park were among the wealthier in the U.S. By the end of last year, however, earnings in just a handful of cities declined more than they did in College Park. The typical household in College Park city earned $53,913 on average between 2010 and 2012, $17,387 less than a typical household made between 2007 and 2009. In every year between 2007 and 2012, unemployment in College Park city was below the national rate. As of August of this year, however, the unemployment rate in the region was 7.8%, more than the U.S. rate of 7.3%.
3. Goshen, Ind.
> Poverty increase: 13.3 ppt
> 2010-2012 Poverty rate: 27.0%
> Median household income: $38,155
> Population: 31,989
Between 2007 and 2012, unemployment in Goshen, Indiana, doubled from 4.5% to 9%. Extreme poverty in the area also shot up considerably. During the 2007-2009 period, 4.5% of households earned less than $10,000 per year. This was less than the nationwide proportion of 5.7% of households. By the 2010-2012 period, the figure increased to 13.5% of homes, compared to 7.5% nationally. According to Joe Frank at the Indiana Department of Workforce Development, the economy of Goshen relies very heavily on manufacturing. “When the worst of the recent recession hit, Elkhart County was one of the most affected counties in the US due to this reliance.” In the 2010-2012 period, 33.7% of the area’s workforce was employed in the manufacturing sector, the third-highest proportion in the country.
ALSO READ: Seven Cities at Risk of Rising Seas
2. Cookeville, Tenn.
> Poverty increase: 13.4 ppt
> 2010-2012 Poverty rate: 35.2%
> Median household income: $28,212
> Population: 30,755
Cookeville, Tennessee’s average poverty rate during the 2007-2009 period was 21.8%, significantly higher than the U.S. rate of 13.6% at that time. Between 2010 and 2012, the poverty rate jumped to 35.2%, or nearly 20 percentage points above the national rate. During that period, the proportion of homes earning extremely little — with incomes of less than $10,000 — increased from 4.3% to 16%, the 19th-highest proportion among cities with populations of 25,000 or more. Like many of the cities with rising poverty, construction employment declined significantly, from 9.8% between 2007 and 2009 to 5.6% over the three-year period ending in 2012.
1. Eastpointe, Mich.
> Poverty increase: 14.9 ppt
> 2010-2012 Poverty rate: 27.1%
> Median household income: $36,706
> Population: 32,412
In recent years, property values in Eastpointe have plummeted. Between the three-year period ending in 2009 and the three-year period ending in 2012, the median home value declined by nearly 50%. Such dramatic losses in value are often linked to a shrinking population and a difficult job market. This is the case in Eastpointe as well. According to the Detroit News, Eastpointe’s population has fallen, its budget has shrunk by millions, and state funding declined by $700,000 since 2009. In addition to cost-cutting measures such as eliminating full-time employees and closing city offices on Fridays, city residents will be asked to pay more property taxes next year to balance the budget. This may be difficult for Eastpointe residents, whose median household income of $36,706 a year between 2010 and 2012 was considerably lower than the average national income.
Contact [email protected] for any questions or corrections.