
Income inequality has been on the rise in the United States for decades. According to a recent study from the Peter G. Peterson Foundation, a fiscal policy advocacy group, average income among the highest earning quintile of American households surged by 165% between 1981 and 2021, adjusting for inflation. Meanwhile, the average income of the lowest earning quintile increased by just 38% over the same period. Partially as a result, the households in the top quintile now account for 59% of all income, while the lowest quintile receive only 3% of all income, according to the Congressional Budget Office.
24/7 Wall St. Key Points:
- The United States has a higher level of income inequality than nearly every other similarly wealthy, highly developed country.
- If unchecked, income inequality can become a destabilizing economic and political force — and in some parts of the country, it is far more pronounced than in others.
- Also: 2 Dividend Legends To Hold Forever
Even among similarly wealthy, highly developed countries, the United States stands out as having some of the highest levels of income inequality. Data compiled by the CIA World Factbook shows that with the sole exception of Mexico, the U.S. has the most unequal distribution of income of any country in North America, Europe, both South and Central Asia, and Australia and Oceania.
Income inequality is often compared across different countries or regions through the Gini coefficient — a single index measure that can be expressed on a scale of 0 to 100, where 0 represents perfect equality in income distribution and 100 represents perfect inequality. According to the U.S. Census Bureau’s 2023 American Community Survey, the U.S. has a Gini index score of about 48.3 out of 100. But just as income inequality varies across countries, it also varies by region within countries — and in the U.S., some states have far higher levels of inequality than others.
Using one year estimates from the 2023 ACS, 24/7 Wall St. identified the states with the widest gaps between the rich and the poor. States are ranked on their Gini index score, from the most equal states, or those with the lowest Gini coefficient, to the least equal states, or those with the highest Gini score. All supplemental data are also one year estimates from the 2023 ACS.
Across the 50 states, Gini coefficients range from 42.3 out of 100 to 51.6 out of 100. The states with the worst income inequality are disproportionately concentrated in the South and the Northeast, while those with the lowest levels of inequality are mostly in the Midwest and the West.
Many of the states with the most equitable distribution of income also tend to be places where serious financial hardship is less common than average. In each of the 10 states with the lowest Gini coefficients, the poverty rate is at least a full percentage point below the U.S. poverty rate of 12.5%. Meanwhile, nearly every state with a higher than average poverty rate ranks among the 25 states with the highest Gini index scores. (Here is a look at America’s poorest cities.)
The other side of the income spectrum reveals a similar correlation. Nationwide, 12.4% of households earn at least $200,000 per year or more — and in four of the five highest ranking states on this list, the share of households in this income bracket exceeds 15%, including one state where over 20% of households earn $200,000 or more annually. Meanwhile, in most of the 10 lowest ranking states on this list, fewer than 10% of households fall in this income range. (Here is a look at the richest city in every state.)
These are the states with the widest gap between the rich and the poor.
Why It Matters

A 2023 study conducted by political scientists at the University of Chicago singled out income inequality as a unique threat to political and institutional stability in the United States — and in recent decades, income inequality has gotten worse. Between 2019 and 2022 alone, income for the top 10% of earners grew at over four times the growth rate reported among the American middle class. Levels of income inequality vary across the country, however, and in some states, the problem is far more pronounced than in others.
50. Utah

- Gini index score: 42.3 out of 100
- Share of households earning less than $25,000 per year: 9.5% (the smallest of 50 states)
- Share of households earning at least $200,000 per year: 13.0% (14th largest of 50 states)
- Median household income: $93,421 (8th highest of 50 states)
- Poverty rate: 9.0% (2nd lowest of 50 states)
- Bachelor’s degree attainment rate: 38.4% (13th highest of 50 states)
49. Idaho

- Gini index score: 44.0 out of 100
- Share of households earning less than $25,000 per year: 12.7% (11th smallest of 50 states)
- Share of households earning at least $200,000 per year: 8.6% (21st smallest of 50 states)
- Median household income: $74,942 (24th highest of 50 states)
- Poverty rate: 10.1% (10th lowest of 50 states)
- Bachelor’s degree attainment rate: 32.1% (15th lowest of 50 states)
48. New Hampshire

- Gini index score: 44.5 out of 100
- Share of households earning less than $25,000 per year: 10.7% (2nd smallest of 50 states)
- Share of households earning at least $200,000 per year: 15.7% (11th largest of 50 states)
- Median household income: $96,838 (4th highest of 50 states)
- Poverty rate: 7.2% (the lowest of 50 states)
- Bachelor’s degree attainment rate: 40.7% (8th highest of 50 states)
47. North Dakota

- Gini index score: 44.5 out of 100
- Share of households earning less than $25,000 per year: 14.6% (22nd smallest of 50 states)
- Share of households earning at least $200,000 per year: 9.0% (23rd smallest of 50 states)
- Median household income: $76,525 (21st highest of 50 states)
- Poverty rate: 9.8% (8th lowest of 50 states)
- Bachelor’s degree attainment rate: 33.6% (22nd lowest of 50 states)
46. Wyoming

- Gini index score: 44.6 out of 100
- Share of households earning less than $25,000 per year: 15.0% (21st largest of 50 states)
- Share of households earning at least $200,000 per year: 7.3% (9th smallest of 50 states)
- Median household income: $72,415 (20th lowest of 50 states)
- Poverty rate: 11.3% (23rd lowest of 50 states)
- Bachelor’s degree attainment rate: 30.4% (10th lowest of 50 states)
45. Iowa

- Gini index score: 44.6 out of 100
- Share of households earning less than $25,000 per year: 14.3% (21st smallest of 50 states)
- Share of households earning at least $200,000 per year: 7.5% (10th smallest of 50 states)
- Median household income: $71,433 (18th lowest of 50 states)
- Poverty rate: 11.3% (23rd lowest of 50 states)
- Bachelor’s degree attainment rate: 31.5% (11th lowest of 50 states)
44. Wisconsin

- Gini index score: 44.8 out of 100
- Share of households earning less than $25,000 per year: 14.3% (21st smallest of 50 states)
- Share of households earning at least $200,000 per year: 8.5% (18th smallest of 50 states)
- Median household income: $74,631 (25th lowest of 50 states)
- Poverty rate: 10.7% (19th lowest of 50 states)
- Bachelor’s degree attainment rate: 33.8% (23rd lowest of 50 states)
43. Alaska

- Gini index score: 44.9 out of 100
- Share of households earning less than $25,000 per year: 12.3% (9th smallest of 50 states)
- Share of households earning at least $200,000 per year: 13.5% (12th largest of 50 states)
- Median household income: $86,631 (12th highest of 50 states)
- Poverty rate: 10.4% (16th lowest of 50 states)
- Bachelor’s degree attainment rate: 32.2% (16th lowest of 50 states)
42. Maine

- Gini index score: 45.1 out of 100
- Share of households earning less than $25,000 per year: 15.0% (21st largest of 50 states)
- Share of households earning at least $200,000 per year: 8.8% (22nd smallest of 50 states)
- Median household income: $73,733 (22nd lowest of 50 states)
- Poverty rate: 10.4% (16th lowest of 50 states)
- Bachelor’s degree attainment rate: 37.0% (17th highest of 50 states)
41. Hawaii

- Gini index score: 45.1 out of 100
- Share of households earning less than $25,000 per year: 12.5% (10th smallest of 50 states)
- Share of households earning at least $200,000 per year: 17.0% (7th largest of 50 states)
- Median household income: $95,322 (6th highest of 50 states)
- Poverty rate: 10.1% (10th lowest of 50 states)
- Bachelor’s degree attainment rate: 37.0% (17th highest of 50 states)
40. Kansas

- Gini index score: 45.2 out of 100
- Share of households earning less than $25,000 per year: 14.8% (24th smallest of 50 states)
- Share of households earning at least $200,000 per year: 8.2% (16th smallest of 50 states)
- Median household income: $70,333 (15th lowest of 50 states)
- Poverty rate: 11.2% (21st lowest of 50 states)
- Bachelor’s degree attainment rate: 35.8% (21st highest of 50 states)
39. Indiana

- Gini index score: 45.4 out of 100
- Share of households earning less than $25,000 per year: 15.7% (18th largest of 50 states)
- Share of households earning at least $200,000 per year: 7.6% (11th smallest of 50 states)
- Median household income: $69,477 (14th lowest of 50 states)
- Poverty rate: 12.3% (18th highest of 50 states)
- Bachelor’s degree attainment rate: 30.2% (9th lowest of 50 states)
38. Minnesota

- Gini index score: 45.4 out of 100
- Share of households earning less than $25,000 per year: 12.2% (8th smallest of 50 states)
- Share of households earning at least $200,000 per year: 12.3% (16th largest of 50 states)
- Median household income: $85,086 (13th highest of 50 states)
- Poverty rate: 9.3% (4th lowest of 50 states)
- Bachelor’s degree attainment rate: 40.0% (11th highest of 50 states)
37. Vermont
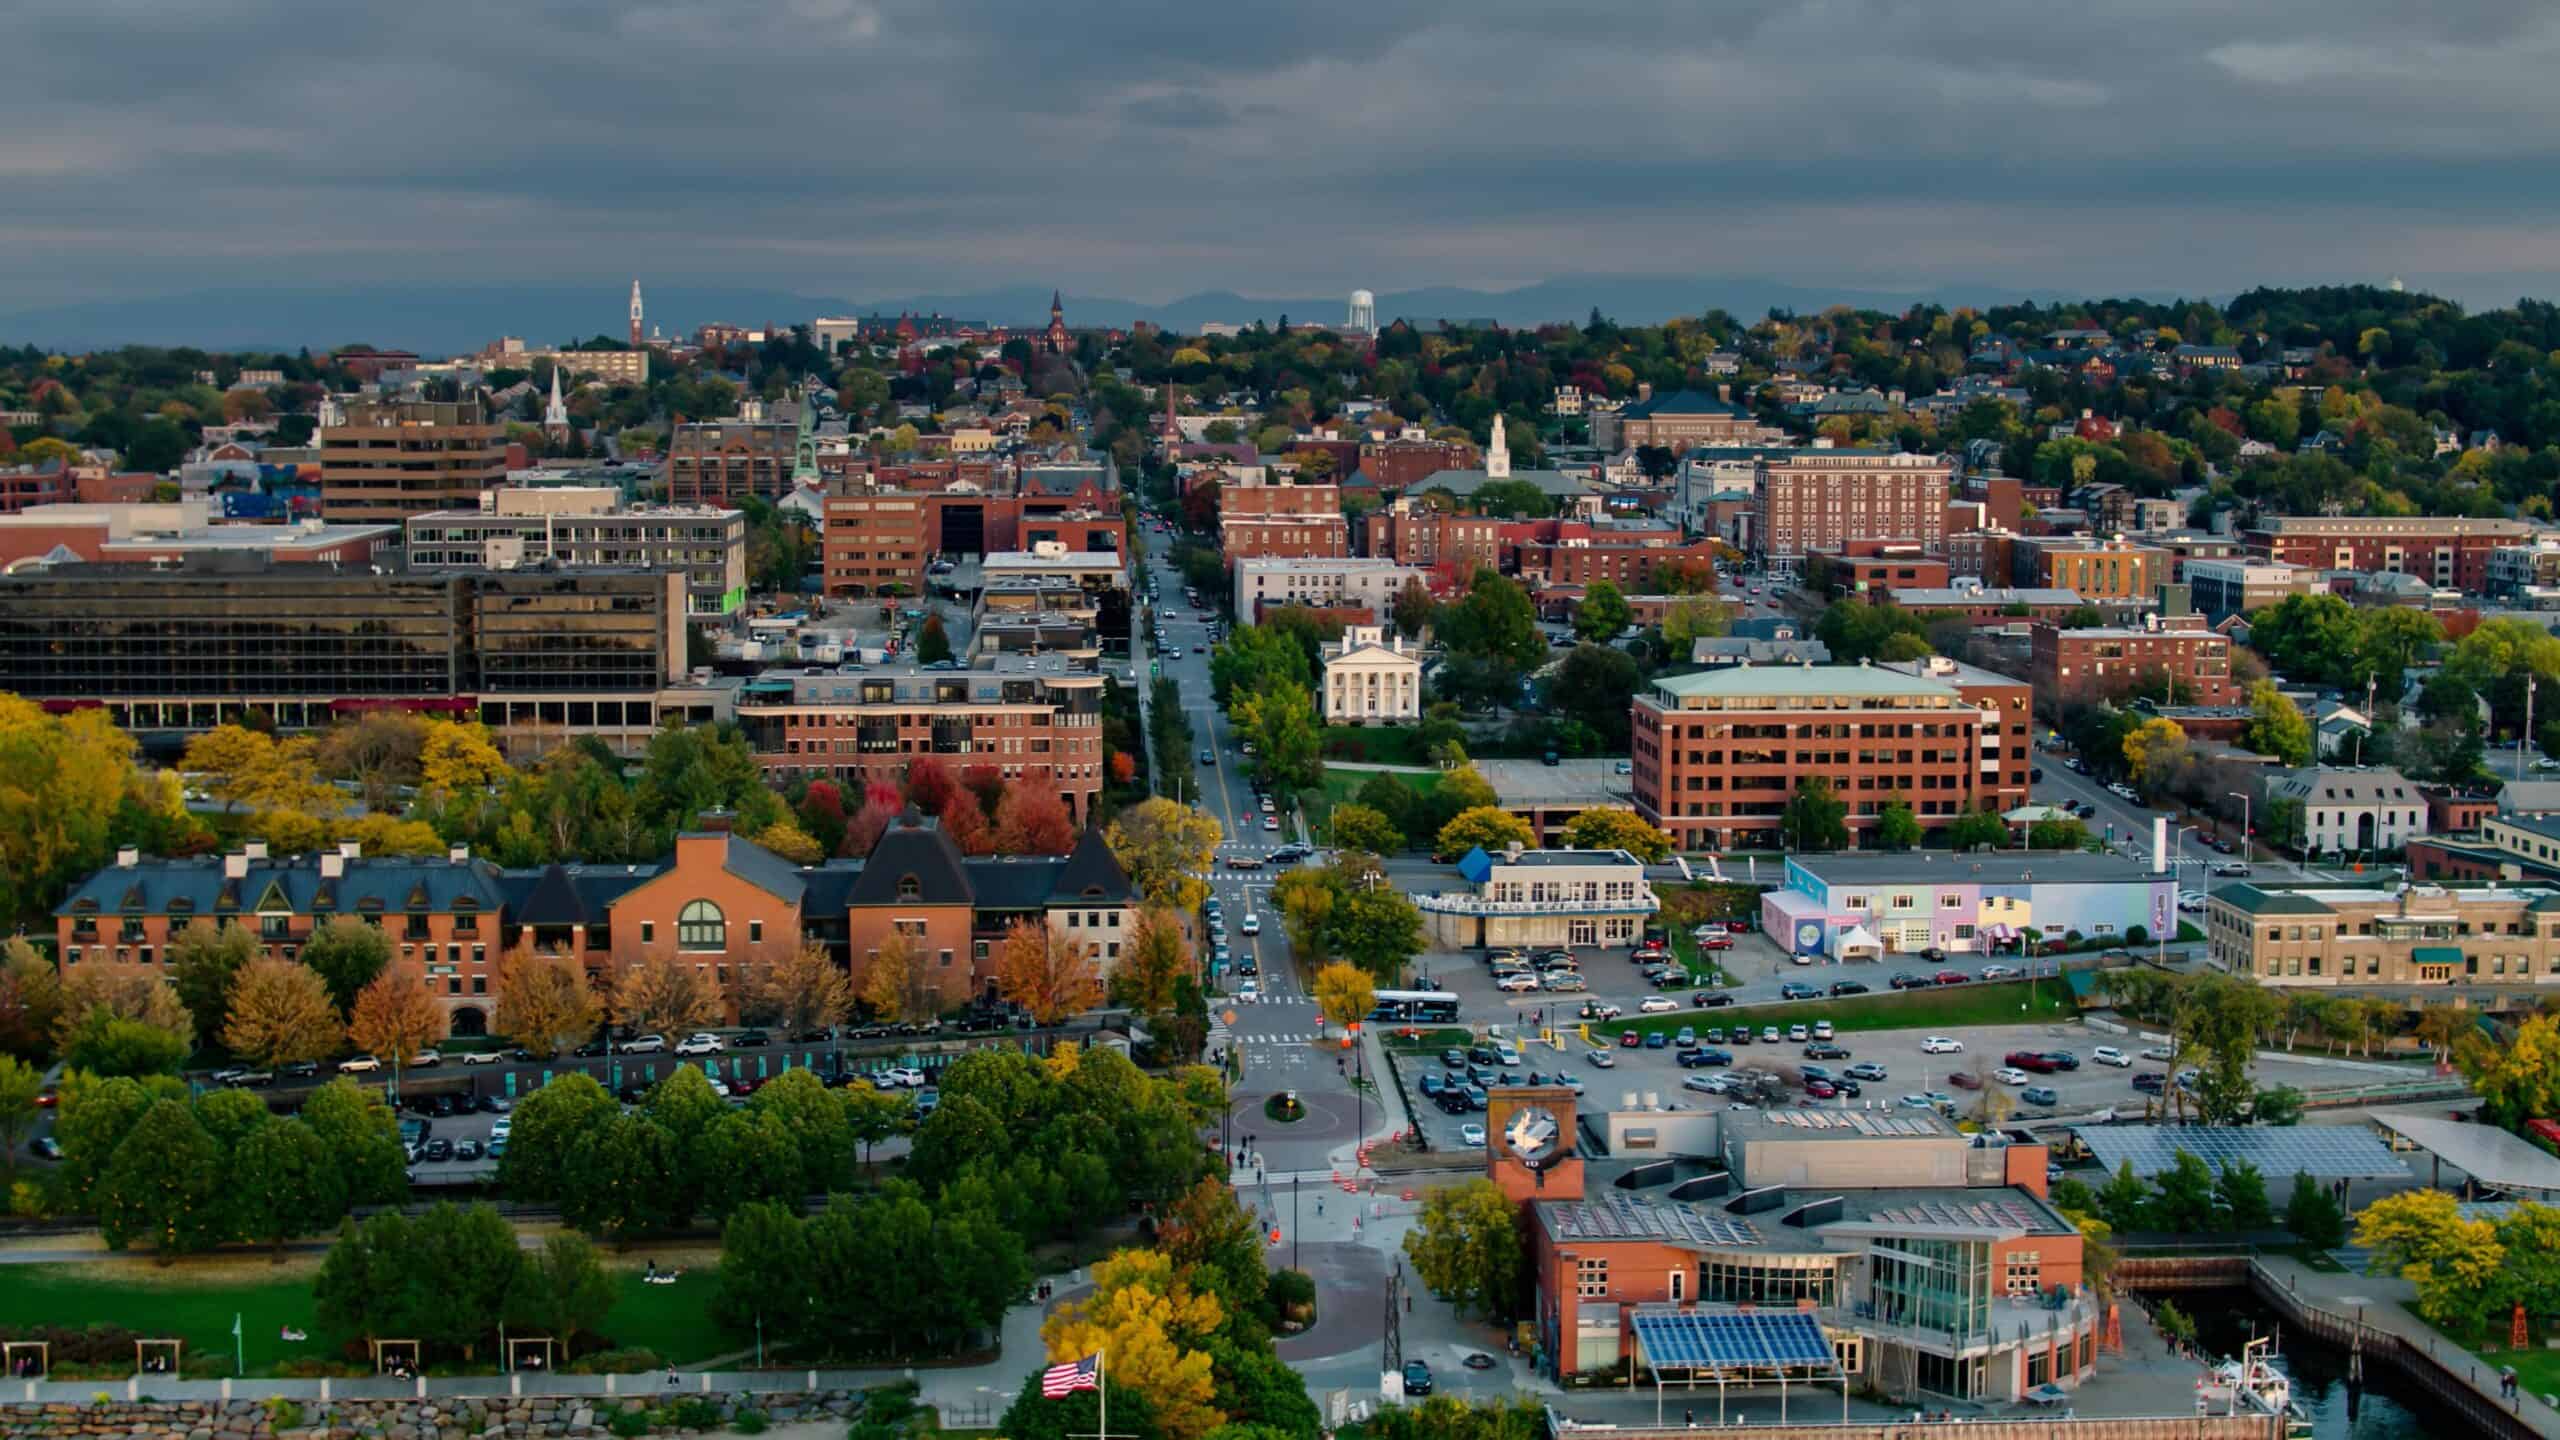
- Gini index score: 45.5 out of 100
- Share of households earning less than $25,000 per year: 14.1% (17th smallest of 50 states)
- Share of households earning at least $200,000 per year: 10.5% (24th largest of 50 states)
- Median household income: $81,211 (17th highest of 50 states)
- Poverty rate: 9.7% (7th lowest of 50 states)
- Bachelor’s degree attainment rate: 43.7% (4th highest of 50 states)
36. Delaware

- Gini index score: 45.6 out of 100
- Share of households earning less than $25,000 per year: 12.1% (6th smallest of 50 states)
- Share of households earning at least $200,000 per year: 11.7% (18th largest of 50 states)
- Median household income: $81,361 (16th highest of 50 states)
- Poverty rate: 10.5% (18th lowest of 50 states)
- Bachelor’s degree attainment rate: 36.5% (20th highest of 50 states)
35. Maryland

- Gini index score: 45.6 out of 100
- Share of households earning less than $25,000 per year: 11.9% (4th smallest of 50 states)
- Share of households earning at least $200,000 per year: 18.7% (4th largest of 50 states)
- Median household income: $98,678 (3rd highest of 50 states)
- Poverty rate: 9.5% (5th lowest of 50 states)
- Bachelor’s degree attainment rate: 43.7% (4th highest of 50 states)
34. Colorado

- Gini index score: 45.8 out of 100
- Share of households earning less than $25,000 per year: 11.6% (3rd smallest of 50 states)
- Share of households earning at least $200,000 per year: 15.9% (9th largest of 50 states)
- Median household income: $92,911 (9th highest of 50 states)
- Poverty rate: 9.3% (4th lowest of 50 states)
- Bachelor’s degree attainment rate: 46.4% (2nd highest of 50 states)
33. Montana

- Gini index score: 46.0 out of 100
- Share of households earning less than $25,000 per year: 15.9% (16th largest of 50 states)
- Share of households earning at least $200,000 per year: 8.0% (13th smallest of 50 states)
- Median household income: $70,804 (17th lowest of 50 states)
- Poverty rate: 11.7% (25th lowest of 50 states)
- Bachelor’s degree attainment rate: 34.6% (25th lowest of 50 states)
32. Missouri

- Gini index score: 46.1 out of 100
- Share of households earning less than $25,000 per year: 15.7% (18th largest of 50 states)
- Share of households earning at least $200,000 per year: 8.1% (15th smallest of 50 states)
- Median household income: $68,545 (12th lowest of 50 states)
- Poverty rate: 12.0% (21st highest of 50 states)
- Bachelor’s degree attainment rate: 33.2% (19th lowest of 50 states)
31. South Dakota

- Gini index score: 46.2 out of 100
- Share of households earning less than $25,000 per year: 14.9% (25th smallest of 50 states)
- Share of households earning at least $200,000 per year: 7.8% (12th smallest of 50 states)
- Median household income: $71,810 (19th lowest of 50 states)
- Poverty rate: 11.8% (25th highest of 50 states)
- Bachelor’s degree attainment rate: 33.3% (20th lowest of 50 states)
30. Nevada

- Gini index score: 46.3 out of 100
- Share of households earning less than $25,000 per year: 14.0% (16th smallest of 50 states)
- Share of households earning at least $200,000 per year: 10.2% (25th largest of 50 states)
- Median household income: $76,364 (22nd highest of 50 states)
- Poverty rate: 12.0% (21st highest of 50 states)
- Bachelor’s degree attainment rate: 28.7% (7th lowest of 50 states)
29. Nebraska

- Gini index score: 46.3 out of 100
- Share of households earning less than $25,000 per year: 14.2% (18th smallest of 50 states)
- Share of households earning at least $200,000 per year: 9.2% (24th smallest of 50 states)
- Median household income: $74,590 (24th lowest of 50 states)
- Poverty rate: 10.5% (18th lowest of 50 states)
- Bachelor’s degree attainment rate: 35.3% (23rd highest of 50 states)
28. Oregon

- Gini index score: 46.4 out of 100
- Share of households earning less than $25,000 per year: 14.8% (24th smallest of 50 states)
- Share of households earning at least $200,000 per year: 11.8% (17th largest of 50 states)
- Median household income: $80,160 (19th highest of 50 states)
- Poverty rate: 12.2% (20th highest of 50 states)
- Bachelor’s degree attainment rate: 37.7% (15th highest of 50 states)
27. Arizona

- Gini index score: 46.5 out of 100
- Share of households earning less than $25,000 per year: 14.3% (21st smallest of 50 states)
- Share of households earning at least $200,000 per year: 10.8% (21st largest of 50 states)
- Median household income: $77,315 (20th highest of 50 states)
- Poverty rate: 12.4% (17th highest of 50 states)
- Bachelor’s degree attainment rate: 33.5% (21st lowest of 50 states)
26. Michigan

- Gini index score: 46.6 out of 100
- Share of households earning less than $25,000 per year: 16.9% (11th largest of 50 states)
- Share of households earning at least $200,000 per year: 8.6% (21st smallest of 50 states)
- Median household income: $69,183 (13th lowest of 50 states)
- Poverty rate: 13.5% (14th highest of 50 states)
- Bachelor’s degree attainment rate: 32.7% (17th lowest of 50 states)
25. Rhode Island

- Gini index score: 46.6 out of 100
- Share of households earning less than $25,000 per year: 15.0% (21st largest of 50 states)
- Share of households earning at least $200,000 per year: 13.1% (13th largest of 50 states)
- Median household income: $84,972 (14th highest of 50 states)
- Poverty rate: 10.8% (20th lowest of 50 states)
- Bachelor’s degree attainment rate: 39.0% (12th highest of 50 states)
24. West Virginia

- Gini index score: 46.8 out of 100
- Share of households earning less than $25,000 per year: 22.1% (3rd largest of 50 states)
- Share of households earning at least $200,000 per year: 5.1% (the smallest of 50 states)
- Median household income: $55,948 (2nd lowest of 50 states)
- Poverty rate: 16.7% (4th highest of 50 states)
- Bachelor’s degree attainment rate: 24.0% (the lowest of 50 states)
23. Ohio

- Gini index score: 47.0 out of 100
- Share of households earning less than $25,000 per year: 16.8% (13th largest of 50 states)
- Share of households earning at least $200,000 per year: 8.4% (17th smallest of 50 states)
- Median household income: $67,769 (10th lowest of 50 states)
- Poverty rate: 13.3% (15th highest of 50 states)
- Bachelor’s degree attainment rate: 32.0% (14th lowest of 50 states)
22. Washington

- Gini index score: 47.0 out of 100
- Share of households earning less than $25,000 per year: 12.1% (6th smallest of 50 states)
- Share of households earning at least $200,000 per year: 17.3% (6th largest of 50 states)
- Median household income: $94,605 (7th highest of 50 states)
- Poverty rate: 10.3% (13th lowest of 50 states)
- Bachelor’s degree attainment rate: 40.5% (10th highest of 50 states)
21. South Carolina

- Gini index score: 47.2 out of 100
- Share of households earning less than $25,000 per year: 17.2% (9th largest of 50 states)
- Share of households earning at least $200,000 per year: 8.1% (15th smallest of 50 states)
- Median household income: $67,804 (11th lowest of 50 states)
- Poverty rate: 13.9% (11th highest of 50 states)
- Bachelor’s degree attainment rate: 32.9% (18th lowest of 50 states)
20. Virginia

- Gini index score: 47.2 out of 100
- Share of households earning less than $25,000 per year: 13.0% (13th smallest of 50 states)
- Share of households earning at least $200,000 per year: 16.5% (8th largest of 50 states)
- Median household income: $89,931 (11th highest of 50 states)
- Poverty rate: 10.2% (11th lowest of 50 states)
- Bachelor’s degree attainment rate: 42.4% (7th highest of 50 states)
19. North Carolina

- Gini index score: 47.3 out of 100
- Share of households earning less than $25,000 per year: 15.8% (17th largest of 50 states)
- Share of households earning at least $200,000 per year: 9.7% (25th smallest of 50 states)
- Median household income: $70,804 (17th lowest of 50 states)
- Poverty rate: 12.8% (16th highest of 50 states)
- Bachelor’s degree attainment rate: 36.8% (19th highest of 50 states)
18. Oklahoma

- Gini index score: 47.4 out of 100
- Share of households earning less than $25,000 per year: 19.1% (8th largest of 50 states)
- Share of households earning at least $200,000 per year: 6.5% (5th smallest of 50 states)
- Median household income: $62,138 (6th lowest of 50 states)
- Poverty rate: 15.9% (6th highest of 50 states)
- Bachelor’s degree attainment rate: 28.7% (7th lowest of 50 states)
17. Arkansas

- Gini index score: 47.4 out of 100
- Share of households earning less than $25,000 per year: 20.5% (5th largest of 50 states)
- Share of households earning at least $200,000 per year: 6.3% (3rd smallest of 50 states)
- Median household income: $58,700 (4th lowest of 50 states)
- Poverty rate: 15.7% (7th highest of 50 states)
- Bachelor’s degree attainment rate: 26.2% (3rd lowest of 50 states)
16. Kentucky

- Gini index score: 47.6 out of 100
- Share of households earning less than $25,000 per year: 20.9% (4th largest of 50 states)
- Share of households earning at least $200,000 per year: 6.5% (5th smallest of 50 states)
- Median household income: $61,118 (5th lowest of 50 states)
- Poverty rate: 16.4% (5th highest of 50 states)
- Bachelor’s degree attainment rate: 27.8% (5th lowest of 50 states)
15. Tennessee

- Gini index score: 47.6 out of 100
- Share of households earning less than $25,000 per year: 17.2% (9th largest of 50 states)
- Share of households earning at least $200,000 per year: 8.6% (21st smallest of 50 states)
- Median household income: $67,631 (9th lowest of 50 states)
- Poverty rate: 14.0% (10th highest of 50 states)
- Bachelor’s degree attainment rate: 31.7% (13th lowest of 50 states)
13. New Mexico

- Gini index score: 47.7 out of 100
- Share of households earning less than $25,000 per year: 20.5% (5th largest of 50 states)
- Share of households earning at least $200,000 per year: 7.3% (9th smallest of 50 states)
- Median household income: $62,268 (8th lowest of 50 states)
- Poverty rate: 17.8% (3rd highest of 50 states)
- Bachelor’s degree attainment rate: 31.6% (12th lowest of 50 states)
14. Alabama

- Gini index score: 47.7 out of 100
- Share of households earning less than $25,000 per year: 20.2% (7th largest of 50 states)
- Share of households earning at least $200,000 per year: 6.7% (6th smallest of 50 states)
- Median household income: $62,212 (7th lowest of 50 states)
- Poverty rate: 15.6% (8th highest of 50 states)
- Bachelor’s degree attainment rate: 28.9% (8th lowest of 50 states)
12. Pennsylvania

- Gini index score: 47.7 out of 100
- Share of households earning less than $25,000 per year: 16.1% (15th largest of 50 states)
- Share of households earning at least $200,000 per year: 10.7% (22nd largest of 50 states)
- Median household income: $73,824 (23rd lowest of 50 states)
- Poverty rate: 12.0% (21st highest of 50 states)
- Bachelor’s degree attainment rate: 35.3% (23rd highest of 50 states)
11. Georgia

- Gini index score: 47.9 out of 100
- Share of households earning less than $25,000 per year: 16.3% (14th largest of 50 states)
- Share of households earning at least $200,000 per year: 11.0% (20th largest of 50 states)
- Median household income: $74,632 (25th highest of 50 states)
- Poverty rate: 13.6% (13th highest of 50 states)
- Bachelor’s degree attainment rate: 35.4% (22nd highest of 50 states)
10. Texas

- Gini index score: 47.9 out of 100
- Share of households earning less than $25,000 per year: 15.0% (21st largest of 50 states)
- Share of households earning at least $200,000 per year: 11.6% (19th largest of 50 states)
- Median household income: $75,780 (23rd highest of 50 states)
- Poverty rate: 13.7% (12th highest of 50 states)
- Bachelor’s degree attainment rate: 34.2% (24th lowest of 50 states)
9. New Jersey

- Gini index score: 47.9 out of 100
- Share of households earning less than $25,000 per year: 12.2% (8th smallest of 50 states)
- Share of households earning at least $200,000 per year: 20.4% (2nd largest of 50 states)
- Median household income: $99,781 (2nd highest of 50 states)
- Poverty rate: 9.7% (7th lowest of 50 states)
- Bachelor’s degree attainment rate: 43.8% (3rd highest of 50 states)
8. Illinois

- Gini index score: 48.1 out of 100
- Share of households earning less than $25,000 per year: 14.9% (25th largest of 50 states)
- Share of households earning at least $200,000 per year: 12.6% (15th largest of 50 states)
- Median household income: $80,306 (18th highest of 50 states)
- Poverty rate: 11.6% (24th lowest of 50 states)
- Bachelor’s degree attainment rate: 38.3% (14th highest of 50 states)
7. Florida

- Gini index score: 48.3 out of 100
- Share of households earning less than $25,000 per year: 15.1% (20th largest of 50 states)
- Share of households earning at least $200,000 per year: 10.6% (23rd largest of 50 states)
- Median household income: $73,311 (21st lowest of 50 states)
- Poverty rate: 12.3% (18th highest of 50 states)
- Bachelor’s degree attainment rate: 34.9% (25th highest of 50 states)
6. Mississippi

- Gini index score: 48.4 out of 100
- Share of households earning less than $25,000 per year: 24.1% (the largest of 50 states)
- Share of households earning at least $200,000 per year: 5.5% (2nd smallest of 50 states)
- Median household income: $54,203 (the lowest of 50 states)
- Poverty rate: 18.0% (2nd highest of 50 states)
- Bachelor’s degree attainment rate: 25.5% (2nd lowest of 50 states)
5. California

- Gini index score: 48.7 out of 100
- Share of households earning less than $25,000 per year: 13.0% (13th smallest of 50 states)
- Share of households earning at least $200,000 per year: 19.1% (3rd largest of 50 states)
- Median household income: $95,521 (5th highest of 50 states)
- Poverty rate: 12.0% (21st highest of 50 states)
- Bachelor’s degree attainment rate: 37.5% (16th highest of 50 states)
4. Massachusetts

- Gini index score: 48.8 out of 100
- Share of households earning less than $25,000 per year: 14.0% (16th smallest of 50 states)
- Share of households earning at least $200,000 per year: 21.1% (the largest of 50 states)
- Median household income: $99,858 (the highest of 50 states)
- Poverty rate: 10.4% (16th lowest of 50 states)
- Bachelor’s degree attainment rate: 47.8% (the highest of 50 states)
3. Connecticut

- Gini index score: 49.5 out of 100
- Share of households earning less than $25,000 per year: 13.7% (14th smallest of 50 states)
- Share of households earning at least $200,000 per year: 17.5% (5th largest of 50 states)
- Median household income: $91,665 (10th highest of 50 states)
- Poverty rate: 10.3% (13th lowest of 50 states)
- Bachelor’s degree attainment rate: 42.9% (6th highest of 50 states)
2. Louisiana

- Gini index score: 49.7 out of 100
- Share of households earning less than $25,000 per year: 23.0% (2nd largest of 50 states)
- Share of households earning at least $200,000 per year: 7.0% (7th smallest of 50 states)
- Median household income: $58,229 (3rd lowest of 50 states)
- Poverty rate: 18.9% (the highest of 50 states)
- Bachelor’s degree attainment rate: 27.0% (4th lowest of 50 states)
1. New York

- Gini index score: 51.6 out of 100
- Share of households earning less than $25,000 per year: 16.8% (12th largest of 50 states)
- Share of households earning at least $200,000 per year: 15.9% (9th largest of 50 states)
- Median household income: $82,095 (15th highest of 50 states)
- Poverty rate: 14.2% (9th highest of 50 states)
- Bachelor’s degree attainment rate: 40.6% (9th highest of 50 states)
Contact [email protected] for any questions or corrections.