JEPI’s 8% Yield Is Impressive, But Has a Hidden Cost Most Retirees Miss
The promise sounds almost too good: invest your nest egg in JPMorgan Equity Premium Income ETF (NYSEARCA:JEPI), collect around 8.2% in monthly distributions, and live comfortably off the income. For retirees tired of bond yields that barely keep pace with…


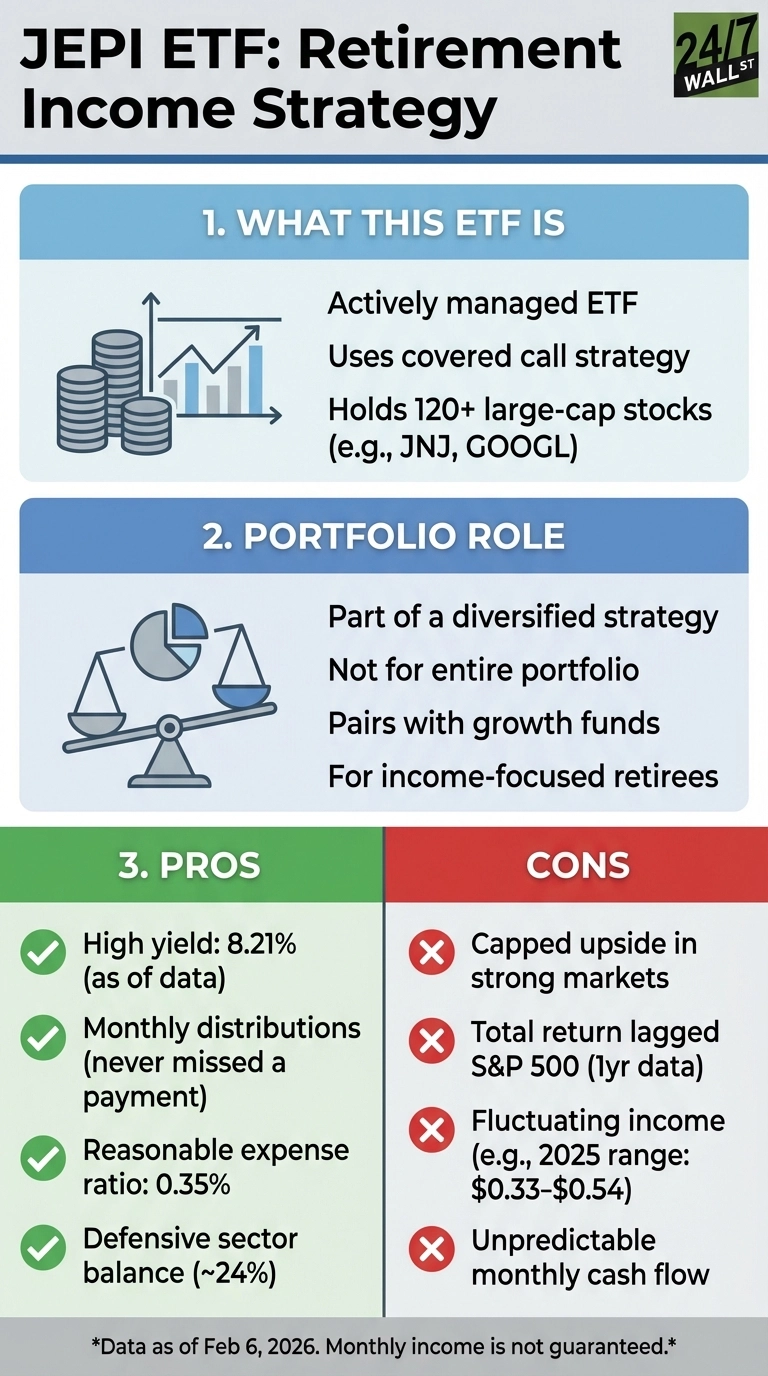
The promise sounds almost too good: invest your nest egg in JPMorgan Equity Premium Income ETF (NYSEARCA:JEPI), collect around 8.2% in monthly distributions, and live comfortably off the income. For retirees tired of bond yields that barely keep pace with inflation, JEPI has become a popular alternative. But retiring on this ETF alone is far more complicated than the headline yield suggests, and some of the biggest costs are the ones the marketing materials never mention.
The Covered Call Trade You Need to Understand
JEPI generates its elevated yield by holding a basket of large-cap stocks while systematically selling call options through equity-linked notes, or ELNs, tied to the S&P 500. When you sell a call option, you collect a premium upfront but cap your upside if stocks rally past the strike price. That is the fundamental tradeoff: higher current income in exchange for limited participation in market gains.
The strategy works well in sideways or moderately rising markets. The fund, which now holds roughly $44.7 billion in assets, tilts deliberately toward lower-volatility names. Current top holdings include Broadcom, Apple, and Ross Stores, with no single position exceeding 2% of the portfolio. That defensive construction provides a stable base but means JEPI will not sprint alongside a tech-driven bull market. During strong rallies, the gap between JEPI and the broader index widens steadily, and over a long retirement, that gap compounds into a meaningful shortfall.
The covered call strategy‘s limitation becomes clear when examining recent performance. JEPI’s total return over the past year came in at approximately 8%, including reinvested distributions. Over the same period, the SPDR S&P 500 ETF delivered roughly 21%. Stretch the comparison to five years, and the gap widens further: JEPI returned approximately 43% while the S&P 500 returned approximately 73%. The covered call overlay mechanically sells away upside every single month, and in a sustained bull run that cost adds up fast.
Schwab U.S. Dividend Equity ETF (NYSEARCA:SCHD) illustrates the alternative path. By focusing on quality dividend payers without capping upside through options, SCHD delivered approximately 22% in total returns over the past year. Its distributions are mostly qualified dividends, taxed at the preferential 15% or 20% rate rather than as ordinary income. For retirees, that combination of growth potential and tax efficiency presents a compelling counterpoint to JEPI’s higher headline yield.
The Income Isn’t as Steady as It Looks
Monthly distributions from JEPI fluctuate based on market volatility, which creates real budgeting challenges for retirees with fixed expenses. When markets turn turbulent, implied volatility rises, option premiums increase, and JEPI’s distributions spike. When markets calm, premiums compress and income drops back down. The fund has never missed a payment since its May 2020 inception, but consistency and reliability are two different things.
The 2025 payment history illustrates this volatility directly. Monthly distributions ranged from $0.33 to $0.54 per share, a swing of more than 60% between the lowest and highest months. For a retiree covering fixed bills like a mortgage, insurance premiums, and healthcare costs, that kind of variability is not a minor inconvenience. It forces either an emergency cash reserve to smooth the gaps or a willingness to cut spending in low-yield months.
The Tax Drag Nobody Mentions
The article title promises a hidden cost, and the tax treatment of JEPI’s distributions is arguably the biggest one. Because the fund generates most of its income through ELNs rather than standard listed options, the IRS classifies that premium income as interest, not capital gains or qualified dividends. Approximately 80% to 85% of JEPI’s distributions are taxed at your marginal ordinary income rate.
For a retiree in the 32% federal bracket, that tax treatment turns an 8% gross yield into roughly 5.4% after federal taxes alone. Add state income taxes in a high-tax state, and the effective yield drops further still. A traditional dividend ETF like SCHD, by contrast, pays mostly qualified dividends taxed at 15% for most retirees, preserving meaningfully more income on an after-tax basis. This single factor can close much of the apparent yield gap between JEPI and its lower-yielding competitors. The practical implication is clear: JEPI is far better suited to a tax-advantaged account like an IRA or 401(k) than to a taxable brokerage account, where the ordinary income treatment quietly erodes returns year after year.
Where JEPI Actually Fits
JEPI works best as one component of a diversified retirement income strategy rather than an entire portfolio. Pairing it with dividend growth funds provides a balance between current income and long-term appreciation. SCHD offers a lower headline yield but better total return and more tax-efficient distributions over time, making the two funds genuinely complementary rather than competing alternatives.
The 0.35% expense ratio is reasonable for an actively managed strategy, and the fund’s scale provides operational stability. For retirees who can tolerate income fluctuations, hold the fund inside a tax-advantaged account, and want to supplement other income sources like Social Security or a pension, JEPI serves a useful role. Relying on it exclusively, though, means accepting capped growth potential, unpredictable monthly cash flow, and a tax bill that can quietly erase a significant portion of that eye-catching yield.
Editor’s note: This article has been updated to reflect JEPI’s current assets under management of approximately $44.7 billion (up from $41.5 billion cited previously), revised one-year total return figures for JEPI (approximately 8%) and the S&P 500 (approximately 21%), SCHD’s trailing 12-month total return of approximately 22%, and a new section on the ordinary income tax treatment of JEPI’s ELN-generated distributions, which reduces the effective after-tax yield to roughly 5.4% for investors in the 32% federal bracket.
Contact [email protected] for any questions or corrections.
I am a long time investor and student of business, and believe finding good companies that can become great investments is the best game on earth. After 20 years of writing and researching the public markets it is clear that individuals have never had more tools and information to take control of their financial lives. From ETFs and $0 commissions to cryptos and prediction markets there has never been a greater democratization of access to investing.
I write to help people understand the investments available to them so they can make the best choice for their portfolio, whether they're starting out or looking for income in retirement.