The iShares Core S&P 500 ETF (NYSEARCA:IVV) and Vanguard’s S&P 500 fund are the two most commonly recommended core holdings in American retirement accounts, and the honest verdict is that picking between them is closer to choosing between two identical sedans than two different cars. IVV tracks the same 500 companies, charges the same headline fee, and has returned almost exactly the same amount as the Vanguard S&P 500 ETF (NYSEARCA:VOO) over every meaningful window. The reason IVV deserves a closer look is mechanical: tighter bid-ask spreads from heavier institutional volume, and a payment schedule that hits brokerage accounts a day or two faster than VOO’s.
For a 60-year-old retiree rebalancing a $500,000 portfolio four times a year, those frictions add up to roughly $50 to $200 annually. That is real money for a fund that costs almost nothing to hold.
The fund and what it actually does
IVV is the simplest job in indexing: own all 500 S&P 500 constituents in proportion to their market cap and pass through the dividends. There are no options overlay, no factor tilt, and no active overlay. The expense ratio is 0.03%, putting it tied with VOO at the bottom of the cost ladder. Assets under management sit near $800 billion, which is what produces the deep liquidity and tight quoting that matter on rebalance day.
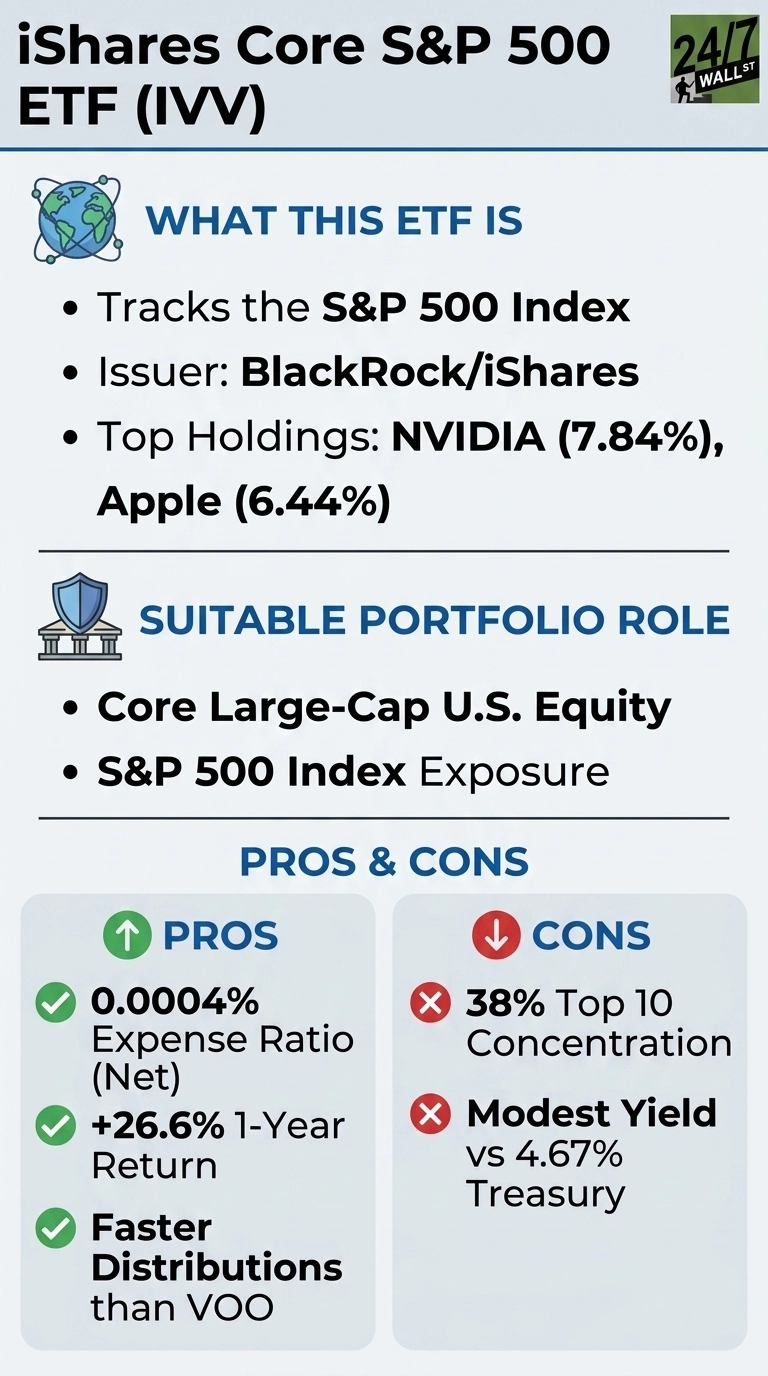
The portfolio is concentrated where the index is concentrated, as NVIDIA alone accounts for about 8% of the fund, Apple roughly 6%, Microsoft about 5%, and Amazon around 4%. Alphabet’s two share classes combine to roughly 6.5%, and Broadcom adds another 3.2%. Anyone buying IVV is taking on meaningful mega-cap tech exposure, the same exposure VOO holders carry.
Does it actually beat VOO?
Historical performance remains the ultimate objective test, and this head-to-head comparison produces a dead heat. Specifically, IVV has climbed 27% over the past year and 92% across a five-year horizon. VOO similarly surged 27% over the trailing twelve months and 92% throughout that same five-year window. Looking year-to-date, both investment vehicles have delivered total returns of roughly 9%. Any microscopic performance gaps between them are purely statistical noise.
Cash distribution timing is where IVV maintains a minor mechanical edge over its primary competitor. Its Q1 2026 payout sequence registered an ex-dividend date of March 17, with actual cash hitting retail brokerage accounts on March 20. Vanguard’s matching quarterly distribution carried a later ex-dividend date of March 27 with payment finalized on March 31, creating a distinct four-day settlement lag. Meanwhile, IVV’s trailing annual distributions totaled approximately $10 per share, keeping pace with the broader index’s 1.1% cash yield.
The tradeoffs nobody warns retirees about
- Concentration risk is identical to VOO. Owning IVV instead of VOO does not diversify away from the top 10 names that drive returns. The top 10 holdings represent roughly 38% of the fund.
- The yield is modest in a 4.67% Treasury world. With the 10-year Treasury near 5%, a 1.1% distribution yield means retirees are accepting equity volatility for income that bonds now pay outright.
- Broker matters more than the ticker. At Schwab, SCHX may save another basis point or two. At Fidelity, the FXAIX mutual fund is essentially the same exposure in a different wrapper.
Who IVV fits, and who can ignore the choice
Buying IVV makes perfect sense as a foundational large-cap holding for individual investors whose chosen brokerage quotes the fund with a razor-thin spread and zero transaction commissions, which applies to standard retail accounts at Fidelity, Schwab, or Merrill. The fund also pairs seamlessly with VOO for tactical tax-loss harvesting because the two instruments are economically substitutable without technically crossing into identical securities under IRS wash-sale regulations.
For a dedicated Vanguard account holder, executing a manual switch over to IVV simply fails to justify the operational friction. The honest assessment: accumulate whichever vehicle your platform prefers, then deploy that preserved decision-making energy toward your broader asset allocation instead of overanalyzing the specific fund ticker.
Contact [email protected] for any questions or corrections.