Tesla vs BYD: Only One Leader in The EV Race
Tesla just posted record deliveries while its operating income collapsed and free cash flow went negative, yet BYD keeps selling more electrified vehicles than any company on earth. Which bet actually wins the next twelve months depends on one question…


Tesla (NASDAQ:TSLA | TSLA Price Prediction) just delivered a messy but strategically loud Q2 2026 report, while BYD (OTC:BYDDF) continues to sell more electrified vehicles than anyone on the planet from its Shenzhen base. Both are chasing global EV leadership, but one is now a software and robotics story with cars attached, and the other remains a ruthless hardware and battery manufacturer.
Record Deliveries for Tesla, Quiet Dominance for BYD
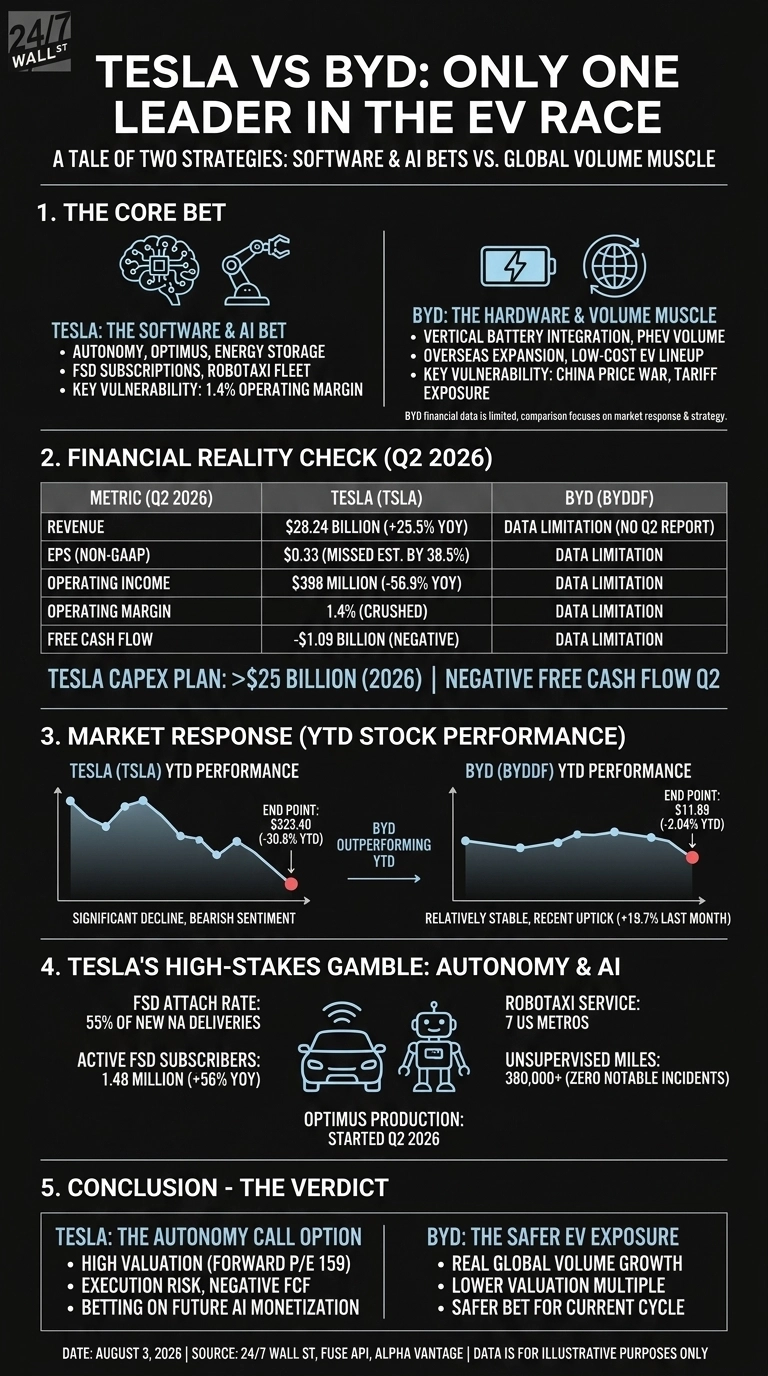
Tesla posted revenue of $28.24 billion, up 25.52% year over year, on record deliveries of 480,126 vehicles. EPS came in at $0.33, missing consensus by 38.51%. Operating income collapsed 56.88% to $398 million, and free cash flow flipped to negative $1.09 billion as CapEx more than doubled.
BYD does not report on a US quarterly cadence and detailed post-earnings financials were not available in our dataset for BYDDF, so a like-for-like income statement comparison is not possible here. What we can compare is market response. Tesla shares are down 30.8% year to date to $323.40, while BYDDF sits at $11.89, down just 2.04% YTD and up 19.74% in the past month.
Software Bets vs. Volume Muscle
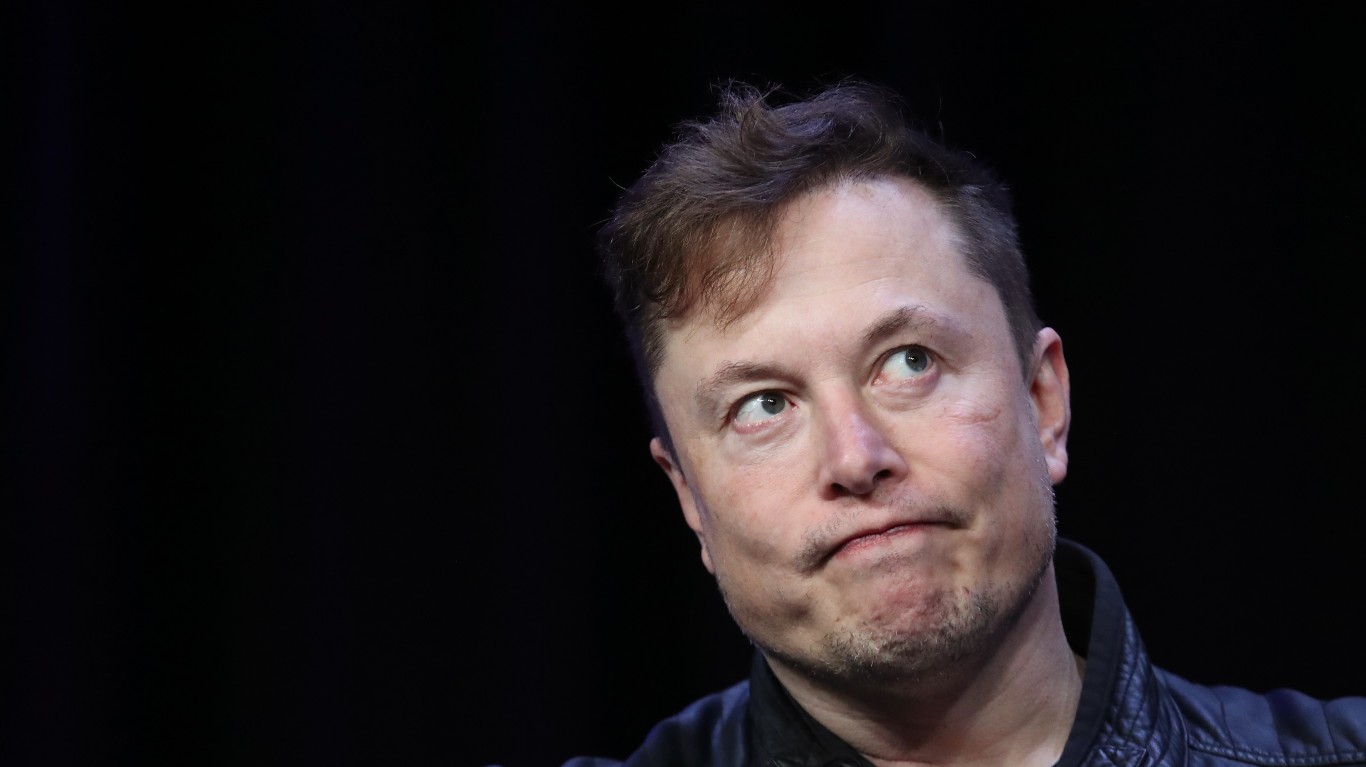
Elon Musk was unusually blunt on the call. “For a lot of people, they’re actually buying Tesla full self-driving with a car attached as opposed to a car with FSD,” he said. FSD attach hit 55% of new North American deliveries, with 1.48 million active subscribers. Robotaxi service now runs in seven US metros, and Ashok Elluswamy claimed 380,000+ miles of unsupervised robotaxi operation with zero notable incidents.
| Lens | Tesla | BYD |
| Core Bet | Autonomy, Optimus, energy storage | Vertical battery integration, PHEV volume |
| Growth Engine | FSD subscriptions, Robotaxi fleet | Overseas expansion, low-cost EV lineup |
| Key Vulnerability | 1.4% operating margin | China price war, tariff exposure in EU |
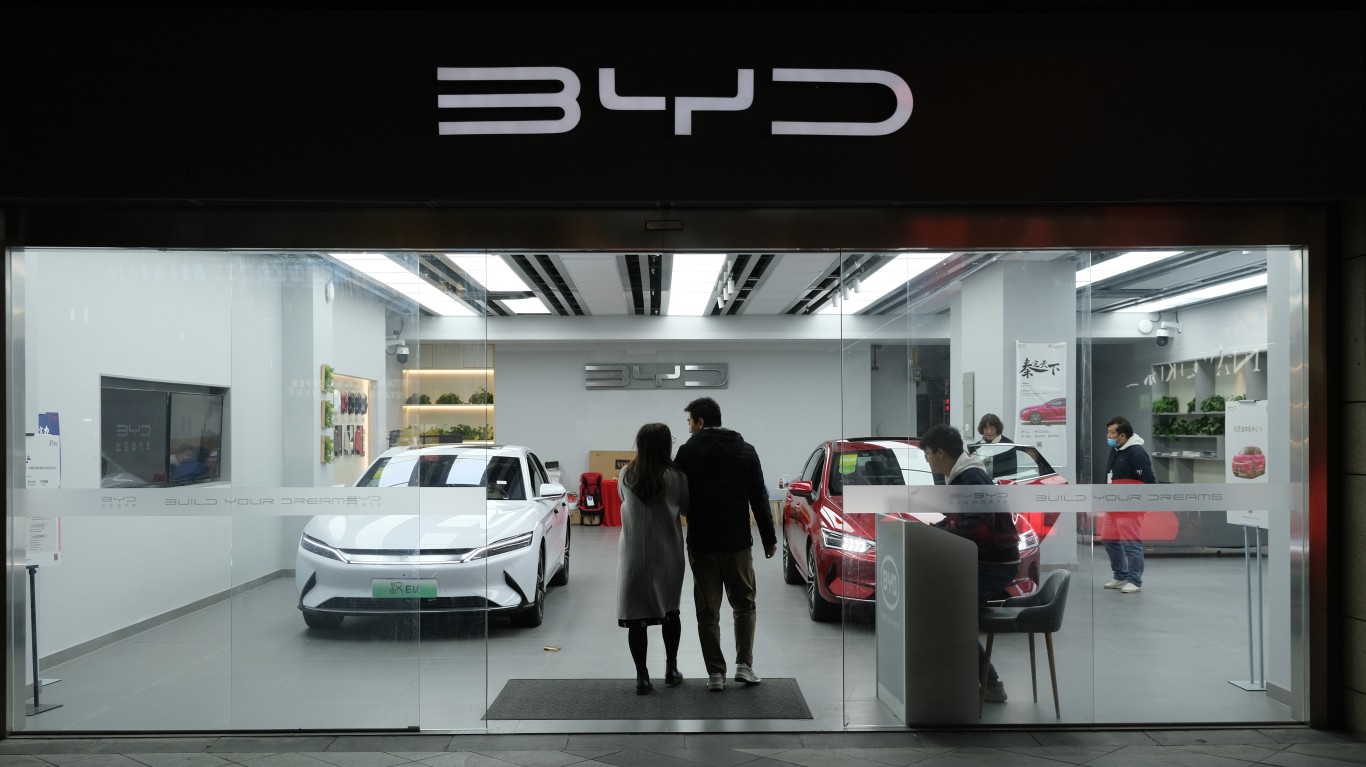
BYD is playing a different game. Its Blade Battery, plug-in hybrid DM-i lineup, and premium Denza, Yangwang, and Fangchengbao brands let it defend China while pushing into Europe, Southeast Asia, and Latin America with affordable price points Tesla will not match at scale.
What Decides the Next Twelve Months
Tesla is betting more than $25 billion of CapEx and up to $30 billion in new debt capacity that Robotaxi, Cybercab, and Optimus scale before margins fully break. Automotive gross margin ex-credits was 16.3%, down from 19.2% in Q1.
I will be watching whether FSD monetization can offset falling ASPs and whether Model YL demand holds after its July 2026 US launch. For BYD, the question is whether European tariffs and softer Chinese demand slow its export flywheel.
Why I Still Lean BYD for This Cycle
If you believe autonomy will monetize on Musk’s timeline, Tesla at a forward P/E of 159 is a call option for autonomy believers. My caution stems from execution risk. Reddit sentiment turned very bearish after the earnings report, and negative free cash flow paired with a collapsed operating margin makes me cautious.
BYD, priced at a fraction of Tesla’s multiple with real global volume growth, feels like the safer EV exposure for me right now. If Robotaxi economics prove out by mid-2027, I would happily revisit.
Contact [email protected] for any questions or corrections.
Vandita Jadeja is a financial publisher with over a decade of experience writing about financial topics, including investment, savings, retirement, insurance and banking. Vandita is a Chartered Accountant who loves to debunk financial concepts for readers.
Her work has appeared on sites that include The Motley Fool, InvestorPlace, and Benzinga. She covers investing and focuses on stock picks and price prediction for 24/7 Wall St.
When not looking for the next stock investment opportunity, she can be found traveling, reading, chasing sunsets and enjoying her iced latte.