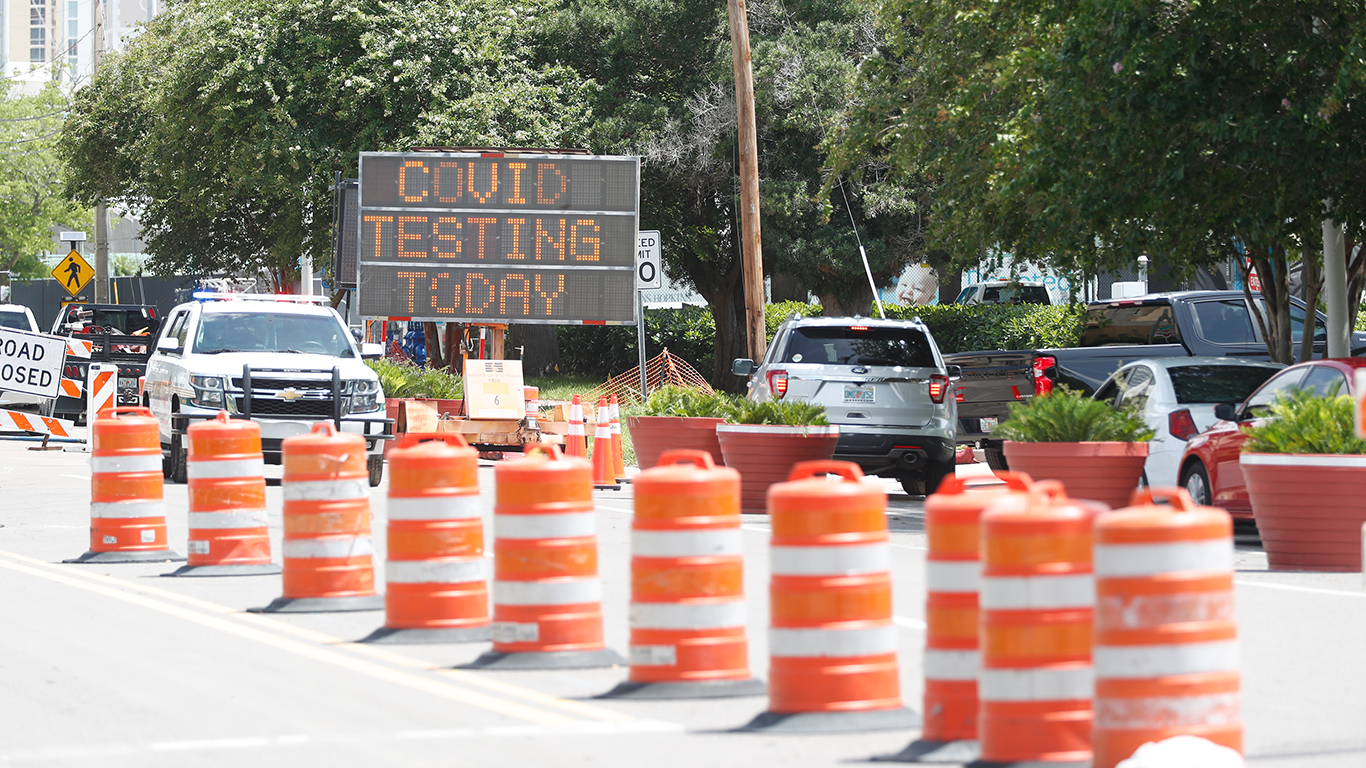
The process of reopening the U.S. economy has begun, and in parts of the country, lifting restrictions appears to be contributing to a spike in COVID-19 infections. Researchers at the University of Washington recently raised their death toll forecast by 18% as several states, including Arizona, Florida, Oklahoma, and Texas are reporting record numbers of new cases.
Across the country, the average number of new daily cases has remained steady at around 20,000 for weeks. The national scale, however, fails to illustrate regional patterns. For example, many of the hardest-hit cities by the coronavirus — such as Detroit, New York, and Washington — are reporting rapid declines in new cases. Meanwhile other cities — many of which have so far been largely spared — are seeing alarming surges in cases.
Using data from state and local health departments, 24/7 Wall St. compiled and reviewed the average of new daily confirmed COVID-19 cases for the week ending June 17, and compared it to the average of new daily cases from the previous week, to determine the metropolitan areas where the virus is growing the fastest. For comparison purposes, we adjusted the number of confirmed cases per 100,000 people. Nationwide, the average number of new daily cases climbed by 0.2 per 100,000 Americans week over week. Among the cities on this list, the average climbed anywhere between 3 cases to 16 per 100,000 people.
Currently, only 14 metro areas on this list have a higher concentration of people who tested positive for the coronavirus than the U.S. as a whole, where there are 661 confirmed cases per 100,000 people. Should cases continue to rise at their current rate, however, more of these cities may soon have near nation-leading cases of COVID-19, adjusted for population. Here is a list of the cities with the highest number of COVID-19 cases.
Of the 50 metro areas on this list, nine are located in Alabama. The state is one of many reporting a record high number of daily new cases, as state health officials report that some residents are not adhering to social distancing recommendations and going into public places without a face mask. Other states home to multiple cities on this list include Florida, South Carolina, and Texas — each of which had relatively lax COVID-19 containment restrictions. These are every state’s rules for reopening and social distancing.
Click here to see the cities where COVID-19 is growing the fastest

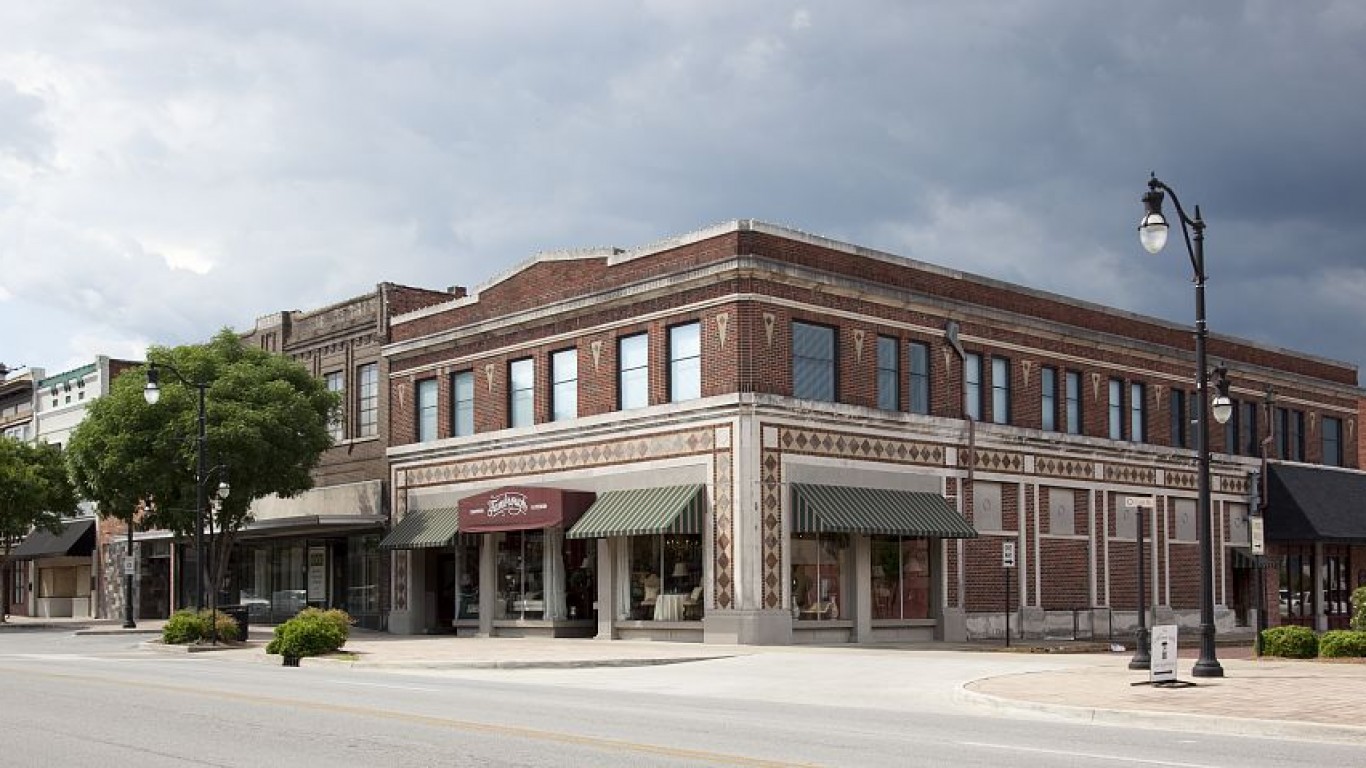
50. Enid, OK
> Increase in daily avg. new COVID-19 cases week over week: +2.9 per 100,000 people
> Avg. new daily cases for week ending June 17: 3.6 per 100,000 people â 209 out of 383 metro areas
> Avg. new daily cases for week ending June 10: 0.8 per 100,000 people — 349 out of 383 metro areas
> Cumulative COVID-19 cases as of June 17: 82 per 100,000 people — 350 out of 383 metro areas (total: 51)
> Cumulative COVID-19 deaths as of June 17: 02 per 100,000 people — 339 out of 383 metro areas (total: 1)
> Total population: 60,913
[in-text-ad]

49. Cape Coral-Fort Myers, FL
> Increase in daily avg. new COVID-19 cases week over week: +2.9 per 100,000 people
> Avg. new daily cases for week ending June 17: 10.2 per 100,000 people â 57 out of 383 metro areas
> Avg. new daily cases for week ending June 10: 7.3 per 100,000 people — 99 out of 383 metro areas
> Cumulative COVID-19 cases as of June 17: 443 per 100,000 people — 131 out of 383 metro areas (total: 3,187)
> Cumulative COVID-19 deaths as of June 17: 19 per 100,000 people — 128 out of 383 metro areas (total: 137)
> Total population: 754,610
[recirclink id=713597]

48. Dothan, AL
> Increase in daily avg. new COVID-19 cases week over week: +3.1 per 100,000 people
> Avg. new daily cases for week ending June 17: 7.4 per 100,000 people â 101 out of 383 metro areas
> Avg. new daily cases for week ending June 10: 4.3 per 100,000 people — 173 out of 383 metro areas
> Cumulative COVID-19 cases as of June 17: 328 per 100,000 people — 189 out of 383 metro areas (total: 485)
> Cumulative COVID-19 deaths as of June 17: 05 per 100,000 people — 268 out of 383 metro areas (total: 7)
> Total population: 148,245

47. La Crosse-Onalaska, WI-MN
> Increase in daily avg. new COVID-19 cases week over week: +3.1 per 100,000 people
> Avg. new daily cases for week ending June 17: 5.1 per 100,000 people â 148 out of 383 metro areas
> Avg. new daily cases for week ending June 10: 2.0 per 100,000 people — 283 out of 383 metro areas
> Cumulative COVID-19 cases as of June 17: 116 per 100,000 people — 323 out of 383 metro areas (total: 159)
> Cumulative COVID-19 deaths as of June 17: 00 per 100,000 people — 370 out of 383 metro areas (total: 0)
> Total population: 136,808
[in-text-ad-2]

46. Charlotte-Concord-Gastonia, NC-SC
> Increase in daily avg. new COVID-19 cases week over week: +3.2 per 100,000 people
> Avg. new daily cases for week ending June 17: 14.1 per 100,000 people â 29 out of 383 metro areas
> Avg. new daily cases for week ending June 10: 10.9 per 100,000 people — 49 out of 383 metro areas
> Cumulative COVID-19 cases as of June 17: 497 per 100,000 people — 114 out of 383 metro areas (total: 12,405)
> Cumulative COVID-19 deaths as of June 17: 10 per 100,000 people — 190 out of 383 metro areas (total: 250)
> Total population: 2.6 million
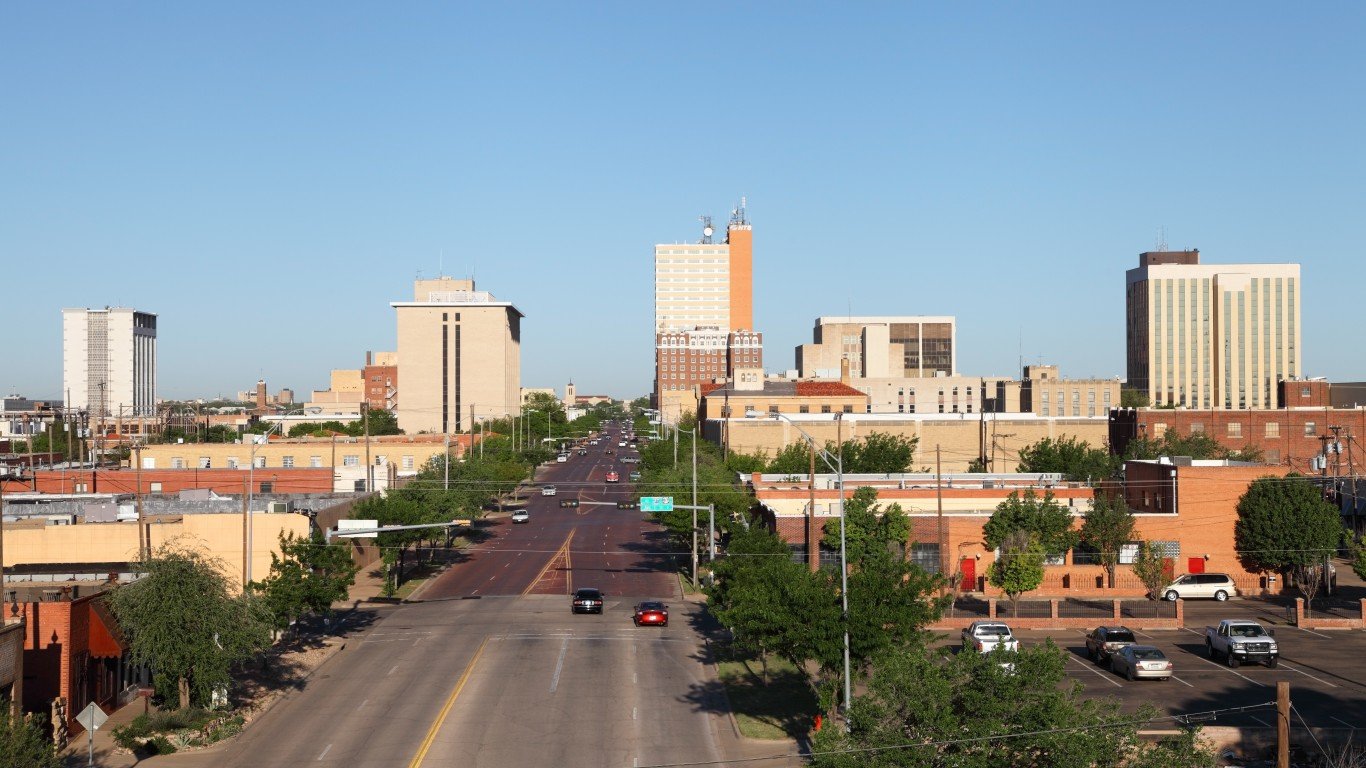
45. Lubbock, TX
> Increase in daily avg. new COVID-19 cases week over week: +3.3 per 100,000 people
> Avg. new daily cases for week ending June 17: 5.4 per 100,000 people â 140 out of 383 metro areas
> Avg. new daily cases for week ending June 10: 2.2 per 100,000 people — 273 out of 383 metro areas
> Cumulative COVID-19 cases as of June 17: 314 per 100,000 people — 197 out of 383 metro areas (total: 984)
> Cumulative COVID-19 deaths as of June 17: 17 per 100,000 people — 137 out of 383 metro areas (total: 53)
> Total population: 319,995
[in-text-ad]

44. Tulsa, OK
> Increase in daily avg. new COVID-19 cases week over week: +3.4 per 100,000 people
> Avg. new daily cases for week ending June 17: 6.4 per 100,000 people â 123 out of 383 metro areas
> Avg. new daily cases for week ending June 10: 3.0 per 100,000 people — 230 out of 383 metro areas
> Cumulative COVID-19 cases as of June 17: 244 per 100,000 people — 241 out of 383 metro areas (total: 2,400)
> Cumulative COVID-19 deaths as of June 17: 10 per 100,000 people — 185 out of 383 metro areas (total: 103)
> Total population: 993,928
[recirclink id=713661]

43. Raleigh-Cary, NC
> Increase in daily avg. new COVID-19 cases week over week: +3.4 per 100,000 people
> Avg. new daily cases for week ending June 17: 10.9 per 100,000 people â 51 out of 383 metro areas
> Avg. new daily cases for week ending June 10: 7.5 per 100,000 people — 97 out of 383 metro areas
> Cumulative COVID-19 cases as of June 17: 338 per 100,000 people — 184 out of 383 metro areas (total: 4,404)
> Cumulative COVID-19 deaths as of June 17: 07 per 100,000 people — 234 out of 383 metro areas (total: 89)
> Total population: 1.4 million

42. Brownsville-Harlingen, TX
> Increase in daily avg. new COVID-19 cases week over week: +3.5 per 100,000 people
> Avg. new daily cases for week ending June 17: 7.6 per 100,000 people â 99 out of 383 metro areas
> Avg. new daily cases for week ending June 10: 4.2 per 100,000 people — 178 out of 383 metro areas
> Cumulative COVID-19 cases as of June 17: 293 per 100,000 people — 210 out of 383 metro areas (total: 1,236)
> Cumulative COVID-19 deaths as of June 17: 11 per 100,000 people — 184 out of 383 metro areas (total: 45)
> Total population: 423,908
[in-text-ad-2]

41. College Station-Bryan, TX
> Increase in daily avg. new COVID-19 cases week over week: +3.6 per 100,000 people
> Avg. new daily cases for week ending June 17: 10.8 per 100,000 people â 53 out of 383 metro areas
> Avg. new daily cases for week ending June 10: 7.2 per 100,000 people — 101 out of 383 metro areas
> Cumulative COVID-19 cases as of June 17: 373 per 100,000 people — 162 out of 383 metro areas (total: 946)
> Cumulative COVID-19 deaths as of June 17: 10 per 100,000 people — 194 out of 383 metro areas (total: 25)
> Total population: 265,024

40. Norwich-New London, CT
> Increase in daily avg. new COVID-19 cases week over week: +3.6 per 100,000 people
> Avg. new daily cases for week ending June 17: 5.4 per 100,000 people â 141 out of 383 metro areas
> Avg. new daily cases for week ending June 10: 1.8 per 100,000 people — 291 out of 383 metro areas
> Cumulative COVID-19 cases as of June 17: 478 per 100,000 people — 119 out of 383 metro areas (total: 1,285)
> Cumulative COVID-19 deaths as of June 17: 38 per 100,000 people — 56 out of 383 metro areas (total: 101)
> Total population: 266,784
[in-text-ad]
39. Gadsden, AL
> Increase in daily avg. new COVID-19 cases week over week: +3.7 per 100,000 people
> Avg. new daily cases for week ending June 17: 6.3 per 100,000 people â 127 out of 383 metro areas
> Avg. new daily cases for week ending June 10: 2.6 per 100,000 people — 249 out of 383 metro areas
> Cumulative COVID-19 cases as of June 17: 332 per 100,000 people — 185 out of 383 metro areas (total: 342)
> Cumulative COVID-19 deaths as of June 17: 12 per 100,000 people — 178 out of 383 metro areas (total: 12)
> Total population: 102,501
[recirclink id=713784]

38. Goldsboro, NC
> Increase in daily avg. new COVID-19 cases week over week: +3.8 per 100,000 people
> Avg. new daily cases for week ending June 17: 22.6 per 100,000 people â 10 out of 383 metro areas
> Avg. new daily cases for week ending June 10: 18.8 per 100,000 people — 12 out of 383 metro areas
> Cumulative COVID-19 cases as of June 17: 1,242 per 100,000 people — 25 out of 383 metro areas (total: 1,540)
> Cumulative COVID-19 deaths as of June 17: 16 per 100,000 people — 144 out of 383 metro areas (total: 20)
> Total population: 123,248

37. Stockton, CA
> Increase in daily avg. new COVID-19 cases week over week: +3.8 per 100,000 people
> Avg. new daily cases for week ending June 17: 8.2 per 100,000 people â 83 out of 383 metro areas
> Avg. new daily cases for week ending June 10: 4.4 per 100,000 people — 170 out of 383 metro areas
> Cumulative COVID-19 cases as of June 17: 249 per 100,000 people — 237 out of 383 metro areas (total: 1,825)
> Cumulative COVID-19 deaths as of June 17: 06 per 100,000 people — 239 out of 383 metro areas (total: 47)
> Total population: 752,660
[in-text-ad-2]

36. Tampa-St. Petersburg-Clearwater, FL
> Increase in daily avg. new COVID-19 cases week over week: +3.8 per 100,000 people
> Avg. new daily cases for week ending June 17: 8.0 per 100,000 people â 86 out of 383 metro areas
> Avg. new daily cases for week ending June 10: 4.2 per 100,000 people — 175 out of 383 metro areas
> Cumulative COVID-19 cases as of June 17: 254 per 100,000 people — 236 out of 383 metro areas (total: 7,687)
> Cumulative COVID-19 deaths as of June 17: 08 per 100,000 people — 217 out of 383 metro areas (total: 235)
> Total population: 3.1 million

35. Miami-Fort Lauderdale-Pompano Beach, FL
> Increase in daily avg. new COVID-19 cases week over week: +3.8 per 100,000 people
> Avg. new daily cases for week ending June 17: 12.0 per 100,000 people â 40 out of 383 metro areas
> Avg. new daily cases for week ending June 10: 8.1 per 100,000 people — 87 out of 383 metro areas
> Cumulative COVID-19 cases as of June 17: 701 per 100,000 people — 78 out of 383 metro areas (total: 42,557)
> Cumulative COVID-19 deaths as of June 17: 27 per 100,000 people — 89 out of 383 metro areas (total: 1,654)
> Total population: 6.2 million
[in-text-ad]

34. Lebanon, PA
> Increase in daily avg. new COVID-19 cases week over week: +4.2 per 100,000 people
> Avg. new daily cases for week ending June 17: 12.4 per 100,000 people â 38 out of 383 metro areas
> Avg. new daily cases for week ending June 10: 8.3 per 100,000 people — 82 out of 383 metro areas
> Cumulative COVID-19 cases as of June 17: 865 per 100,000 people — 52 out of 383 metro areas (total: 1,200)
> Cumulative COVID-19 deaths as of June 17: 29 per 100,000 people — 83 out of 383 metro areas (total: 40)
> Total population: 141,314
[recirclink id=714099]

33. Birmingham-Hoover, AL
> Increase in daily avg. new COVID-19 cases week over week: +4.2 per 100,000 people
> Avg. new daily cases for week ending June 17: 8.3 per 100,000 people â 82 out of 383 metro areas
> Avg. new daily cases for week ending June 10: 4.1 per 100,000 people — 180 out of 383 metro areas
> Cumulative COVID-19 cases as of June 17: 360 per 100,000 people — 173 out of 383 metro areas (total: 3,893)
> Cumulative COVID-19 deaths as of June 17: 13 per 100,000 people — 164 out of 383 metro areas (total: 146)
> Total population: 1.2 million

32. Alexandria, LA
> Increase in daily avg. new COVID-19 cases week over week: +4.3 per 100,000 people
> Avg. new daily cases for week ending June 17: 21.2 per 100,000 people â 12 out of 383 metro areas
> Avg. new daily cases for week ending June 10: 16.8 per 100,000 people — 19 out of 383 metro areas
> Cumulative COVID-19 cases as of June 17: 838 per 100,000 people — 55 out of 383 metro areas (total: 1,290)
> Cumulative COVID-19 deaths as of June 17: 31 per 100,000 people — 74 out of 383 metro areas (total: 48)
> Total population: 153,044
[in-text-ad-2]

31. Orlando-Kissimmee-Sanford, FL
> Increase in daily avg. new COVID-19 cases week over week: +4.4 per 100,000 people
> Avg. new daily cases for week ending June 17: 7.1 per 100,000 people â 107 out of 383 metro areas
> Avg. new daily cases for week ending June 10: 2.7 per 100,000 people — 242 out of 383 metro areas
> Cumulative COVID-19 cases as of June 17: 241 per 100,000 people — 242 out of 383 metro areas (total: 5,904)
> Cumulative COVID-19 deaths as of June 17: 04 per 100,000 people — 278 out of 383 metro areas (total: 99)
> Total population: 2.6 million

30. Charleston-North Charleston, SC
> Increase in daily avg. new COVID-19 cases week over week: +4.4 per 100,000 people
> Avg. new daily cases for week ending June 17: 9.0 per 100,000 people â 71 out of 383 metro areas
> Avg. new daily cases for week ending June 10: 4.6 per 100,000 people — 162 out of 383 metro areas
> Cumulative COVID-19 cases as of June 17: 261 per 100,000 people — 230 out of 383 metro areas (total: 1,984)
> Cumulative COVID-19 deaths as of June 17: 05 per 100,000 people — 257 out of 383 metro areas (total: 40)
> Total population: 787,643
[in-text-ad]

29. Huntsville, AL
> Increase in daily avg. new COVID-19 cases week over week: +4.5 per 100,000 people
> Avg. new daily cases for week ending June 17: 6.9 per 100,000 people â 109 out of 383 metro areas
> Avg. new daily cases for week ending June 10: 2.3 per 100,000 people — 260 out of 383 metro areas
> Cumulative COVID-19 cases as of June 17: 182 per 100,000 people — 279 out of 383 metro areas (total: 819)
> Cumulative COVID-19 deaths as of June 17: 01 per 100,000 people — 346 out of 383 metro areas (total: 6)
> Total population: 462,693
[recirclink id=714282]

28. Lake Charles, LA
> Increase in daily avg. new COVID-19 cases week over week: +4.7 per 100,000 people
> Avg. new daily cases for week ending June 17: 7.8 per 100,000 people â 93 out of 383 metro areas
> Avg. new daily cases for week ending June 10: 3.1 per 100,000 people — 217 out of 383 metro areas
> Cumulative COVID-19 cases as of June 17: 404 per 100,000 people — 149 out of 383 metro areas (total: 836)
> Cumulative COVID-19 deaths as of June 17: 25 per 100,000 people — 97 out of 383 metro areas (total: 52)
> Total population: 209,548

27. Austin-Round Rock-Georgetown, TX
> Increase in daily avg. new COVID-19 cases week over week: +4.7 per 100,000 people
> Avg. new daily cases for week ending June 17: 9.3 per 100,000 people â 65 out of 383 metro areas
> Avg. new daily cases for week ending June 10: 4.6 per 100,000 people — 160 out of 383 metro areas
> Cumulative COVID-19 cases as of June 17: 359 per 100,000 people — 174 out of 383 metro areas (total: 7,393)
> Cumulative COVID-19 deaths as of June 17: 07 per 100,000 people — 229 out of 383 metro areas (total: 146)
> Total population: 2.2 million
[in-text-ad-2]

26. Kennewick-Richland, WA
> Increase in daily avg. new COVID-19 cases week over week: +4.7 per 100,000 people
> Avg. new daily cases for week ending June 17: 18.9 per 100,000 people â 18 out of 383 metro areas
> Avg. new daily cases for week ending June 10: 14.2 per 100,000 people — 25 out of 383 metro areas
> Cumulative COVID-19 cases as of June 17: 780 per 100,000 people — 62 out of 383 metro areas (total: 2,223)
> Cumulative COVID-19 deaths as of June 17: 35 per 100,000 people — 61 out of 383 metro areas (total: 100)
> Total population: 296,224

25. Florence-Muscle Shoals, AL
> Increase in daily avg. new COVID-19 cases week over week: +4.8 per 100,000 people
> Avg. new daily cases for week ending June 17: 9.8 per 100,000 people â 61 out of 383 metro areas
> Avg. new daily cases for week ending June 10: 5.0 per 100,000 people — 150 out of 383 metro areas
> Cumulative COVID-19 cases as of June 17: 368 per 100,000 people — 168 out of 383 metro areas (total: 541)
> Cumulative COVID-19 deaths as of June 17: 06 per 100,000 people — 244 out of 383 metro areas (total: 9)
> Total population: 147,149
[in-text-ad]

24. Columbia, SC
> Increase in daily avg. new COVID-19 cases week over week: +4.9 per 100,000 people
> Avg. new daily cases for week ending June 17: 14.7 per 100,000 people â 27 out of 383 metro areas
> Avg. new daily cases for week ending June 10: 9.7 per 100,000 people — 61 out of 383 metro areas
> Cumulative COVID-19 cases as of June 17: 556 per 100,000 people — 97 out of 383 metro areas (total: 4,542)
> Cumulative COVID-19 deaths as of June 17: 19 per 100,000 people — 130 out of 383 metro areas (total: 153)
> Total population: 833,165
[recirclink id=714428]

23. Columbus, GA-AL
> Increase in daily avg. new COVID-19 cases week over week: +5.0 per 100,000 people
> Avg. new daily cases for week ending June 17: 20.5 per 100,000 people â 15 out of 383 metro areas
> Avg. new daily cases for week ending June 10: 15.5 per 100,000 people — 22 out of 383 metro areas
> Cumulative COVID-19 cases as of June 17: 665 per 100,000 people — 84 out of 383 metro areas (total: 2,130)
> Cumulative COVID-19 deaths as of June 17: 13 per 100,000 people — 165 out of 383 metro areas (total: 43)
> Total population: 307,149
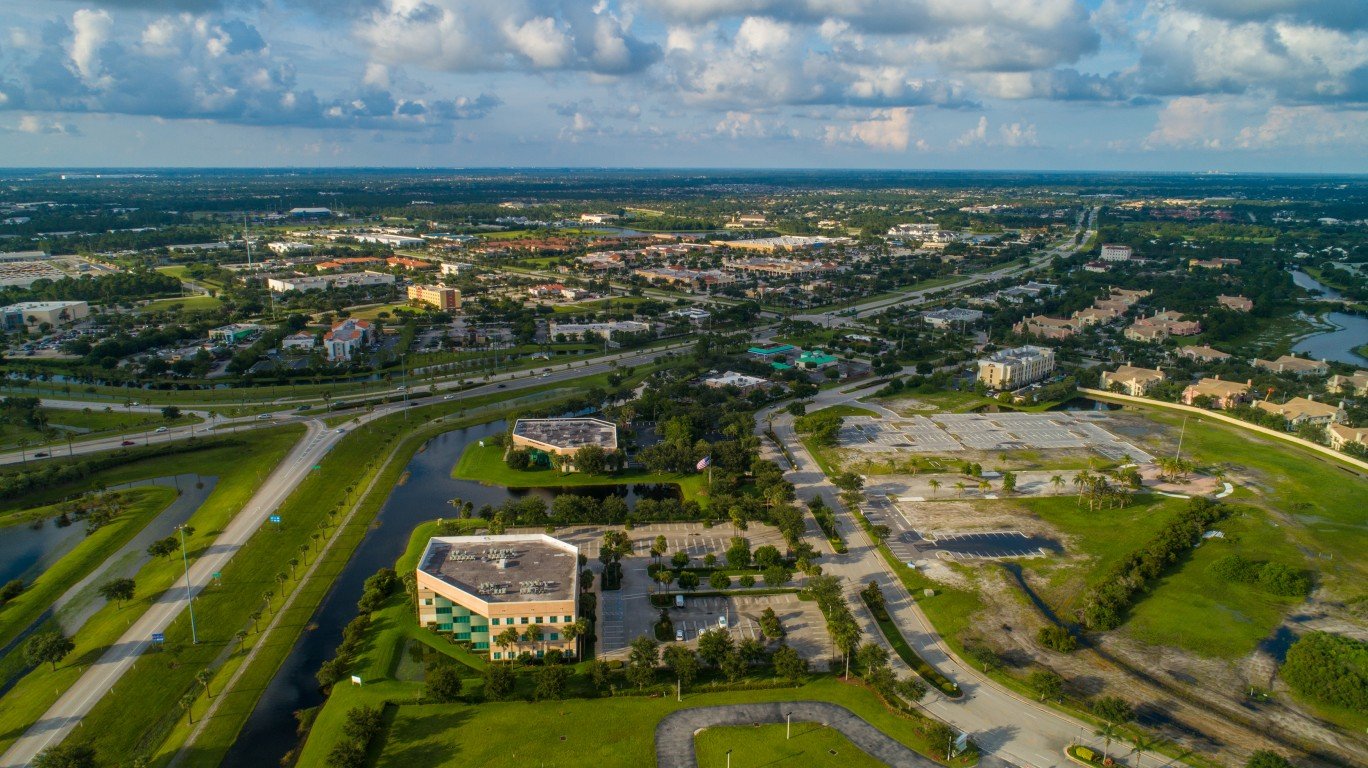
22. Port St. Lucie, FL
> Increase in daily avg. new COVID-19 cases week over week: +5.4 per 100,000 people
> Avg. new daily cases for week ending June 17: 17.3 per 100,000 people â 23 out of 383 metro areas
> Avg. new daily cases for week ending June 10: 11.9 per 100,000 people — 36 out of 383 metro areas
> Cumulative COVID-19 cases as of June 17: 507 per 100,000 people — 111 out of 383 metro areas (total: 2,348)
> Cumulative COVID-19 deaths as of June 17: 13 per 100,000 people — 170 out of 383 metro areas (total: 58)
> Total population: 482,040
[in-text-ad-2]

21. Pine Bluff, AR
> Increase in daily avg. new COVID-19 cases week over week: +5.6 per 100,000 people
> Avg. new daily cases for week ending June 17: 11.0 per 100,000 people â 49 out of 383 metro areas
> Avg. new daily cases for week ending June 10: 5.5 per 100,000 people — 140 out of 383 metro areas
> Cumulative COVID-19 cases as of June 17: 1,786 per 100,000 people — 10 out of 383 metro areas (total: 1,649)
> Cumulative COVID-19 deaths as of June 17: 42 per 100,000 people — 50 out of 383 metro areas (total: 39)
> Total population: 90,306
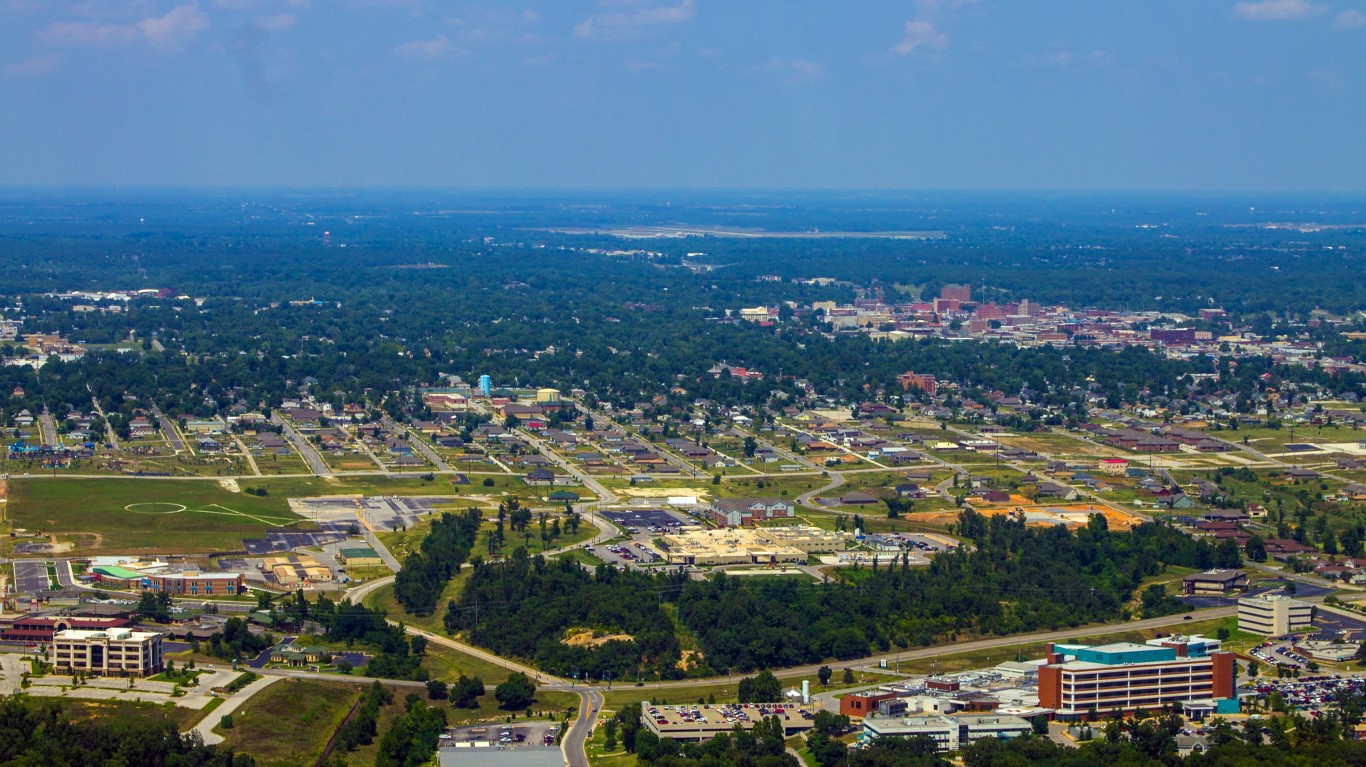
20. Joplin, MO
> Increase in daily avg. new COVID-19 cases week over week: +5.7 per 100,000 people
> Avg. new daily cases for week ending June 17: 7.9 per 100,000 people â 89 out of 383 metro areas
> Avg. new daily cases for week ending June 10: 2.2 per 100,000 people — 269 out of 383 metro areas
> Cumulative COVID-19 cases as of June 17: 128 per 100,000 people — 317 out of 383 metro areas (total: 228)
> Cumulative COVID-19 deaths as of June 17: 01 per 100,000 people — 352 out of 383 metro areas (total: 2)
> Total population: 178,902
[in-text-ad]
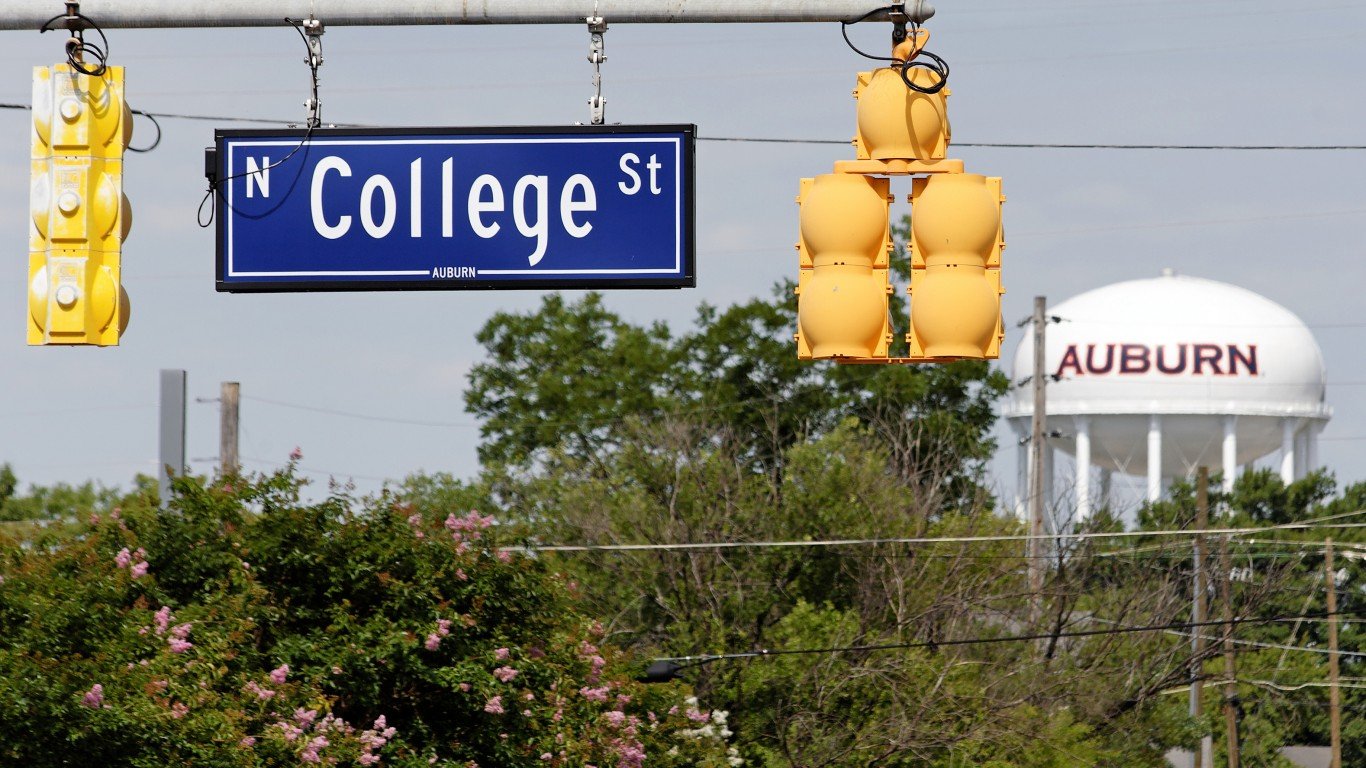
19. Auburn-Opelika, AL
> Increase in daily avg. new COVID-19 cases week over week: +5.8 per 100,000 people
> Avg. new daily cases for week ending June 17: 9.3 per 100,000 people â 67 out of 383 metro areas
> Avg. new daily cases for week ending June 10: 3.4 per 100,000 people — 201 out of 383 metro areas
> Cumulative COVID-19 cases as of June 17: 473 per 100,000 people — 122 out of 383 metro areas (total: 753)
> Cumulative COVID-19 deaths as of June 17: 22 per 100,000 people — 114 out of 383 metro areas (total: 35)
> Total population: 163,941
[recirclink id=713597]

18. Gainesville, FL
> Increase in daily avg. new COVID-19 cases week over week: +6.0 per 100,000 people
> Avg. new daily cases for week ending June 17: 8.6 per 100,000 people â 78 out of 383 metro areas
> Avg. new daily cases for week ending June 10: 2.6 per 100,000 people — 246 out of 383 metro areas
> Cumulative COVID-19 cases as of June 17: 244 per 100,000 people — 239 out of 383 metro areas (total: 784)
> Cumulative COVID-19 deaths as of June 17: 03 per 100,000 people — 289 out of 383 metro areas (total: 11)
> Total population: 288,711

17. Greenville-Anderson, SC
> Increase in daily avg. new COVID-19 cases week over week: +6.2 per 100,000 people
> Avg. new daily cases for week ending June 17: 15.8 per 100,000 people â 25 out of 383 metro areas
> Avg. new daily cases for week ending June 10: 9.7 per 100,000 people — 63 out of 383 metro areas
> Cumulative COVID-19 cases as of June 17: 456 per 100,000 people — 127 out of 383 metro areas (total: 4,031)
> Cumulative COVID-19 deaths as of June 17: 10 per 100,000 people — 191 out of 383 metro areas (total: 88)
> Total population: 906,626
[in-text-ad-2]

16. Hilton Head Island-Bluffton, SC
> Increase in daily avg. new COVID-19 cases week over week: +6.4 per 100,000 people
> Avg. new daily cases for week ending June 17: 10.9 per 100,000 people â 50 out of 383 metro areas
> Avg. new daily cases for week ending June 10: 4.5 per 100,000 people — 169 out of 383 metro areas
> Cumulative COVID-19 cases as of June 17: 347 per 100,000 people — 179 out of 383 metro areas (total: 730)
> Cumulative COVID-19 deaths as of June 17: 09 per 100,000 people — 207 out of 383 metro areas (total: 18)
> Total population: 217,686

15. Phoenix-Mesa-Chandler, AZ
> Increase in daily avg. new COVID-19 cases week over week: +6.6 per 100,000 people
> Avg. new daily cases for week ending June 17: 17.5 per 100,000 people â 21 out of 383 metro areas
> Avg. new daily cases for week ending June 10: 10.9 per 100,000 people — 50 out of 383 metro areas
> Cumulative COVID-19 cases as of June 17: 515 per 100,000 people — 109 out of 383 metro areas (total: 24,065)
> Cumulative COVID-19 deaths as of June 17: 13 per 100,000 people — 166 out of 383 metro areas (total: 626)
> Total population: 4.9 million
[in-text-ad]

14. Yuma, AZ
> Increase in daily avg. new COVID-19 cases week over week: +7.1 per 100,000 people
> Avg. new daily cases for week ending June 17: 69.6 per 100,000 people â 1 out of 383 metro areas
> Avg. new daily cases for week ending June 10: 62.6 per 100,000 people — 2 out of 383 metro areas
> Cumulative COVID-19 cases as of June 17: 1,662 per 100,000 people — 13 out of 383 metro areas (total: 3,454)
> Cumulative COVID-19 deaths as of June 17: 21 per 100,000 people — 122 out of 383 metro areas (total: 43)
> Total population: 212,128
[recirclink id=713661]

13. Lafayette, LA
> Increase in daily avg. new COVID-19 cases week over week: +7.2 per 100,000 people
> Avg. new daily cases for week ending June 17: 13.4 per 100,000 people â 32 out of 383 metro areas
> Avg. new daily cases for week ending June 10: 6.2 per 100,000 people — 119 out of 383 metro areas
> Cumulative COVID-19 cases as of June 17: 607 per 100,000 people — 91 out of 383 metro areas (total: 2,968)
> Cumulative COVID-19 deaths as of June 17: 28 per 100,000 people — 85 out of 383 metro areas (total: 139)
> Total population: 489,364

12. Monroe, LA
> Increase in daily avg. new COVID-19 cases week over week: +7.4 per 100,000 people
> Avg. new daily cases for week ending June 17: 26.6 per 100,000 people â 8 out of 383 metro areas
> Avg. new daily cases for week ending June 10: 19.2 per 100,000 people — 11 out of 383 metro areas
> Cumulative COVID-19 cases as of June 17: 1,227 per 100,000 people — 26 out of 383 metro areas (total: 2,510)
> Cumulative COVID-19 deaths as of June 17: 45 per 100,000 people — 46 out of 383 metro areas (total: 92)
> Total population: 176,805
[in-text-ad-2]

11. Ames, IA
> Increase in daily avg. new COVID-19 cases week over week: +7.4 per 100,000 people
> Avg. new daily cases for week ending June 17: 12.7 per 100,000 people â 36 out of 383 metro areas
> Avg. new daily cases for week ending June 10: 5.4 per 100,000 people — 145 out of 383 metro areas
> Cumulative COVID-19 cases as of June 17: 318 per 100,000 people — 195 out of 383 metro areas (total: 392)
> Cumulative COVID-19 deaths as of June 17: 03 per 100,000 people — 297 out of 383 metro areas (total: 4)
> Total population: 98,105

10. Chattanooga, TN-GA
> Increase in daily avg. new COVID-19 cases week over week: +9.1 per 100,000 people
> Avg. new daily cases for week ending June 17: 17.5 per 100,000 people â 22 out of 383 metro areas
> Avg. new daily cases for week ending June 10: 8.4 per 100,000 people — 80 out of 383 metro areas
> Cumulative COVID-19 cases as of June 17: 455 per 100,000 people — 128 out of 383 metro areas (total: 2,512)
> Cumulative COVID-19 deaths as of June 17: 06 per 100,000 people — 254 out of 383 metro areas (total: 31)
> Total population: 558,703
[in-text-ad]

9. Sumter, SC
> Increase in daily avg. new COVID-19 cases week over week: +9.5 per 100,000 people
> Avg. new daily cases for week ending June 17: 18.3 per 100,000 people â 20 out of 383 metro areas
> Avg. new daily cases for week ending June 10: 8.8 per 100,000 people — 75 out of 383 metro areas
> Cumulative COVID-19 cases as of June 17: 711 per 100,000 people — 76 out of 383 metro areas (total: 1,002)
> Cumulative COVID-19 deaths as of June 17: 43 per 100,000 people — 49 out of 383 metro areas (total: 60)
> Total population: 106,512
[recirclink id=713784]

8. Valdosta, GA
> Increase in daily avg. new COVID-19 cases week over week: +9.6 per 100,000 people
> Avg. new daily cases for week ending June 17: 27.4 per 100,000 people â 7 out of 383 metro areas
> Avg. new daily cases for week ending June 10: 17.8 per 100,000 people — 15 out of 383 metro areas
> Cumulative COVID-19 cases as of June 17: 778 per 100,000 people — 63 out of 383 metro areas (total: 1,124)
> Cumulative COVID-19 deaths as of June 17: 12 per 100,000 people — 176 out of 383 metro areas (total: 17)
> Total population: 145,577

7. Fayetteville-Springdale-Rogers, AR
> Increase in daily avg. new COVID-19 cases week over week: +10.2 per 100,000 people
> Avg. new daily cases for week ending June 17: 36.7 per 100,000 people â 4 out of 383 metro areas
> Avg. new daily cases for week ending June 10: 26.5 per 100,000 people — 5 out of 383 metro areas
> Cumulative COVID-19 cases as of June 17: 759 per 100,000 people — 67 out of 383 metro areas (total: 3,820)
> Cumulative COVID-19 deaths as of June 17: 05 per 100,000 people — 266 out of 383 metro areas (total: 24)
> Total population: 553,795
[in-text-ad-2]

6. Decatur, AL
> Increase in daily avg. new COVID-19 cases week over week: +10.2 per 100,000 people
> Avg. new daily cases for week ending June 17: 20.8 per 100,000 people â 14 out of 383 metro areas
> Avg. new daily cases for week ending June 10: 10.6 per 100,000 people — 53 out of 383 metro areas
> Cumulative COVID-19 cases as of June 17: 488 per 100,000 people — 116 out of 383 metro areas (total: 743)
> Cumulative COVID-19 deaths as of June 17: 01 per 100,000 people — 348 out of 383 metro areas (total: 2)
> Total population: 152,046

5. Myrtle Beach-Conway-North Myrtle Beach, SC-NC
> Increase in daily avg. new COVID-19 cases week over week: +10.4 per 100,000 people
> Avg. new daily cases for week ending June 17: 18.3 per 100,000 people â 19 out of 383 metro areas
> Avg. new daily cases for week ending June 10: 7.9 per 100,000 people — 90 out of 383 metro areas
> Cumulative COVID-19 cases as of June 17: 376 per 100,000 people — 160 out of 383 metro areas (total: 1,685)
> Cumulative COVID-19 deaths as of June 17: 08 per 100,000 people — 208 out of 383 metro areas (total: 38)
> Total population: 480,891
[in-text-ad]

4. Burlington, NC
> Increase in daily avg. new COVID-19 cases week over week: +10.7 per 100,000 people
> Avg. new daily cases for week ending June 17: 22.2 per 100,000 people â 11 out of 383 metro areas
> Avg. new daily cases for week ending June 10: 11.5 per 100,000 people — 39 out of 383 metro areas
> Cumulative COVID-19 cases as of June 17: 504 per 100,000 people — 112 out of 383 metro areas (total: 810)
> Cumulative COVID-19 deaths as of June 17: 22 per 100,000 people — 117 out of 383 metro areas (total: 35)
> Total population: 166,436
[recirclink id=714099]

3. Tuscaloosa, AL
> Increase in daily avg. new COVID-19 cases week over week: +12.7 per 100,000 people
> Avg. new daily cases for week ending June 17: 24.5 per 100,000 people â 9 out of 383 metro areas
> Avg. new daily cases for week ending June 10: 11.8 per 100,000 people — 37 out of 383 metro areas
> Cumulative COVID-19 cases as of June 17: 773 per 100,000 people — 65 out of 383 metro areas (total: 1,932)
> Cumulative COVID-19 deaths as of June 17: 20 per 100,000 people — 123 out of 383 metro areas (total: 51)
> Total population: 244,895

2. Beaumont-Port Arthur, TX
> Increase in daily avg. new COVID-19 cases week over week: +14.2 per 100,000 people
> Avg. new daily cases for week ending June 17: 20.1 per 100,000 people â 17 out of 383 metro areas
> Avg. new daily cases for week ending June 10: 5.9 per 100,000 people — 126 out of 383 metro areas
> Cumulative COVID-19 cases as of June 17: 402 per 100,000 people — 150 out of 383 metro areas (total: 1,592)
> Cumulative COVID-19 deaths as of June 17: 10 per 100,000 people — 188 out of 383 metro areas (total: 40)
> Total population: 410,233
[in-text-ad-2]

1. Montgomery, AL
> Increase in daily avg. new COVID-19 cases week over week: +16.3 per 100,000 people
> Avg. new daily cases for week ending June 17: 36.5 per 100,000 people â 5 out of 383 metro areas
> Avg. new daily cases for week ending June 10: 20.2 per 100,000 people — 10 out of 383 metro areas
> Cumulative COVID-19 cases as of June 17: 1,152 per 100,000 people — 28 out of 383 metro areas (total: 4,302)
> Cumulative COVID-19 deaths as of June 17: 27 per 100,000 people — 91 out of 383 metro areas (total: 101)
> Total population: 373,401
Contact [email protected] for any questions or corrections.