While the number of new COVID-19 cases reported each day has begun to decline nationwide, life is by no means returning to normal. While daily new cases are declining nationwide, they remain high compared to earlier in the summer. On Aug. 17, the U.S. reported 39,169 new coronavirus cases, the lowest figure in more than a month. Still, even this figure was more than double the fewer than 20,000 daily cases regularly reported in early June.
Further, while national daily cases are declining, at a more local level, there are still cities where COVID-19 continues to spread at a growing rate.
Using data from state and local health departments, 24/7 Wall St. compiled and reviewed the average number of new daily confirmed COVID-19 cases for the week ending Aug. 17 and compared it to the average from the previous week to determine the cities where the virus is growing the fastest. For comparison purposes, we adjusted the number of confirmed cases per 100,000 people. We excluded metropolitan areas with fewer than 20 new daily cases as of the most recent week.
Nationwide, the average number of new daily cases fell slightly, week-over-week, by 1.9 cases per 100,000 people. Average daily cases in the 31 metro areas on this list climbed by at least 5 cases per 100,000 residents this week compared to the previous one, and by as many as 58 per 100,000.
A small number of states are home to the vast majority of cities on this list. In particular, California is home to more than half of the 31 metropolitan areas on this list. California is one of just three states to report an increase of at least two daily new cases per 100,000 people, week-over-week. These are the states where the virus spread is slowing, and where it is still getting worse.
Click here to see the cities where COVID-19 is growing the fastest

31. Dover, DE
> Change in daily avg. new COVID-19 cases week over week: +5.2 per 100,000 people
> Avg. new daily cases in 7 days ending Aug. 17: 12.8 per 100,000 people
> Avg. new daily cases in 7 days ending Aug. 10: 7.6 per 100,000 people
> Cumulative confirmed COVID-19 cases as of Aug. 17: 1,428 per 100,000 people (total: 2,496)
> COVID-19 related deaths as of Aug. 17: 108
> Population: 178,550
> Avg. new daily cases in Delaware in 7 days ending Aug. 17: 11 per 100,000 (19th fewest)
[in-text-ad]

30. Urban Honolulu, HI
> Change in daily avg. new COVID-19 cases week over week: +5.3 per 100,000 people
> Avg. new daily cases in 7 days ending Aug. 17: 19.7 per 100,000 people
> Avg. new daily cases in 7 days ending Aug. 10: 14.4 per 100,000 people
> Cumulative confirmed COVID-19 cases as of Aug. 17: 481 per 100,000 people (total: 4,754)
> COVID-19 related deaths as of Aug. 17: 33
> Population: 980,080
> Avg. new daily cases in Hawaii in 7 days ending Aug. 17: 14 per 100,000 (23rd most)
[recirclink id=729561]

29. San Jose-Sunnyvale-Santa Clara, CA
> Change in daily avg. new COVID-19 cases week over week: +5.4 per 100,000 people
> Avg. new daily cases in 7 days ending Aug. 17: 16.7 per 100,000 people
> Avg. new daily cases in 7 days ending Aug. 10: 11.3 per 100,000 people
> Cumulative confirmed COVID-19 cases as of Aug. 17: 764 per 100,000 people (total: 15,144)
> COVID-19 related deaths as of Aug. 17: 213
> Population: 1,999,107
> Avg. new daily cases in California in 7 days ending Aug. 17: 21 per 100,000 (10th most)

28. Jefferson City, MO
> Change in daily avg. new COVID-19 cases week over week: +5.4 per 100,000 people
> Avg. new daily cases in 7 days ending Aug. 17: 19.5 per 100,000 people
> Avg. new daily cases in 7 days ending Aug. 10: 14.1 per 100,000 people
> Cumulative confirmed COVID-19 cases as of Aug. 17: 678 per 100,000 people (total: 1,025)
> COVID-19 related deaths as of Aug. 17: 7
> Population: 150,243
> Avg. new daily cases in Missouri in 7 days ending Aug. 17: 19 per 100,000 (12th most)
[in-text-ad-2]
27. Terre Haute, IN
> Change in daily avg. new COVID-19 cases week over week: +6.0 per 100,000 people
> Avg. new daily cases in 7 days ending Aug. 17: 23.9 per 100,000 people
> Avg. new daily cases in 7 days ending Aug. 10: 17.8 per 100,000 people
> Cumulative confirmed COVID-19 cases as of Aug. 17: 726 per 100,000 people (total: 1,360)
> COVID-19 related deaths as of Aug. 17: 20
> Population: 168,679
> Avg. new daily cases in Indiana in 7 days ending Aug. 17: 14 per 100,000 (21st most)
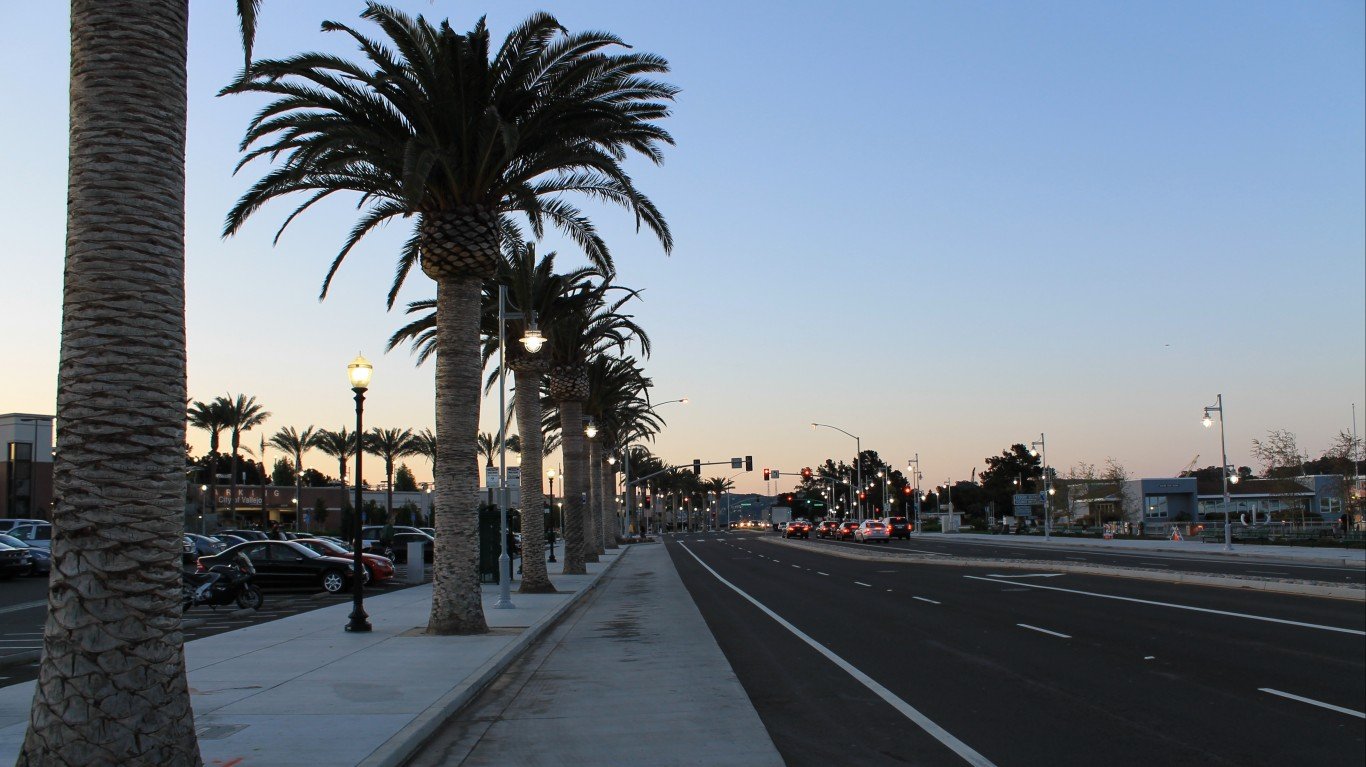
26. Vallejo, CA
> Change in daily avg. new COVID-19 cases week over week: +6.1 per 100,000 people
> Avg. new daily cases in 7 days ending Aug. 17: 17.5 per 100,000 people
> Avg. new daily cases in 7 days ending Aug. 10: 11.4 per 100,000 people
> Cumulative confirmed COVID-19 cases as of Aug. 17: 1,021 per 100,000 people (total: 4,479)
> COVID-19 related deaths as of Aug. 17: 41
> Population: 446,610
> Avg. new daily cases in California in 7 days ending Aug. 17: 21 per 100,000 (10th most)
[in-text-ad]
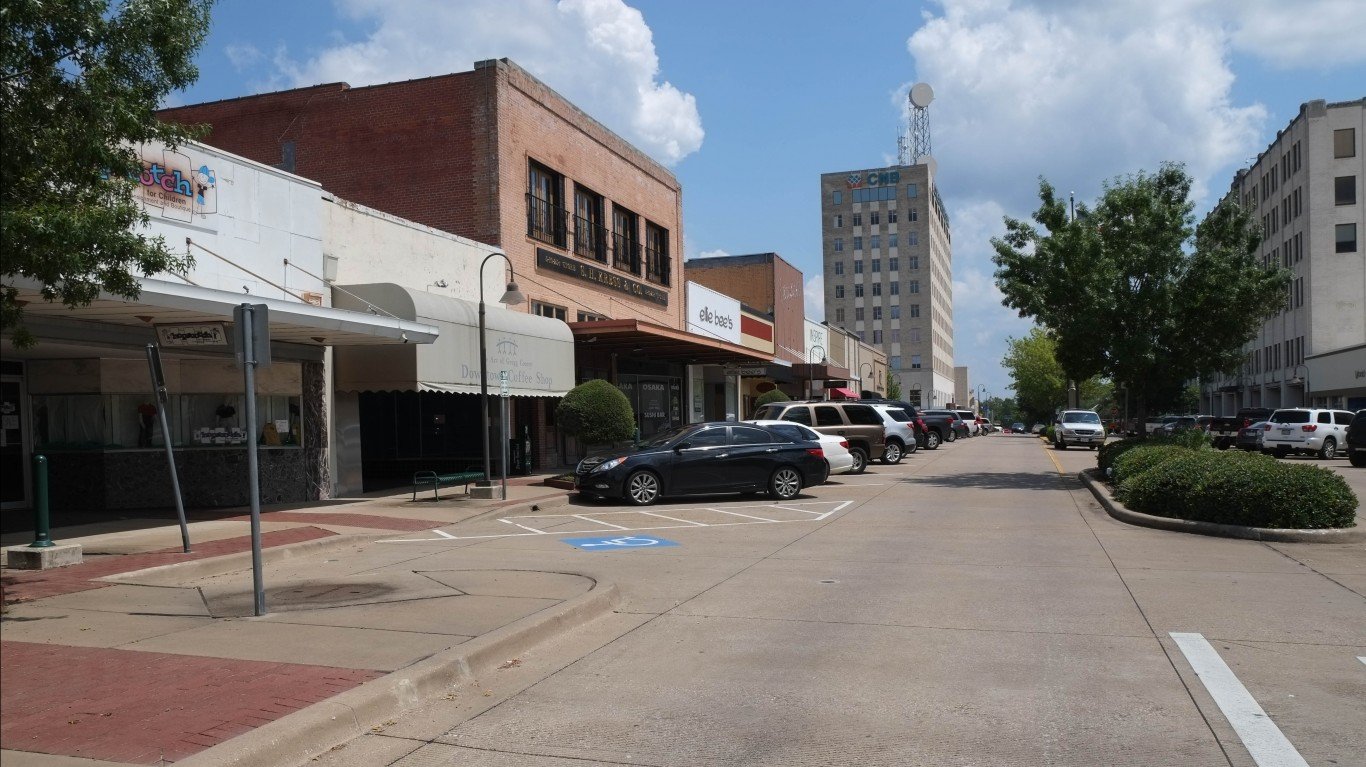
25. Longview, TX
> Change in daily avg. new COVID-19 cases week over week: +6.7 per 100,000 people
> Avg. new daily cases in 7 days ending Aug. 17: 18.0 per 100,000 people
> Avg. new daily cases in 7 days ending Aug. 10: 11.3 per 100,000 people
> Cumulative confirmed COVID-19 cases as of Aug. 17: 1,071 per 100,000 people (total: 3,048)
> COVID-19 related deaths as of Aug. 17: 76
> Population: 219,417
> Avg. new daily cases in Texas in 7 days ending Aug. 17: 24 per 100,000 (7th most)
[recirclink id=730004]

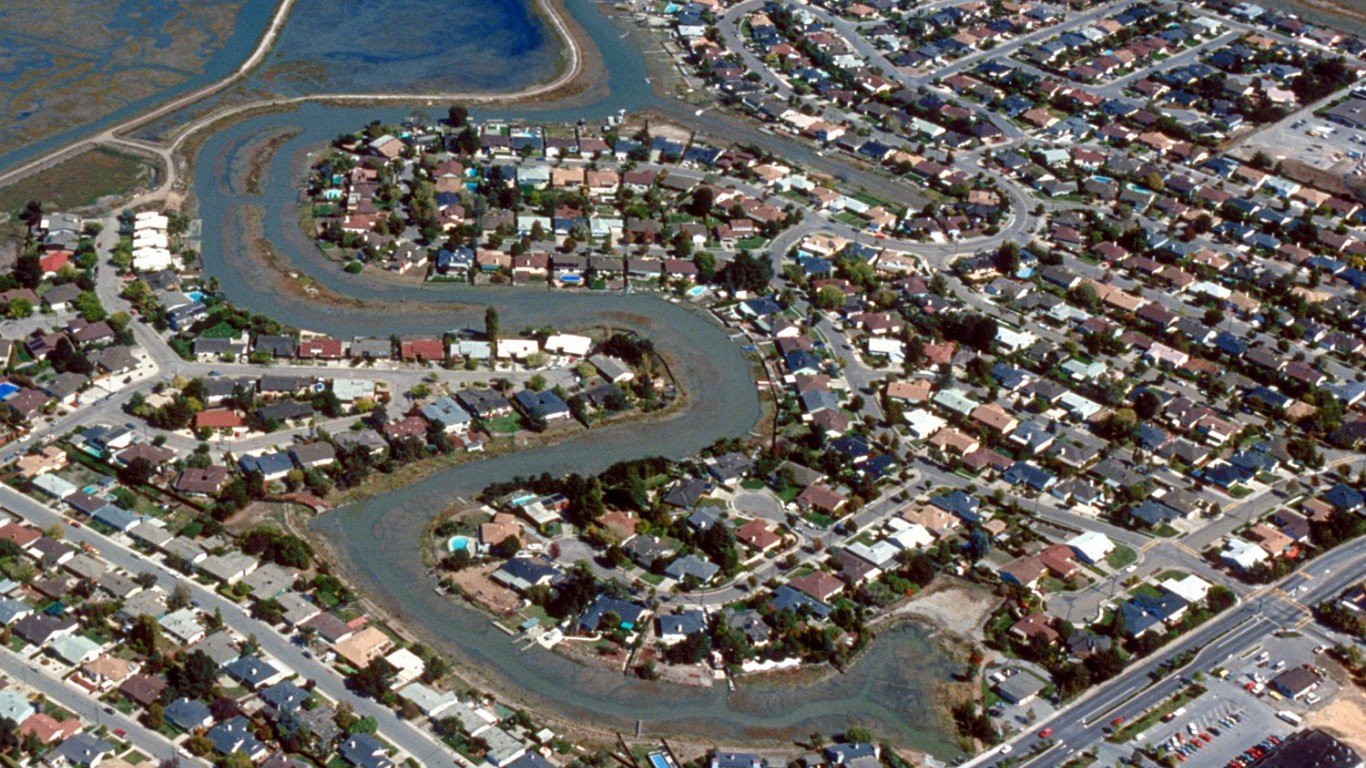
24. San Francisco-Oakland-Berkeley, CA
> Change in daily avg. new COVID-19 cases week over week: +6.7 per 100,000 people
> Avg. new daily cases in 7 days ending Aug. 17: 17.4 per 100,000 people
> Avg. new daily cases in 7 days ending Aug. 10: 10.7 per 100,000 people
> Cumulative confirmed COVID-19 cases as of Aug. 17: 1,001 per 100,000 people (total: 46,801)
> COVID-19 related deaths as of Aug. 17: 655
> Population: 4,729,484
> Avg. new daily cases in California in 7 days ending Aug. 17: 21 per 100,000 (10th most)
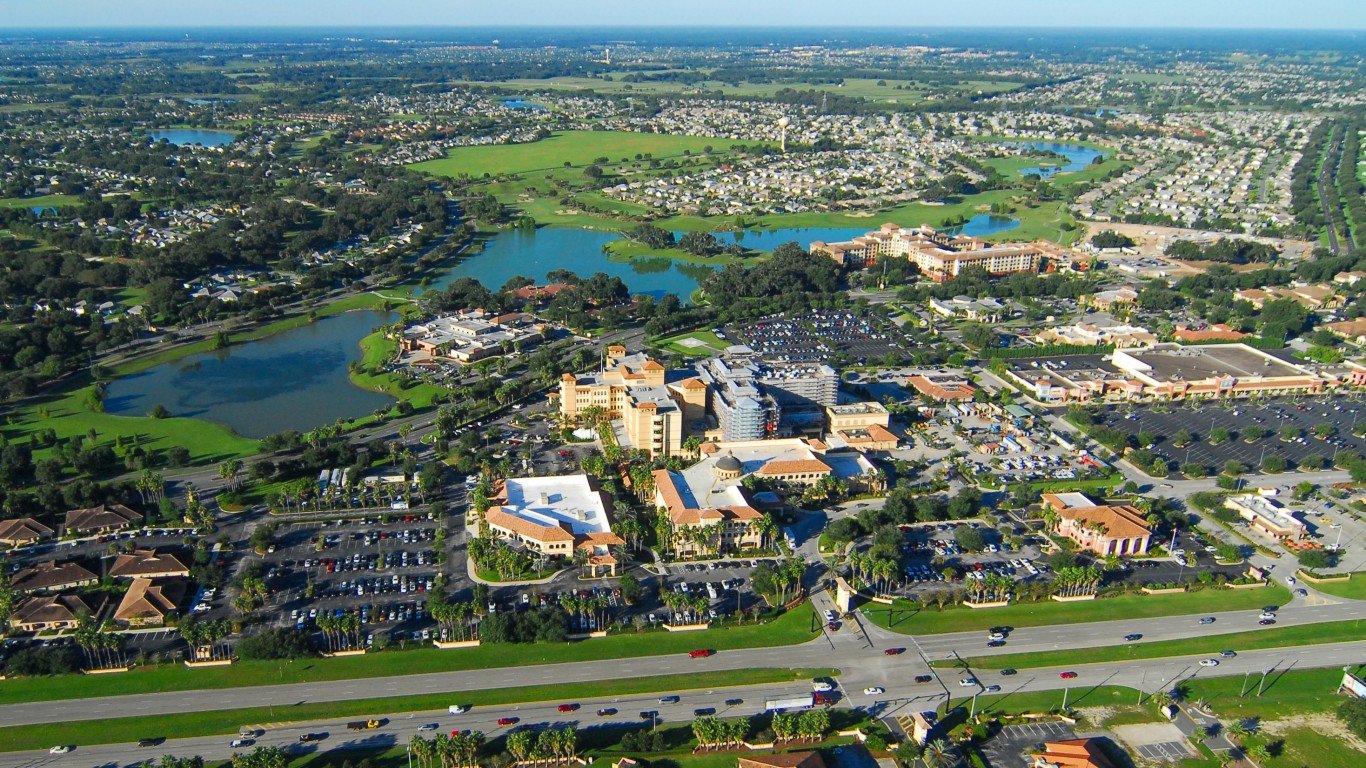
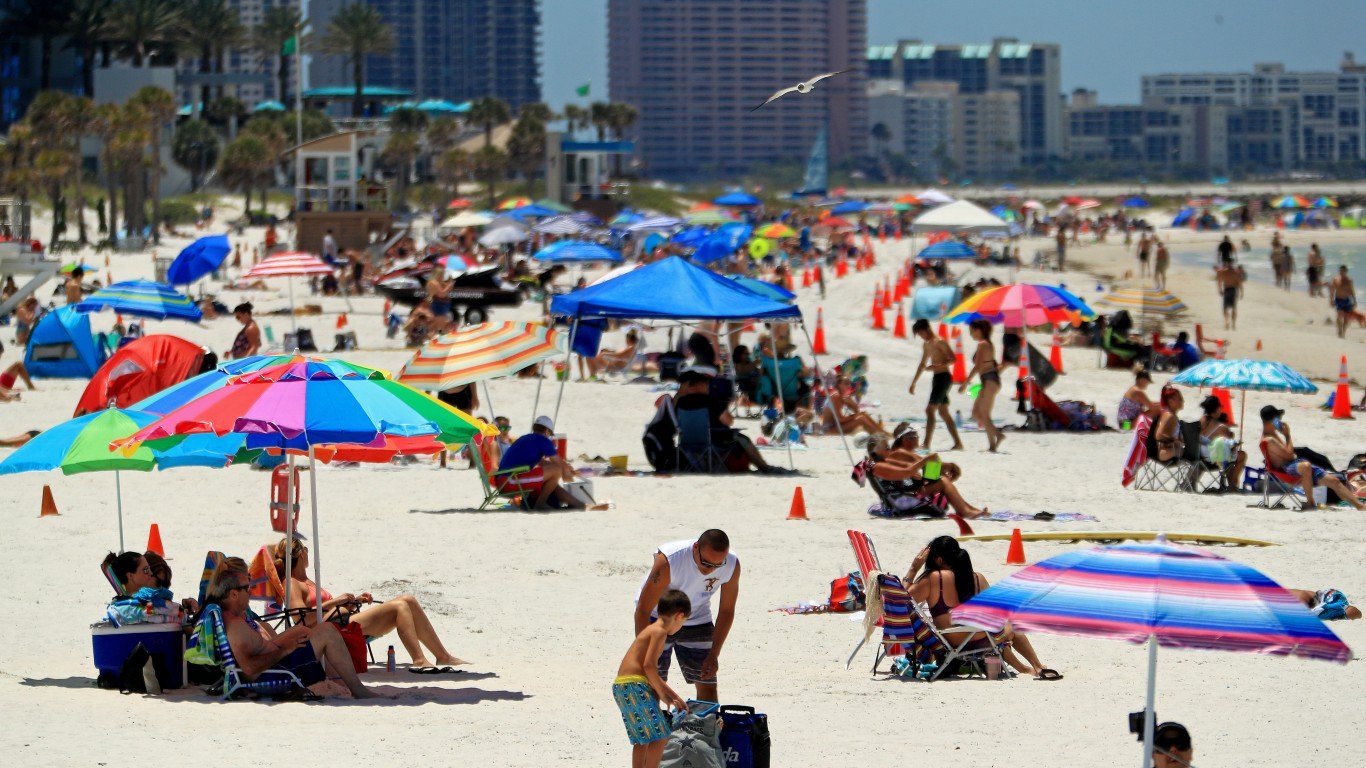
23. The Villages, FL
> Change in daily avg. new COVID-19 cases week over week: +6.9 per 100,000 people
> Avg. new daily cases in 7 days ending Aug. 17: 25.2 per 100,000 people
> Avg. new daily cases in 7 days ending Aug. 10: 18.2 per 100,000 people
> Cumulative confirmed COVID-19 cases as of Aug. 17: 1,288 per 100,000 people (total: 1,558)
> COVID-19 related deaths as of Aug. 17: 44
> Population: 128,754
> Avg. new daily cases in Florida in 7 days ending Aug. 17: 30 per 100,000 (2nd most)
[in-text-ad-2]
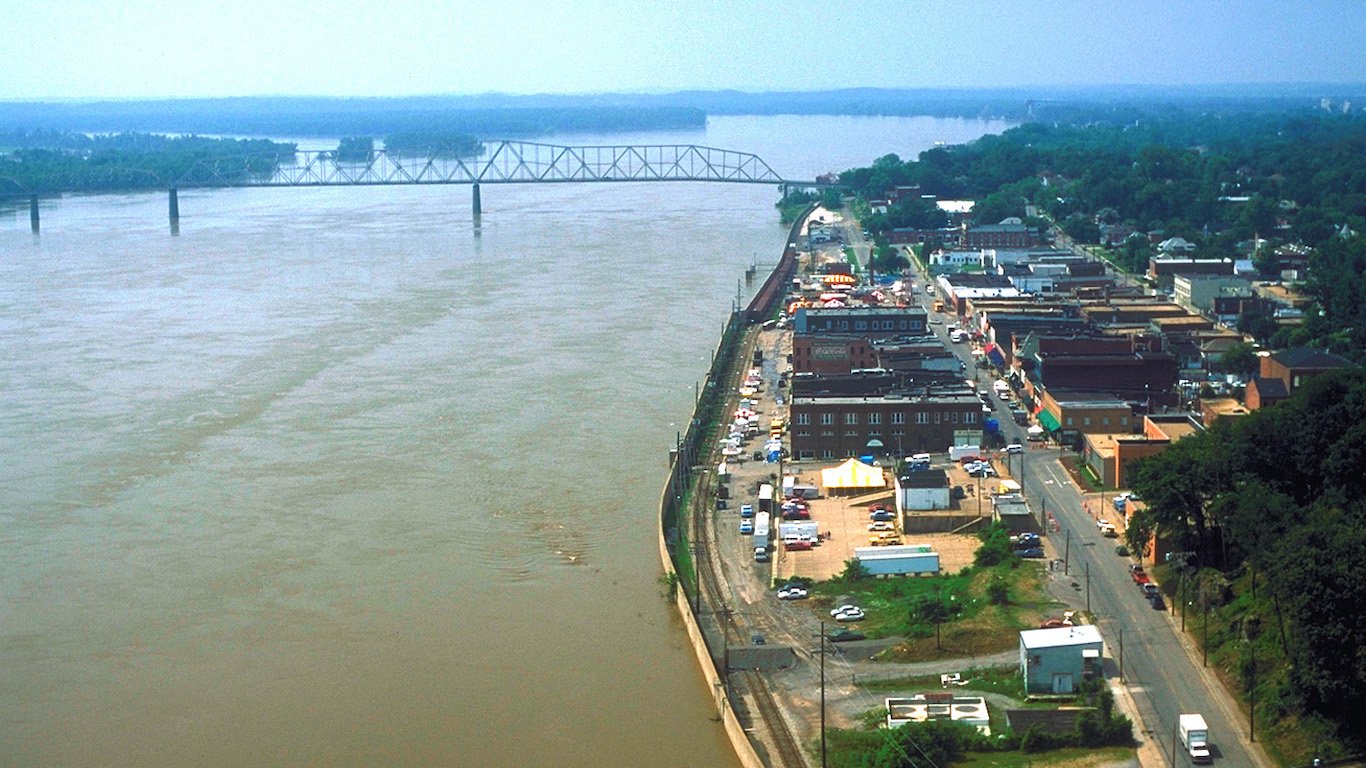
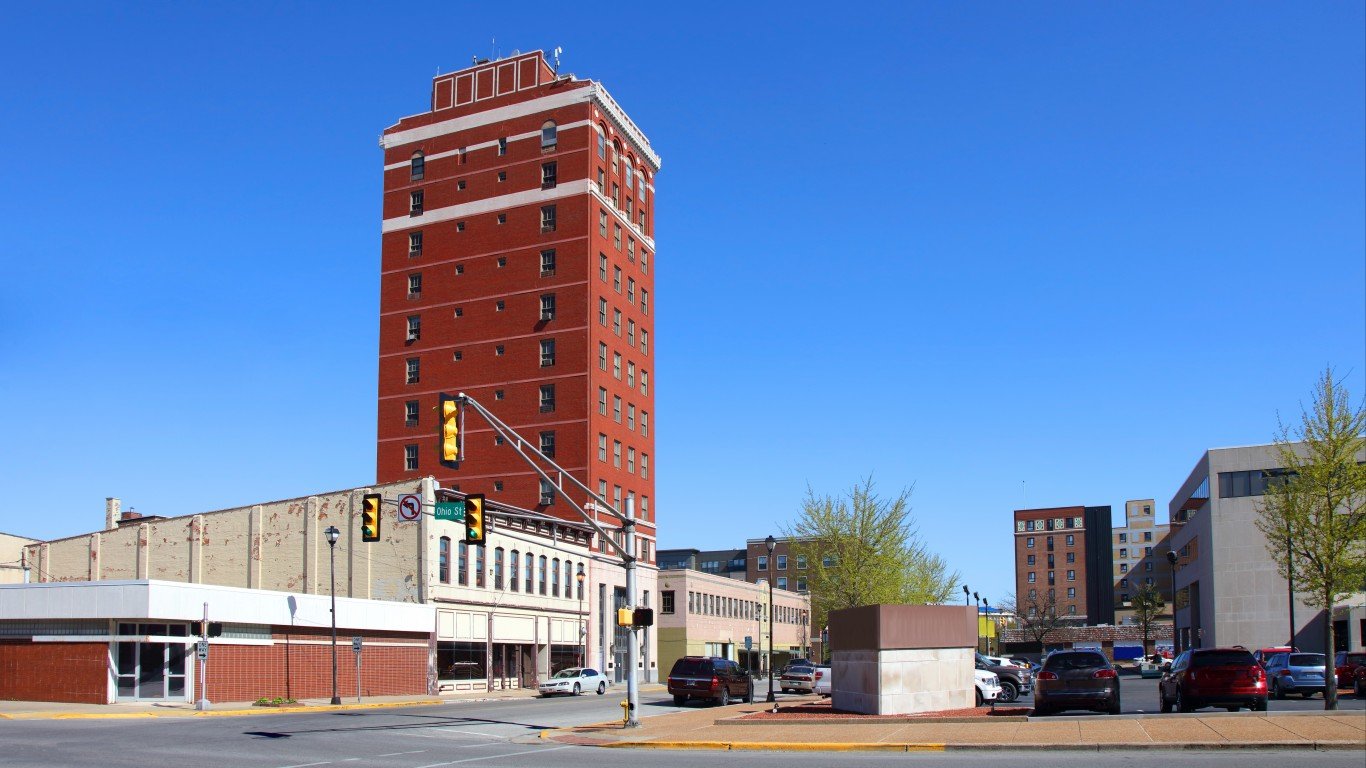
22. Cape Girardeau, MO-IL
> Change in daily avg. new COVID-19 cases week over week: +7.2 per 100,000 people
> Avg. new daily cases in 7 days ending Aug. 17: 15.4 per 100,000 people
> Avg. new daily cases in 7 days ending Aug. 10: 8.2 per 100,000 people
> Cumulative confirmed COVID-19 cases as of Aug. 17: 918 per 100,000 people (total: 892)
> COVID-19 related deaths as of Aug. 17: 7
> Population: 93,647
> Avg. new daily cases in Missouri in 7 days ending Aug. 17: 19 per 100,000 (12th most)

21. Chico, CA
> Change in daily avg. new COVID-19 cases week over week: +7.4 per 100,000 people
> Avg. new daily cases in 7 days ending Aug. 17: 17.0 per 100,000 people
> Avg. new daily cases in 7 days ending Aug. 10: 9.6 per 100,000 people
> Cumulative confirmed COVID-19 cases as of Aug. 17: 631 per 100,000 people (total: 1,432)
> COVID-19 related deaths as of Aug. 17: 12
> Population: 231,256
> Avg. new daily cases in California in 7 days ending Aug. 17: 21 per 100,000 (10th most)
[in-text-ad]
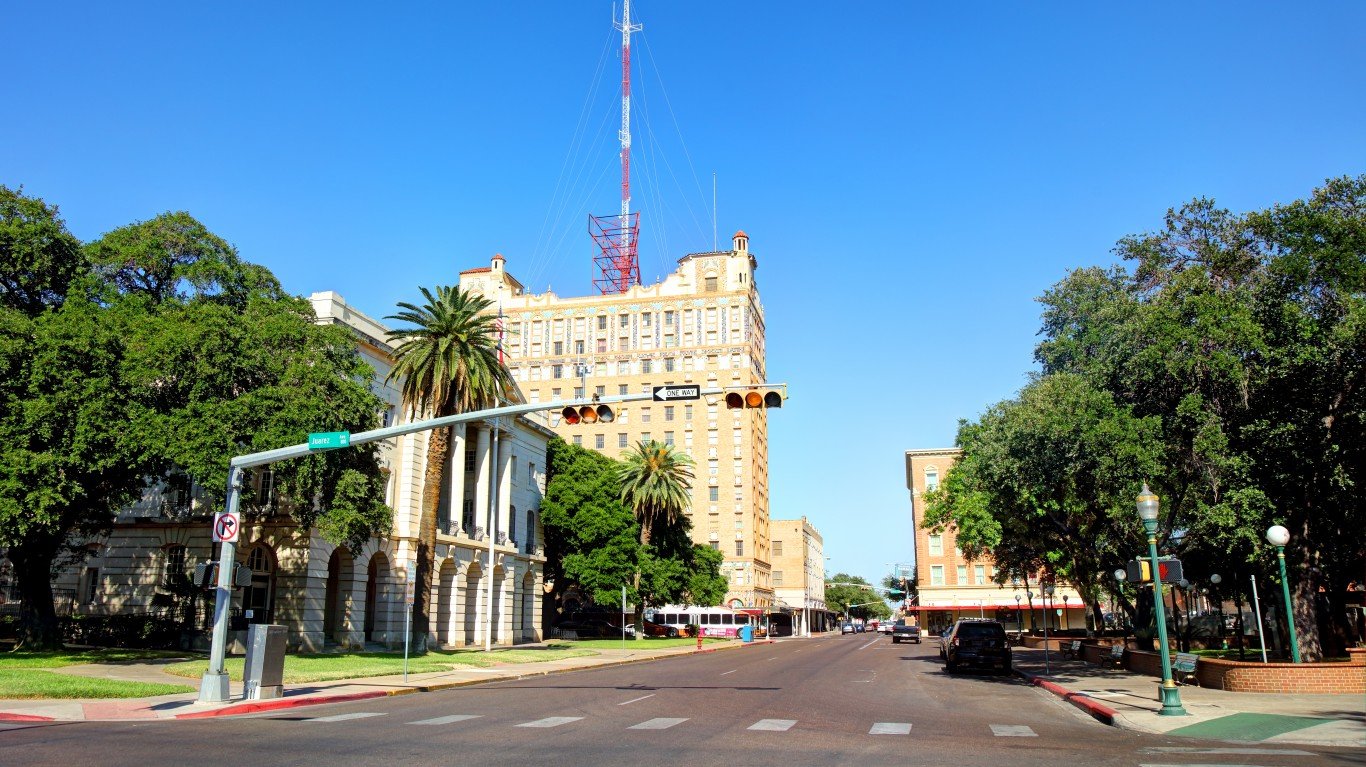
20. Laredo, TX
> Change in daily avg. new COVID-19 cases week over week: +7.6 per 100,000 people
> Avg. new daily cases in 7 days ending Aug. 17: 87.3 per 100,000 people
> Avg. new daily cases in 7 days ending Aug. 10: 79.8 per 100,000 people
> Cumulative confirmed COVID-19 cases as of Aug. 17: 3,511 per 100,000 people (total: 9,552)
> COVID-19 related deaths as of Aug. 17: 130
> Population: 275,910
> Avg. new daily cases in Texas in 7 days ending Aug. 17: 24 per 100,000 (7th most)
[recirclink id=729967]

19. Santa Maria-Santa Barbara, CA
> Change in daily avg. new COVID-19 cases week over week: +7.9 per 100,000 people
> Avg. new daily cases in 7 days ending Aug. 17: 17.7 per 100,000 people
> Avg. new daily cases in 7 days ending Aug. 10: 9.9 per 100,000 people
> Cumulative confirmed COVID-19 cases as of Aug. 17: 1,660 per 100,000 people (total: 7,368)
> COVID-19 related deaths as of Aug. 17: 77
> Population: 446,527
> Avg. new daily cases in California in 7 days ending Aug. 17: 21 per 100,000 (10th most)

18. Columbus, IN
> Change in daily avg. new COVID-19 cases week over week: +8.3 per 100,000 people
> Avg. new daily cases in 7 days ending Aug. 17: 16.9 per 100,000 people
> Avg. new daily cases in 7 days ending Aug. 10: 8.6 per 100,000 people
> Cumulative confirmed COVID-19 cases as of Aug. 17: 1,128 per 100,000 people (total: 924)
> COVID-19 related deaths as of Aug. 17: 47
> Population: 82,753
> Avg. new daily cases in Indiana in 7 days ending Aug. 17: 14 per 100,000 (21st most)
[in-text-ad-2]
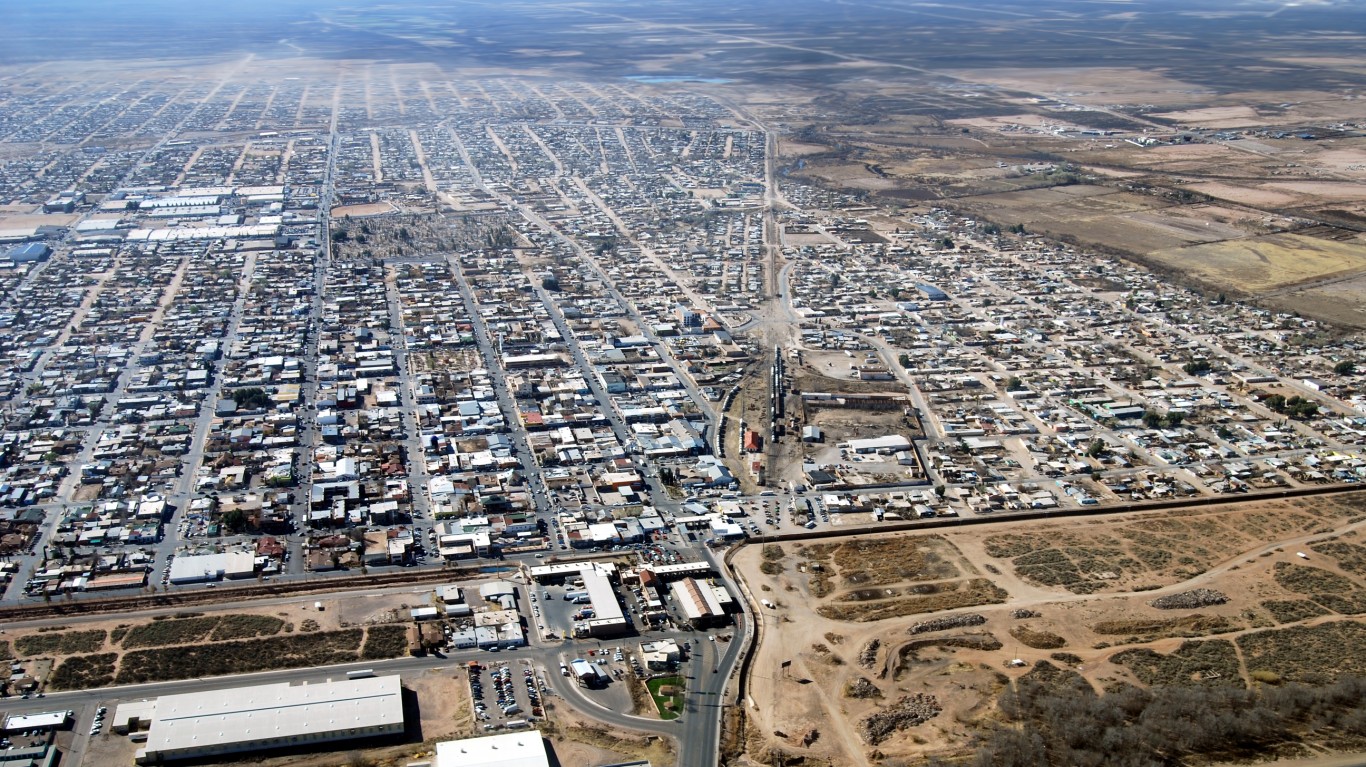
17. Sierra Vista-Douglas, AZ
> Change in daily avg. new COVID-19 cases week over week: +9.1 per 100,000 people
> Avg. new daily cases in 7 days ending Aug. 17: 19.0 per 100,000 people
> Avg. new daily cases in 7 days ending Aug. 10: 10.0 per 100,000 people
> Cumulative confirmed COVID-19 cases as of Aug. 17: 1,395 per 100,000 people (total: 1,762)
> COVID-19 related deaths as of Aug. 17: 57
> Population: 126,770
> Avg. new daily cases in Arizona in 7 days ending Aug. 17: 14 per 100,000 (18th most)

16. Ames, IA
> Change in daily avg. new COVID-19 cases week over week: +9.9 per 100,000 people
> Avg. new daily cases in 7 days ending Aug. 17: 18.8 per 100,000 people
> Avg. new daily cases in 7 days ending Aug. 10: 9.0 per 100,000 people
> Cumulative confirmed COVID-19 cases as of Aug. 17: 1,383 per 100,000 people (total: 1,706)
> COVID-19 related deaths as of Aug. 17: 18
> Population: 98,105
> Avg. new daily cases in Iowa in 7 days ending Aug. 17: 15 per 100,000 (16th most)
[in-text-ad]

15. Salinas, CA
> Change in daily avg. new COVID-19 cases week over week: +10.4 per 100,000 people
> Avg. new daily cases in 7 days ending Aug. 17: 31.6 per 100,000 people
> Avg. new daily cases in 7 days ending Aug. 10: 21.2 per 100,000 people
> Cumulative confirmed COVID-19 cases as of Aug. 17: 1,504 per 100,000 people (total: 6,516)
> COVID-19 related deaths as of Aug. 17: 46
> Population: 435,594
> Avg. new daily cases in California in 7 days ending Aug. 17: 21 per 100,000 (10th most)
[recirclink id=730024]
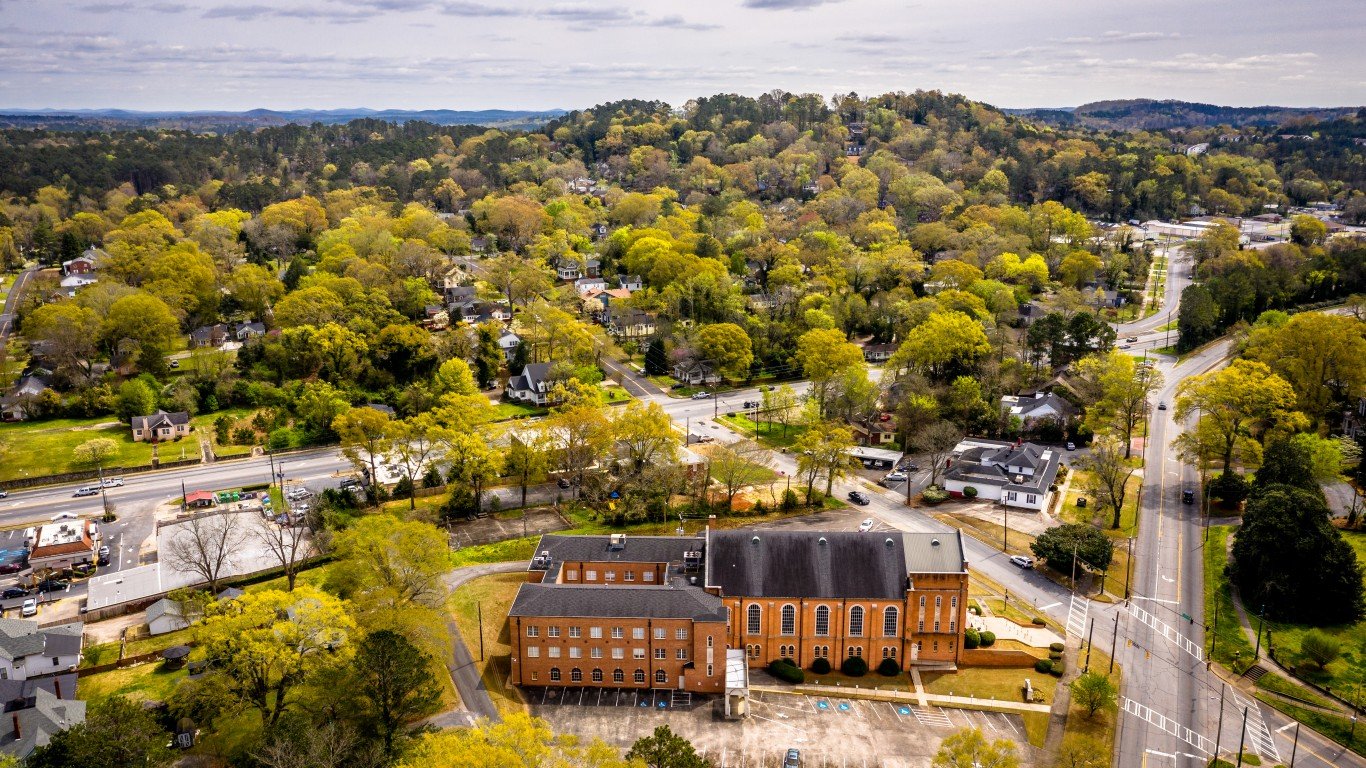
14. Rome, GA
> Change in daily avg. new COVID-19 cases week over week: +11.1 per 100,000 people
> Avg. new daily cases in 7 days ending Aug. 17: 44.3 per 100,000 people
> Avg. new daily cases in 7 days ending Aug. 10: 33.3 per 100,000 people
> Cumulative confirmed COVID-19 cases as of Aug. 17: 1,883 per 100,000 people (total: 1,823)
> COVID-19 related deaths as of Aug. 17: 20
> Population: 97,927
> Avg. new daily cases in Georgia in 7 days ending Aug. 17: 31 per 100,000 (the most)

13. Enid, OK
> Change in daily avg. new COVID-19 cases week over week: +12.3 per 100,000 people
> Avg. new daily cases in 7 days ending Aug. 17: 30.8 per 100,000 people
> Avg. new daily cases in 7 days ending Aug. 10: 18.5 per 100,000 people
> Cumulative confirmed COVID-19 cases as of Aug. 17: 992 per 100,000 people (total: 617)
> COVID-19 related deaths as of Aug. 17: 8
> Population: 60,913
> Avg. new daily cases in Oklahoma in 7 days ending Aug. 17: 17 per 100,000 (15th most)
[in-text-ad-2]

12. Sacramento-Roseville-Folsom, CA
> Change in daily avg. new COVID-19 cases week over week: +12.3 per 100,000 people
> Avg. new daily cases in 7 days ending Aug. 17: 21.0 per 100,000 people
> Avg. new daily cases in 7 days ending Aug. 10: 8.7 per 100,000 people
> Cumulative confirmed COVID-19 cases as of Aug. 17: 859 per 100,000 people (total: 19,693)
> COVID-19 related deaths as of Aug. 17: 275
> Population: 2,345,210
> Avg. new daily cases in California in 7 days ending Aug. 17: 21 per 100,000 (10th most)
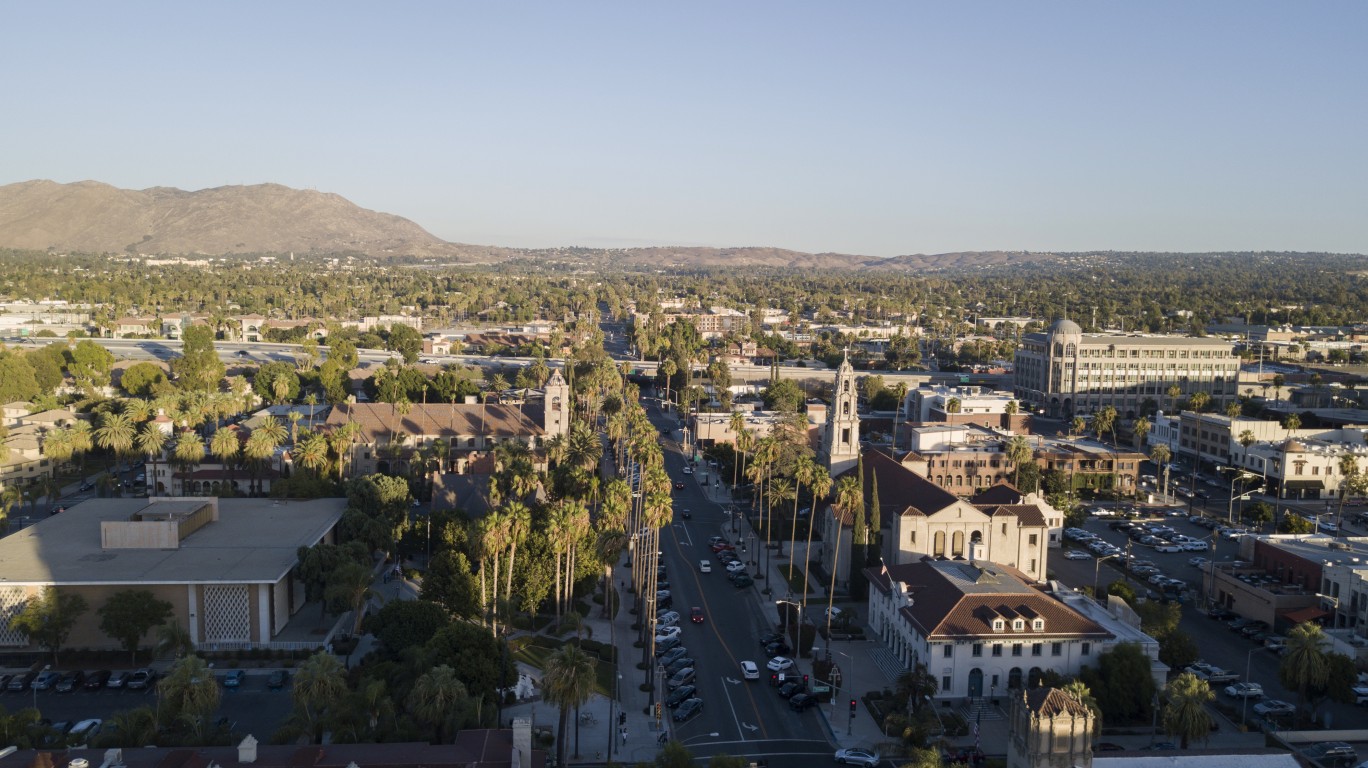
11. Riverside-San Bernardino-Ontario, CA
> Change in daily avg. new COVID-19 cases week over week: +13.4 per 100,000 people
> Avg. new daily cases in 7 days ending Aug. 17: 32.1 per 100,000 people
> Avg. new daily cases in 7 days ending Aug. 10: 18.7 per 100,000 people
> Cumulative confirmed COVID-19 cases as of Aug. 17: 1,978 per 100,000 people (total: 89,393)
> COVID-19 related deaths as of Aug. 17: 1,449
> Population: 4,622,361
> Avg. new daily cases in California in 7 days ending Aug. 17: 21 per 100,000 (10th most)
[in-text-ad]

10. Hanford-Corcoran, CA
> Change in daily avg. new COVID-19 cases week over week: +14.7 per 100,000 people
> Avg. new daily cases in 7 days ending Aug. 17: 57.1 per 100,000 people
> Avg. new daily cases in 7 days ending Aug. 10: 42.4 per 100,000 people
> Cumulative confirmed COVID-19 cases as of Aug. 17: 3,429 per 100,000 people (total: 5,146)
> COVID-19 related deaths as of Aug. 17: 66
> Population: 151,366
> Avg. new daily cases in California in 7 days ending Aug. 17: 21 per 100,000 (10th most)
[recirclink id=729976]
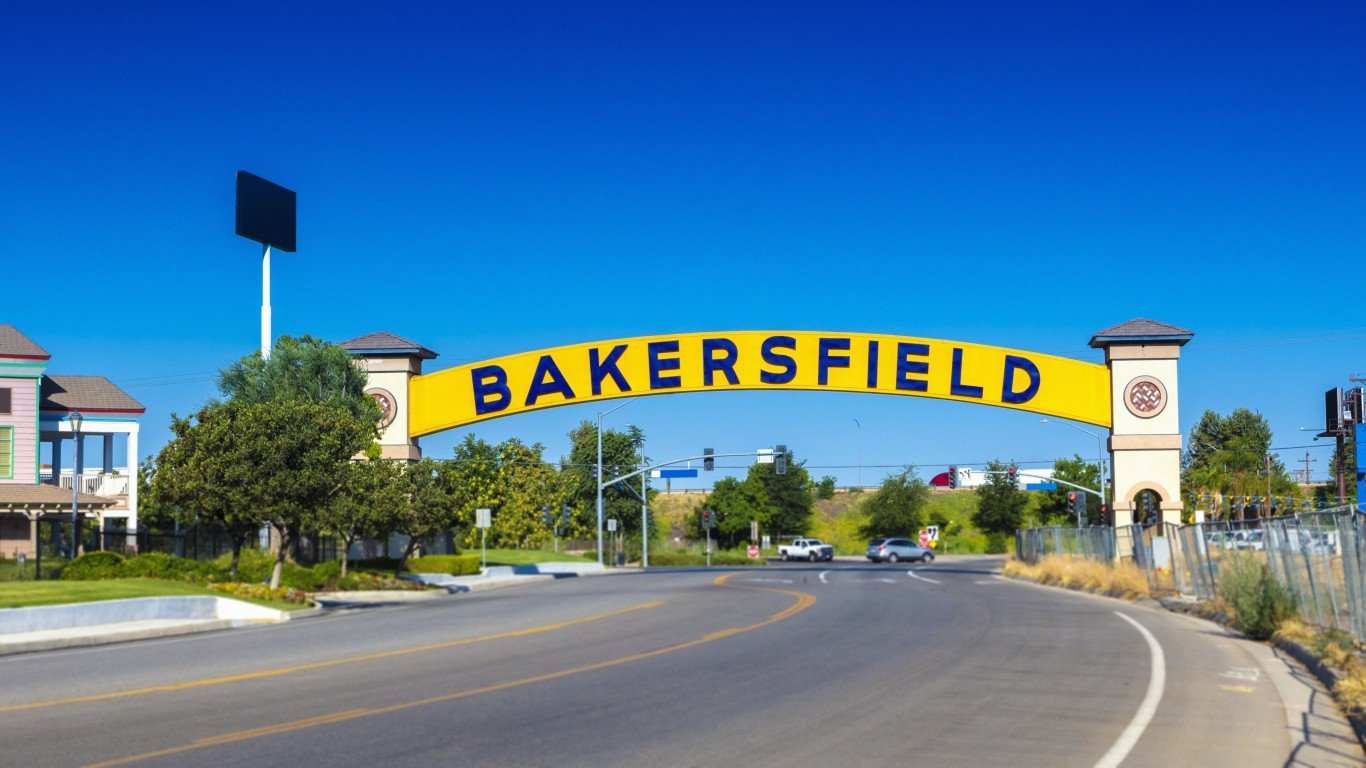
9. Bakersfield, CA
> Change in daily avg. new COVID-19 cases week over week: +17.7 per 100,000 people
> Avg. new daily cases in 7 days ending Aug. 17: 56.8 per 100,000 people
> Avg. new daily cases in 7 days ending Aug. 10: 39.1 per 100,000 people
> Cumulative confirmed COVID-19 cases as of Aug. 17: 3,003 per 100,000 people (total: 26,520)
> COVID-19 related deaths as of Aug. 17: 204
> Population: 896,764
> Avg. new daily cases in California in 7 days ending Aug. 17: 21 per 100,000 (10th most)

8. Yuba City, CA
> Change in daily avg. new COVID-19 cases week over week: +18.2 per 100,000 people
> Avg. new daily cases in 7 days ending Aug. 17: 31.2 per 100,000 people
> Avg. new daily cases in 7 days ending Aug. 10: 13.0 per 100,000 people
> Cumulative confirmed COVID-19 cases as of Aug. 17: 1,003 per 100,000 people (total: 1,718)
> COVID-19 related deaths as of Aug. 17: 11
> Population: 174,848
> Avg. new daily cases in California in 7 days ending Aug. 17: 21 per 100,000 (10th most)
[in-text-ad-2]

7. Visalia, CA
> Change in daily avg. new COVID-19 cases week over week: +18.3 per 100,000 people
> Avg. new daily cases in 7 days ending Aug. 17: 49.0 per 100,000 people
> Avg. new daily cases in 7 days ending Aug. 10: 30.7 per 100,000 people
> Cumulative confirmed COVID-19 cases as of Aug. 17: 2,679 per 100,000 people (total: 12,334)
> COVID-19 related deaths as of Aug. 17: 205
> Population: 465,861
> Avg. new daily cases in California in 7 days ending Aug. 17: 21 per 100,000 (10th most)
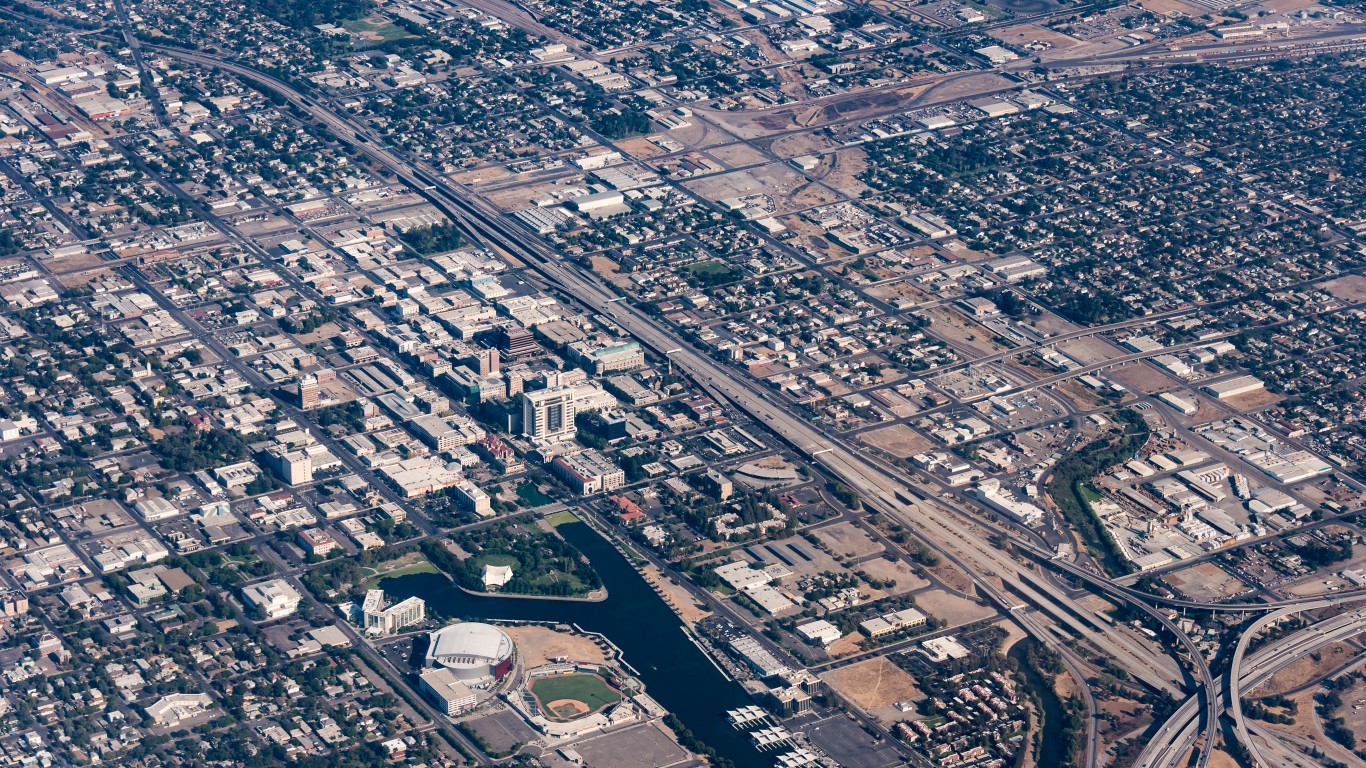
6. Stockton, CA
> Change in daily avg. new COVID-19 cases week over week: +23.5 per 100,000 people
> Avg. new daily cases in 7 days ending Aug. 17: 41.9 per 100,000 people
> Avg. new daily cases in 7 days ending Aug. 10: 18.4 per 100,000 people
> Cumulative confirmed COVID-19 cases as of Aug. 17: 2,088 per 100,000 people (total: 15,288)
> COVID-19 related deaths as of Aug. 17: 261
> Population: 752,660
> Avg. new daily cases in California in 7 days ending Aug. 17: 21 per 100,000 (10th most)
[in-text-ad]

5. Corpus Christi, TX
> Change in daily avg. new COVID-19 cases week over week: +23.6 per 100,000 people
> Avg. new daily cases in 7 days ending Aug. 17: 82.6 per 100,000 people
> Avg. new daily cases in 7 days ending Aug. 10: 59.1 per 100,000 people
> Cumulative confirmed COVID-19 cases as of Aug. 17: 3,464 per 100,000 people (total: 14,811)
> COVID-19 related deaths as of Aug. 17: 225
> Population: 452,927
> Avg. new daily cases in Texas in 7 days ending Aug. 17: 24 per 100,000 (7th most)
[recirclink id=729735]

4. El Centro, CA
> Change in daily avg. new COVID-19 cases week over week: +27.2 per 100,000 people
> Avg. new daily cases in 7 days ending Aug. 17: 45.5 per 100,000 people
> Avg. new daily cases in 7 days ending Aug. 10: 18.3 per 100,000 people
> Cumulative confirmed COVID-19 cases as of Aug. 17: 4,929 per 100,000 people (total: 8,883)
> COVID-19 related deaths as of Aug. 17: 257
> Population: 181,827
> Avg. new daily cases in California in 7 days ending Aug. 17: 21 per 100,000 (10th most)
3. Madera, CA
> Change in daily avg. new COVID-19 cases week over week: +28.2 per 100,000 people
> Avg. new daily cases in 7 days ending Aug. 17: 49.3 per 100,000 people
> Avg. new daily cases in 7 days ending Aug. 10: 21.0 per 100,000 people
> Cumulative confirmed COVID-19 cases as of Aug. 17: 1,944 per 100,000 people (total: 3,013)
> COVID-19 related deaths as of Aug. 17: 47
> Population: 157,672
> Avg. new daily cases in California in 7 days ending Aug. 17: 21 per 100,000 (10th most)
[in-text-ad-2]
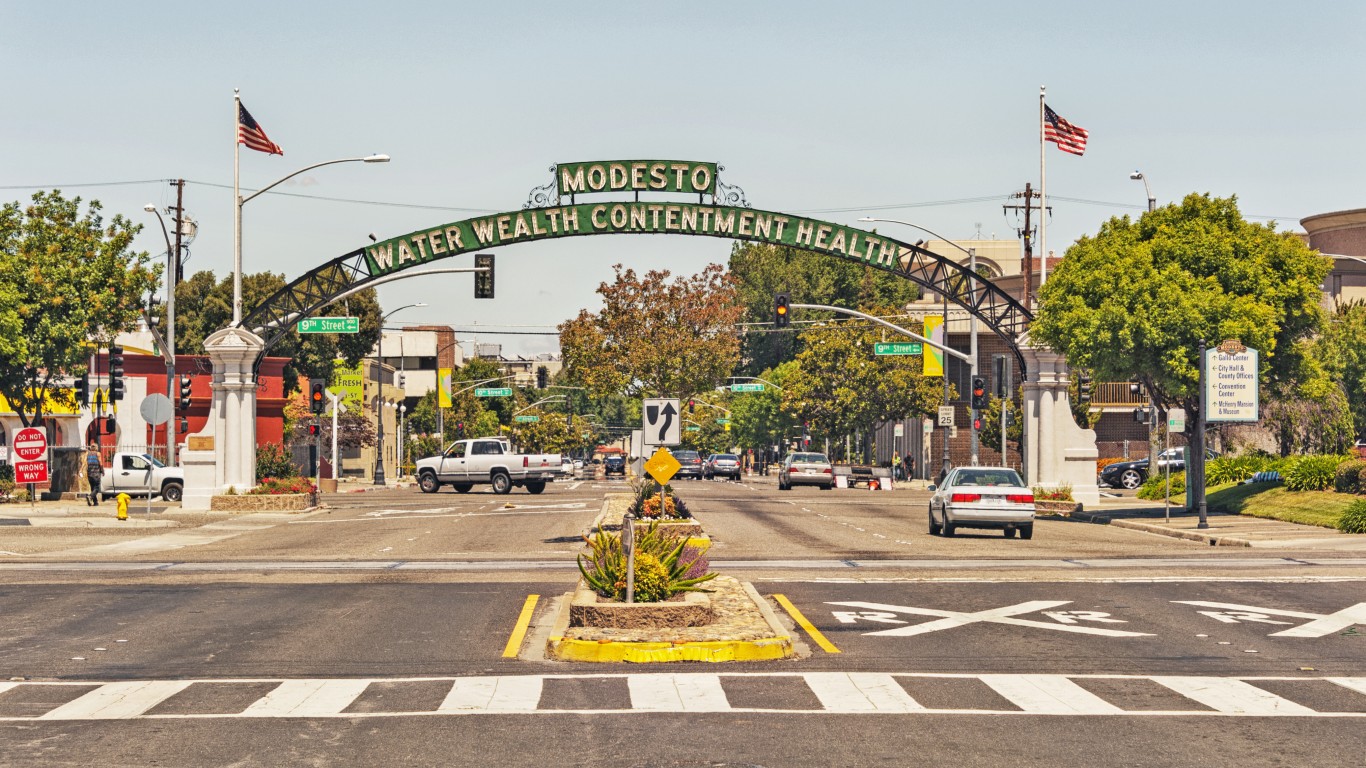
2. Modesto, CA
> Change in daily avg. new COVID-19 cases week over week: +41.2 per 100,000 people
> Avg. new daily cases in 7 days ending Aug. 17: 61.7 per 100,000 people
> Avg. new daily cases in 7 days ending Aug. 10: 20.4 per 100,000 people
> Cumulative confirmed COVID-19 cases as of Aug. 17: 2,349 per 100,000 people (total: 12,668)
> COVID-19 related deaths as of Aug. 17: 198
> Population: 549,815
> Avg. new daily cases in California in 7 days ending Aug. 17: 21 per 100,000 (10th most)

1. Merced, CA
> Change in daily avg. new COVID-19 cases week over week: +57.7 per 100,000 people
> Avg. new daily cases in 7 days ending Aug. 17: 89.6 per 100,000 people
> Avg. new daily cases in 7 days ending Aug. 10: 31.9 per 100,000 people
> Cumulative confirmed COVID-19 cases as of Aug. 17: 2,506 per 100,000 people (total: 6,744)
> COVID-19 related deaths as of Aug. 17: 89
> Population: 274,765
> Avg. new daily cases in California in 7 days ending Aug. 17: 21 per 100,000 (10th most)
Contact [email protected] for any questions or corrections.