Key Points
- Reported incidents of motor vehicle theft have surged by over 14% in the last two years.
- With new car prices near all-time highs, these crimes can be especially costly for victims.
- In the vast majority of states, there is at least one city that stands out for having an especially high rate of auto theft.
- Also: 2 Dividend Legends To Hold Forever
Incidents of motor vehicle theft have been steadily rising in the U.S. in recent years. According to the National Insurance Crime Bureau, an anti-crime and insurance fraud nonprofit organization, over 1 million vehicles were reported stolen in 2022 – up 7.5% from the previous year and nearly 14% from 2020.
While exact explanations for the nationwide uptick in car theft are unclear, the motives behind vehicle theft in general are no mystery. While some share of car thefts are committed by thrill seekers out for no more than a joy ride, many are done for some kind of financial gain — and with the average transaction price of a new vehicle topping $48,600 in October 2024, according to Kelley Blue Book, it is easy to understand why. (These are the cars that dealers overcharge for the most.)
Stolen vehicles are often delivered to so-called chop shops, where they are stripped and resold for parts. They may also be shipped to overseas markets where they can be resold at a higher price. These particular methods of converting stolen cars into cash can make it especially difficult for law enforcement to identify the perpetrators and bring them to justice. According to the FBI, only about 8% of all motor-vehicle thefts in the U.S. were solved in 2023.
While motorists nationwide now face a greater risk of vehicle theft than they have in years, in some major U.S. cities, car owners are far more likely to be victims of car theft than in others.
Using 2022 data from the NICB, 24/7 Wall St. identified the city in each state with the highest motor vehicle theft rate. Within each state, we identified the metropolitan area with the highest number of reported car thefts for every 100,000 people, as calculated by NICB. It is important to note that four states – Delaware, New Hampshire, Rhode Island, and Vermont – have only one metro area. As a result, the metro area listed in each of those states ranks as the worst by default only. Supplemental data on metro area population totals are from the U.S. Census Bureau’s 2023 American Community Survey.
Rates of motor vehicle theft range considerably between U.S. cities — and a given city’s ranking on this list does not necessarily mean it has a high auto theft rate relative to the U.S. as a whole. Of the 50 metro areas on this list, 15 have a lower motor vehicle theft rate than the comparable national rate of 300.6 incidents for every 100,000 people. Of the remaining 35 metro areas on this list, six have a car theft rate that is more than double the national rate. (Here is a look at the 10 most stolen vehicles in the United States.)
Why It Matters
Motor vehicle theft is on the rise in the United States — and according to the National Insurance Crime Bureau, approximately two vehicles were stolen every minute in the U.S. in 2022. Fewer than one-in-every 10 cases of auto theft are solved by law enforcement, and with new car prices hovering near all-time highs, these crimes are especially costly. While vehicle theft rates are rising nationwide, crime of any kind is a local phenomenon, and in every state, there is at least one city that stands out for having an especially high rate of auto theft.
Alabama: Birmingham-Hoover
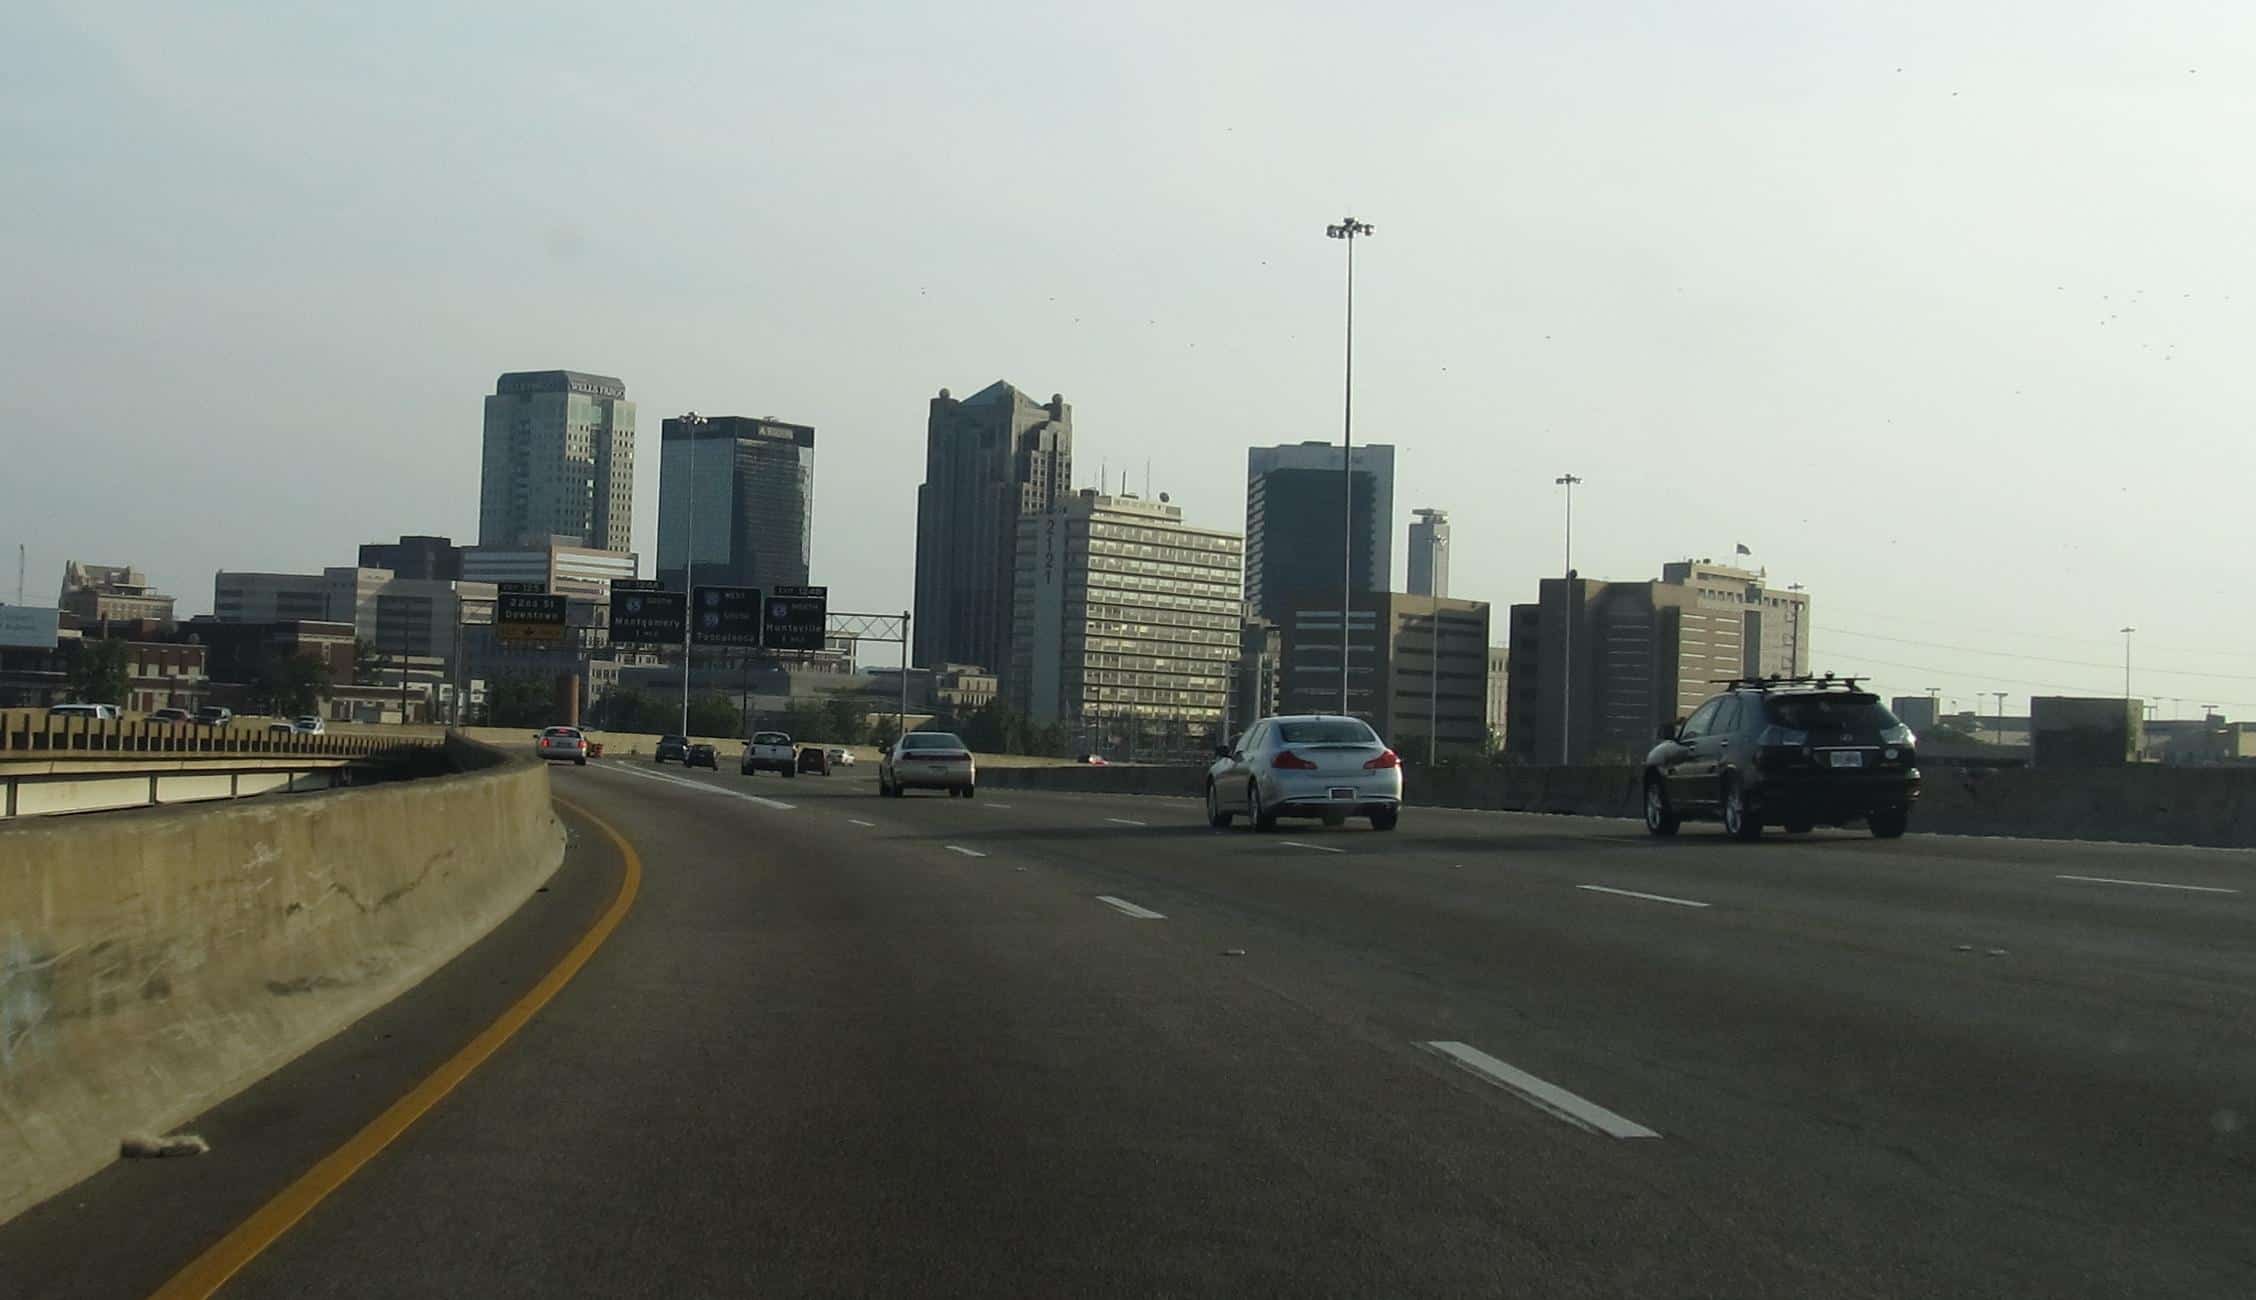
- Motor-vehicle thefts in metro area, 2022: 308.4 per 100,000 people (3,444 total)
- Motor-vehicle thefts in state, 2022: 209.2 per 100,000 people (10,616 total)
- National ranking of motor vehicle theft rate in metro area: Num. 94 of 384 U.S. metro areas
- Metro area population in 2023: 1,184,290
- Metro areas considered in the state: 12
Alaska: Fairbanks

- Motor-vehicle thefts in metro area, 2022: 357.6 per 100,000 people (341 total)
- Motor-vehicle thefts in state, 2022: 245.6 per 100,000 people (1,802 total)
- National ranking of motor vehicle theft rate in metro area: Num. 70 of 384 U.S. metro areas
- Metro area population in 2023: 94,840
- Metro areas considered in the state: 2
Arizona: Tucson

- Motor-vehicle thefts in metro area, 2022: 345.8 per 100,000 people (3,657 total)
- Motor-vehicle thefts in state, 2022: 294.8 per 100,000 people (21,694 total)
- National ranking of motor vehicle theft rate in metro area: Num. 77 of 384 U.S. metro areas
- Metro area population in 2023: 1,063,162
- Metro areas considered in the state: 7
Arkansas: Pine Bluff
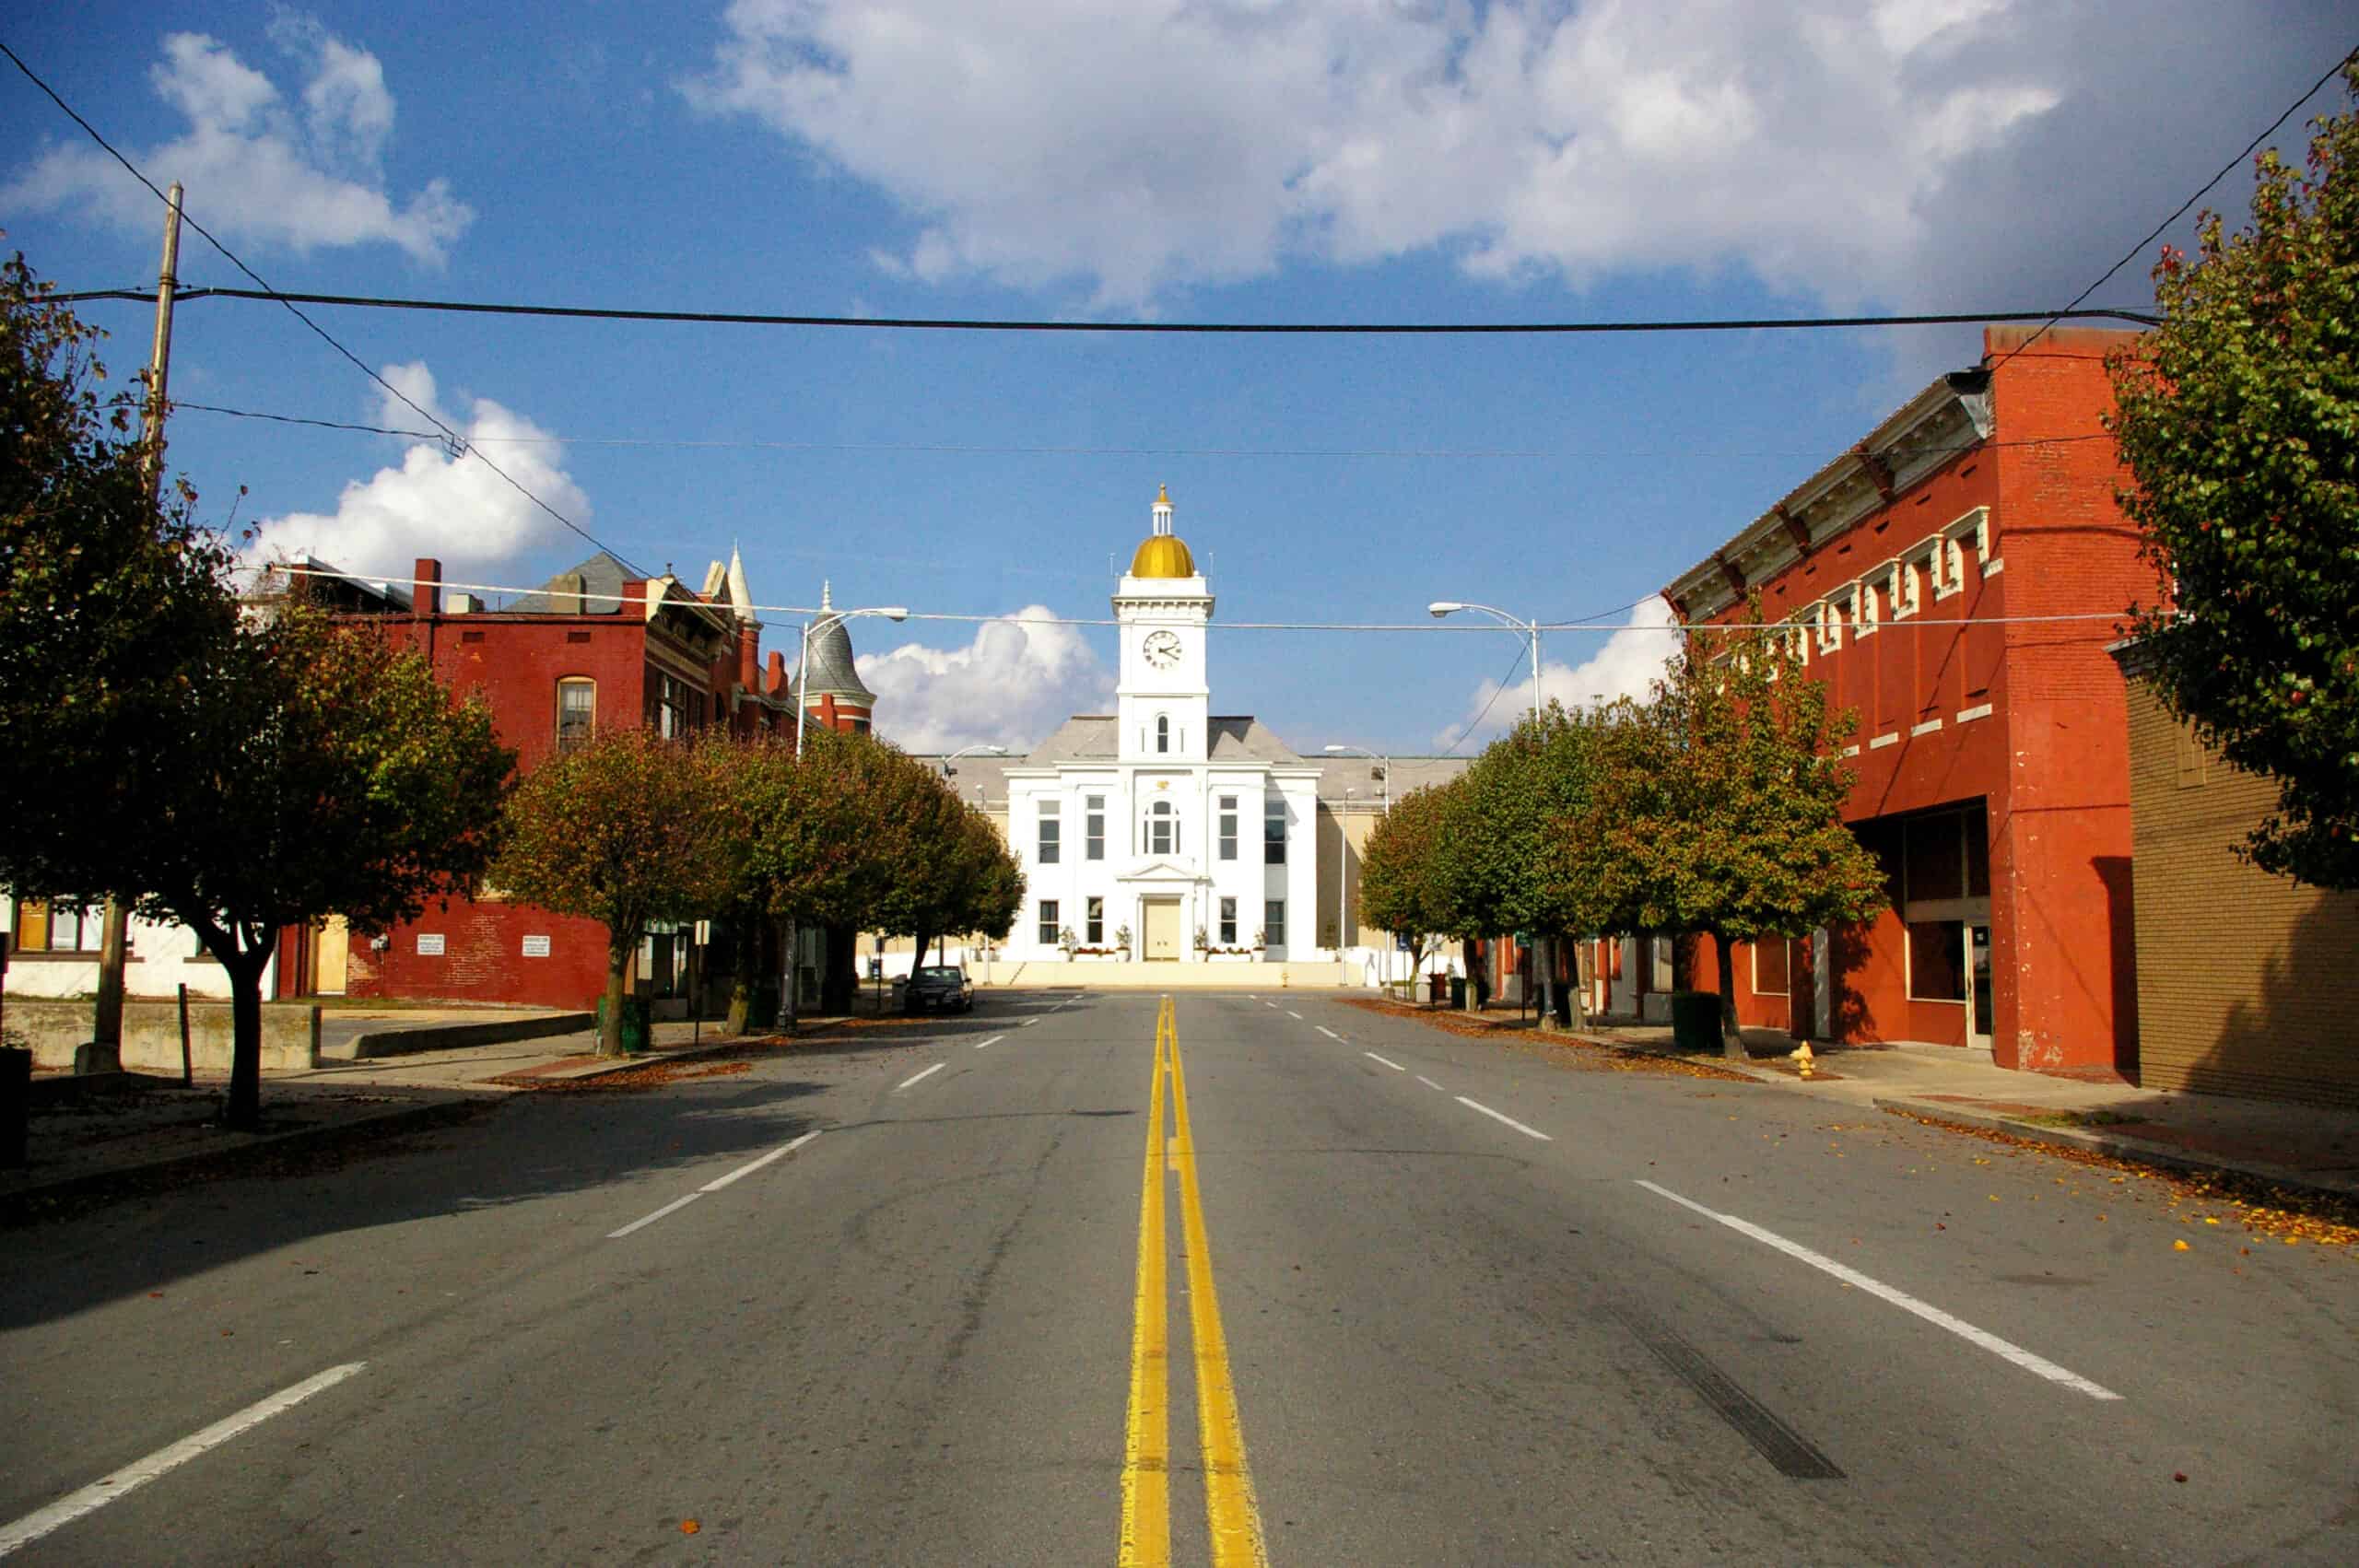
- Motor-vehicle thefts in metro area, 2022: 470.3 per 100,000 people (398 total)
- Motor-vehicle thefts in state, 2022: 269.8 per 100,000 people (8,216 total)
- National ranking of motor vehicle theft rate in metro area: Num. 31 of 384 U.S. metro areas
- Metro area population in 2023: 70,843
- Metro areas considered in the state: 6
California: Bakersfield
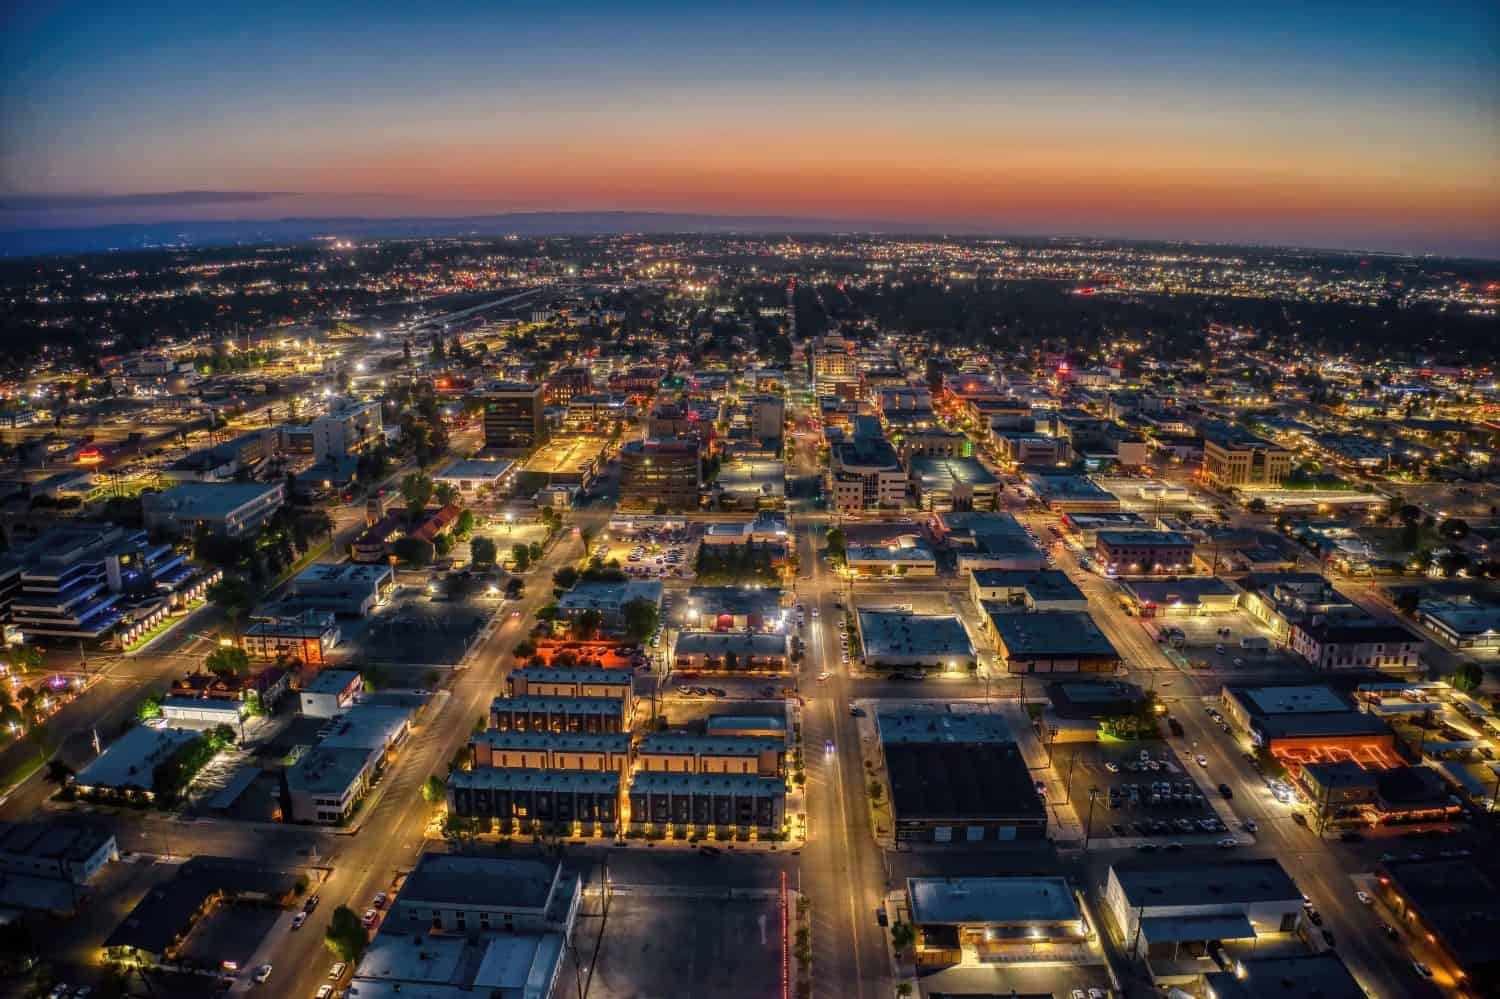
- Motor-vehicle thefts in metro area, 2022: 1,072.4 per 100,000 people (9,824 total)
- Motor-vehicle thefts in state, 2022: 520.2 per 100,000 people (203,018 total)
- National ranking of motor vehicle theft rate in metro area: Num. 2 of 384 U.S. metro areas
- Metro area population in 2023: 913,820
- Metro areas considered in the state: 26
Colorado: Pueblo
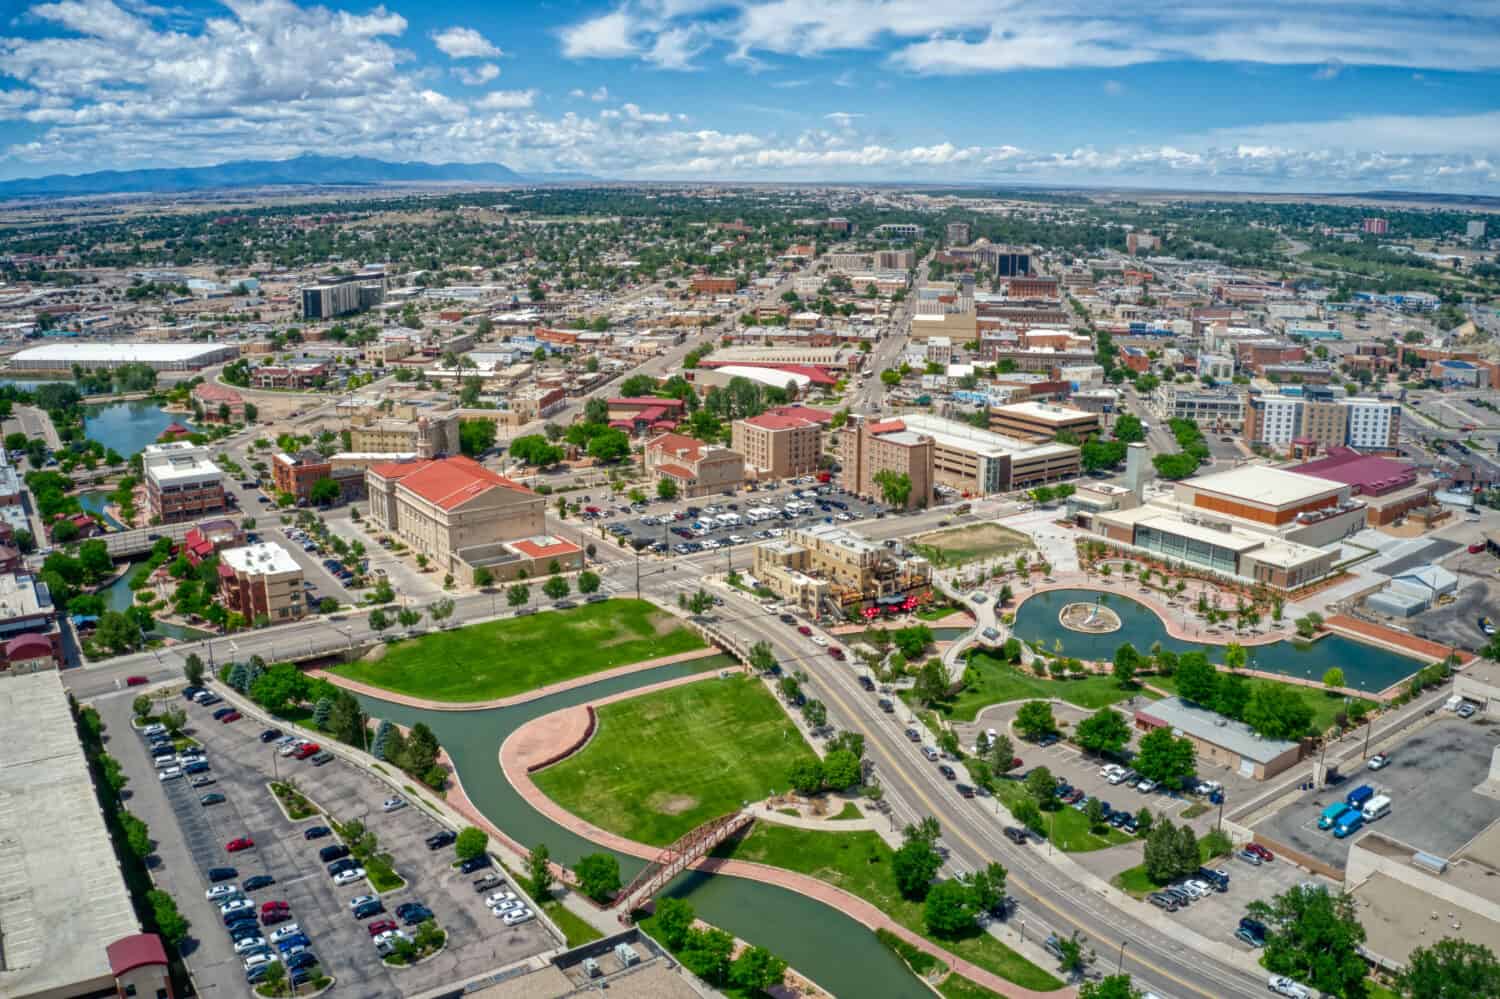
- Motor-vehicle thefts in metro area, 2022: 1,086.4 per 100,000 people (1,842 total)
- Motor-vehicle thefts in state, 2022: 731.3 per 100,000 people (42,706 total)
- National ranking of motor vehicle theft rate in metro area: Num. 1 of 384 U.S. metro areas
- Metro area population in 2023: 169,422
- Metro areas considered in the state: 7
Connecticut: New Haven-Milford

- Motor-vehicle thefts in metro area, 2022: 315.1 per 100,000 people (2,740 total)
- Motor-vehicle thefts in state, 2022: 195.5 per 100,000 people (7,091 total)
- National ranking of motor vehicle theft rate in metro area: Num. 88 of 384 U.S. metro areas
- Metro area population in 2023: 568,158
- Metro areas considered in the state: 4
Delaware: Dover

- Motor-vehicle thefts in metro area, 2022: 214.5 per 100,000 people (401 total)
- Motor-vehicle thefts in state, 2022: 184.5 per 100,000 people (1,879 total)
- National ranking of motor vehicle theft rate in metro area: Num. 180 of 384 U.S. metro areas
- Metro area population in 2023: 189,789
- Metro areas considered in the state: 1
Florida: Miami-Fort Lauderdale-Pompano Beach

- Motor-vehicle thefts in metro area, 2022: 303.2 per 100,000 people (18,617 total)
- Motor-vehicle thefts in state, 2022: 206.9 per 100,000 people (46,020 total)
- National ranking of motor vehicle theft rate in metro area: Num. 99 of 384 U.S. metro areas
- Metro area population in 2023: 6,183,199
- Metro areas considered in the state: 22
Georgia: Macon-Bibb County

- Motor-vehicle thefts in metro area, 2022: 455.7 per 100,000 people (1,066 total)
- Motor-vehicle thefts in state, 2022: 243.9 per 100,000 people (26,612 total)
- National ranking of motor vehicle theft rate in metro area: Num. 35 of 384 U.S. metro areas
- Metro area population in 2023: 233,020
- Metro areas considered in the state: 14
Hawaii: Honolulu

- Motor-vehicle thefts in metro area, 2022: 265.0 per 100,000 people (2,638 total)
- Motor-vehicle thefts in state, 2022: 183.2 per 100,000 people (2,639 total)
- National ranking of motor vehicle theft rate in metro area: Num. 129 of 384 U.S. metro areas
- Metro area population in 2023: 989,408
- Metro areas considered in the state: 2
Idaho: Pocatello

- Motor-vehicle thefts in metro area, 2022: 133.2 per 100,000 people (130 total)
- Motor-vehicle thefts in state, 2022: 91.1 per 100,000 people (1,766 total)
- National ranking of motor vehicle theft rate in metro area: Num. 280 of 384 U.S. metro areas
- Metro area population in 2023: 90,400
- Metro areas considered in the state: 6
Illinois: Chicago-Naperville-Elgin

- Motor-vehicle thefts in metro area, 2022: 350.5 per 100,000 people (33,089 total)
- Motor-vehicle thefts in state, 2022: 307.6 per 100,000 people (38,699 total)
- National ranking of motor vehicle theft rate in metro area: Num. 73 of 384 U.S. metro areas
- Metro area population in 2023: 9,262,559
- Metro areas considered in the state: 10
Indiana: Indianapolis-Carmel-Anderson

- Motor-vehicle thefts in metro area, 2022: 339.6 per 100,000 people (7,273 total)
- Motor-vehicle thefts in state, 2022: 226.0 per 100,000 people (15,440 total)
- National ranking of motor vehicle theft rate in metro area: Num. 81 of 384 U.S. metro areas
- Metro area population in 2023: 2,139,689
- Metro areas considered in the state: 12
Iowa: Davenport-Moline-Rock Island

- Motor-vehicle thefts in metro area, 2022: 351.9 per 100,000 people (1,335 total)
- Motor-vehicle thefts in state, 2022: 168.1 per 100,000 people (5,379 total)
- National ranking of motor vehicle theft rate in metro area: Num. 72 of 384 U.S. metro areas
- Metro area population in 2023: 379,869
- Metro areas considered in the state: 8
Kansas: Wichita

- Motor-vehicle thefts in metro area, 2022: 451.2 per 100,000 people (2,933 total)
- Motor-vehicle thefts in state, 2022: 292.4 per 100,000 people (8,588 total)
- National ranking of motor vehicle theft rate in metro area: Num. 37 of 384 U.S. metro areas
- Metro area population in 2023: 652,939
- Metro areas considered in the state: 4
Kentucky: Louisville/Jefferson County

- Motor-vehicle thefts in metro area, 2022: 438.8 per 100,000 people (5,637 total)
- Motor-vehicle thefts in state, 2022: 226.4 per 100,000 people (10,217 total)
- National ranking of motor vehicle theft rate in metro area: Num. 40 of 384 U.S. metro areas
- Metro area population in 2023: 1,364,742
- Metro areas considered in the state: 5
Louisiana: New Orleans-Metairie

- Motor-vehicle thefts in metro area, 2022: 464.1 per 100,000 people (5,783 total)
- Motor-vehicle thefts in state, 2022: 297.1 per 100,000 people (13,638 total)
- National ranking of motor vehicle theft rate in metro area: Num. 33 of 384 U.S. metro areas
- Metro area population in 2023: 962,165
- Metro areas considered in the state: 9
Maine: Lewiston-Auburn
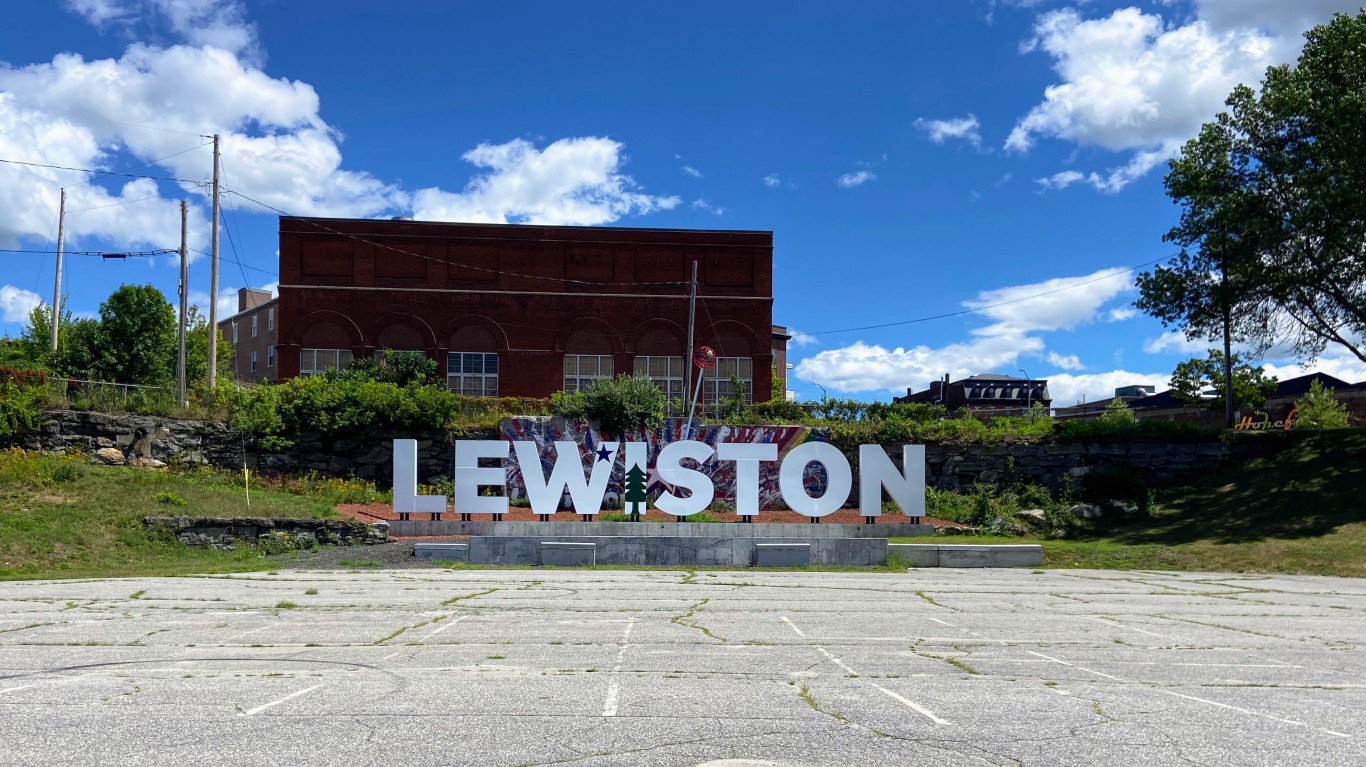
- Motor-vehicle thefts in metro area, 2022: 83.2 per 100,000 people (94 total)
- Motor-vehicle thefts in state, 2022: 68.1 per 100,000 people (944 total)
- National ranking of motor vehicle theft rate in metro area: Num. 339 of 384 U.S. metro areas
- Metro area population in 2023: 113,765
- Metro areas considered in the state: 3
Maryland: Baltimore-Columbia-Towson

- Motor-vehicle thefts in metro area, 2022: 276.0 per 100,000 people (7,825 total)
- Motor-vehicle thefts in state, 2022: 260.9 per 100,000 people (16,086 total)
- National ranking of motor vehicle theft rate in metro area: Num. 119 of 384 U.S. metro areas
- Metro area population in 2023: 2,834,316
- Metro areas considered in the state: 5
Massachusetts: Springfield

- Motor-vehicle thefts in metro area, 2022: 155.8 per 100,000 people (1,082 total)
- Motor-vehicle thefts in state, 2022: 101.5 per 100,000 people (7,084 total)
- National ranking of motor vehicle theft rate in metro area: Num. 249 of 384 U.S. metro areas
- Metro area population in 2023: 460,291
- Metro areas considered in the state: 5
Michigan: Detroit-Warren-Dearborn

- Motor-vehicle thefts in metro area, 2022: 391.8 per 100,000 people (17,026 total)
- Motor-vehicle thefts in state, 2022: 256.7 per 100,000 people (25,753 total)
- National ranking of motor vehicle theft rate in metro area: Num. 53 of 384 U.S. metro areas
- Metro area population in 2023: 4,342,304
- Metro areas considered in the state: 14
Minnesota: Minneapolis-St. Paul-Bloomington

- Motor-vehicle thefts in metro area, 2022: 417.7 per 100,000 people (15,429 total)
- Motor-vehicle thefts in state, 2022: 311.9 per 100,000 people (17,832 total)
- National ranking of motor vehicle theft rate in metro area: Num. 46 of 384 U.S. metro areas
- Metro area population in 2023: 3,712,020
- Metro areas considered in the state: 5
Mississippi: Jackson

- Motor-vehicle thefts in metro area, 2022: 302.8 per 100,000 people (1,766 total)
- Motor-vehicle thefts in state, 2022: 209.2 per 100,000 people (6,150 total)
- National ranking of motor vehicle theft rate in metro area: Num. 100 of 384 U.S. metro areas
- Metro area population in 2023: 609,582
- Metro areas considered in the state: 3
Missouri: Kansas City

- Motor-vehicle thefts in metro area, 2022: 572.7 per 100,000 people (12,653 total)
- Motor-vehicle thefts in state, 2022: 482.6 per 100,000 people (29,815 total)
- National ranking of motor vehicle theft rate in metro area: Num. 10 of 384 U.S. metro areas
- Metro area population in 2023: 2,219,865
- Metro areas considered in the state: 8
Montana: Billings
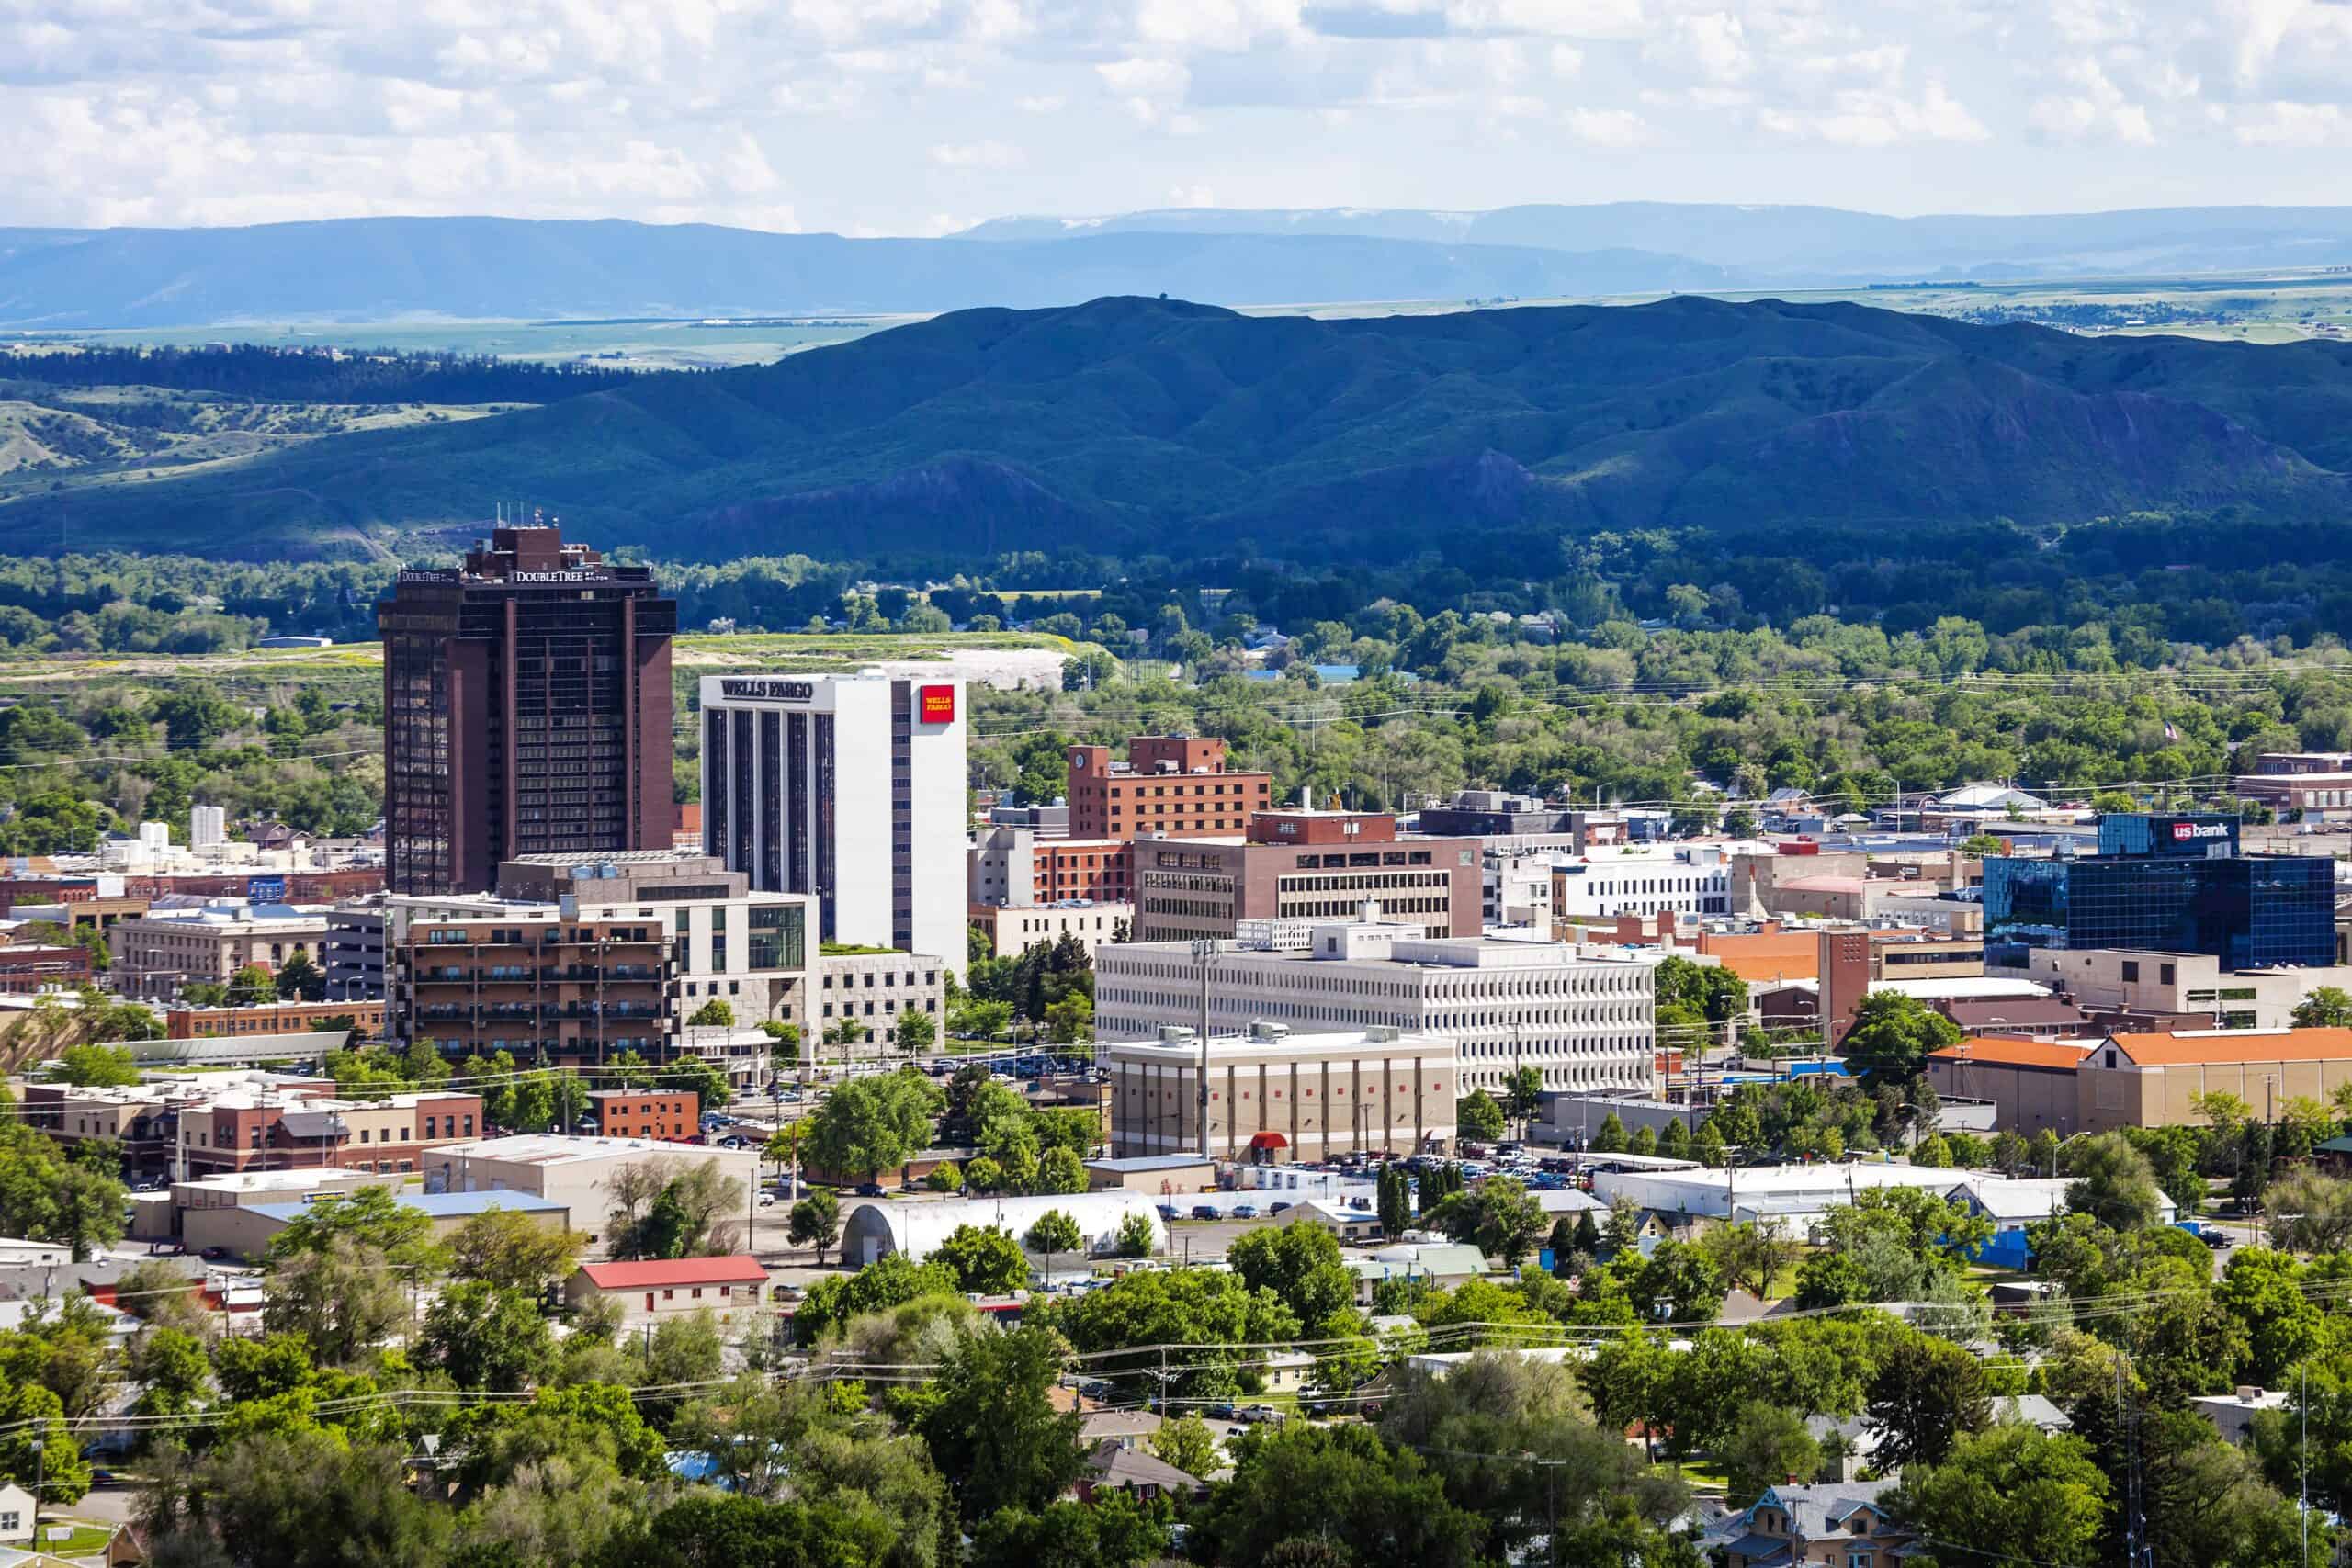
- Motor-vehicle thefts in metro area, 2022: 447.9 per 100,000 people (852 total)
- Motor-vehicle thefts in state, 2022: 223.7 per 100,000 people (2,512 total)
- National ranking of motor vehicle theft rate in metro area: Num. 38 of 384 U.S. metro areas
- Metro area population in 2023: 191,435
- Metro areas considered in the state: 3
Nebraska: Omaha-Council Bluffs

- Motor-vehicle thefts in metro area, 2022: 388.6 per 100,000 people (3,795 total)
- Motor-vehicle thefts in state, 2022: 257.0 per 100,000 people (5,058 total)
- National ranking of motor vehicle theft rate in metro area: Num. 56 of 384 U.S. metro areas
- Metro area population in 2023: 984,548
- Metro areas considered in the state: 3
Nevada: Las Vegas-Henderson-Paradise

- Motor-vehicle thefts in metro area, 2022: 561.8 per 100,000 people (13,051 total)
- Motor-vehicle thefts in state, 2022: 480.8 per 100,000 people (15,279 total)
- National ranking of motor vehicle theft rate in metro area: Num. 12 of 384 U.S. metro areas
- Metro area population in 2023: 2,336,573
- Metro areas considered in the state: 3
New Hampshire: Manchester-Nashua

- Motor-vehicle thefts in metro area, 2022: 72.7 per 100,000 people (310 total)
- Motor-vehicle thefts in state, 2022: 53.8 per 100,000 people (750 total)
- National ranking of motor vehicle theft rate in metro area: Num. 355 of 384 U.S. metro areas
- Metro area population in 2023: 427,354
- Metro areas considered in the state: 1
New Jersey: Trenton-Princeton

- Motor-vehicle thefts in metro area, 2022: 207.3 per 100,000 people (789 total)
- Motor-vehicle thefts in state, 2022: 174.5 per 100,000 people (16,165 total)
- National ranking of motor vehicle theft rate in metro area: Num. 187 of 384 U.S. metro areas
- Metro area population in 2023: 381,671
- Metro areas considered in the state: 4
New Mexico: Albuquerque

- Motor-vehicle thefts in metro area, 2022: 795.2 per 100,000 people (7,312 total)
- Motor-vehicle thefts in state, 2022: 540.6 per 100,000 people (11,424 total)
- National ranking of motor vehicle theft rate in metro area: Num. 6 of 384 U.S. metro areas
- Metro area population in 2023: 923,518
- Metro areas considered in the state: 4
New York: Buffalo-Cheektowaga

- Motor-vehicle thefts in metro area, 2022: 244.6 per 100,000 people (2,840 total)
- Motor-vehicle thefts in state, 2022: 143.9 per 100,000 people (28,323 total)
- National ranking of motor vehicle theft rate in metro area: Num. 147 of 384 U.S. metro areas
- Metro area population in 2023: 1,155,604
- Metro areas considered in the state: 13
North Carolina: Greensboro-High Point
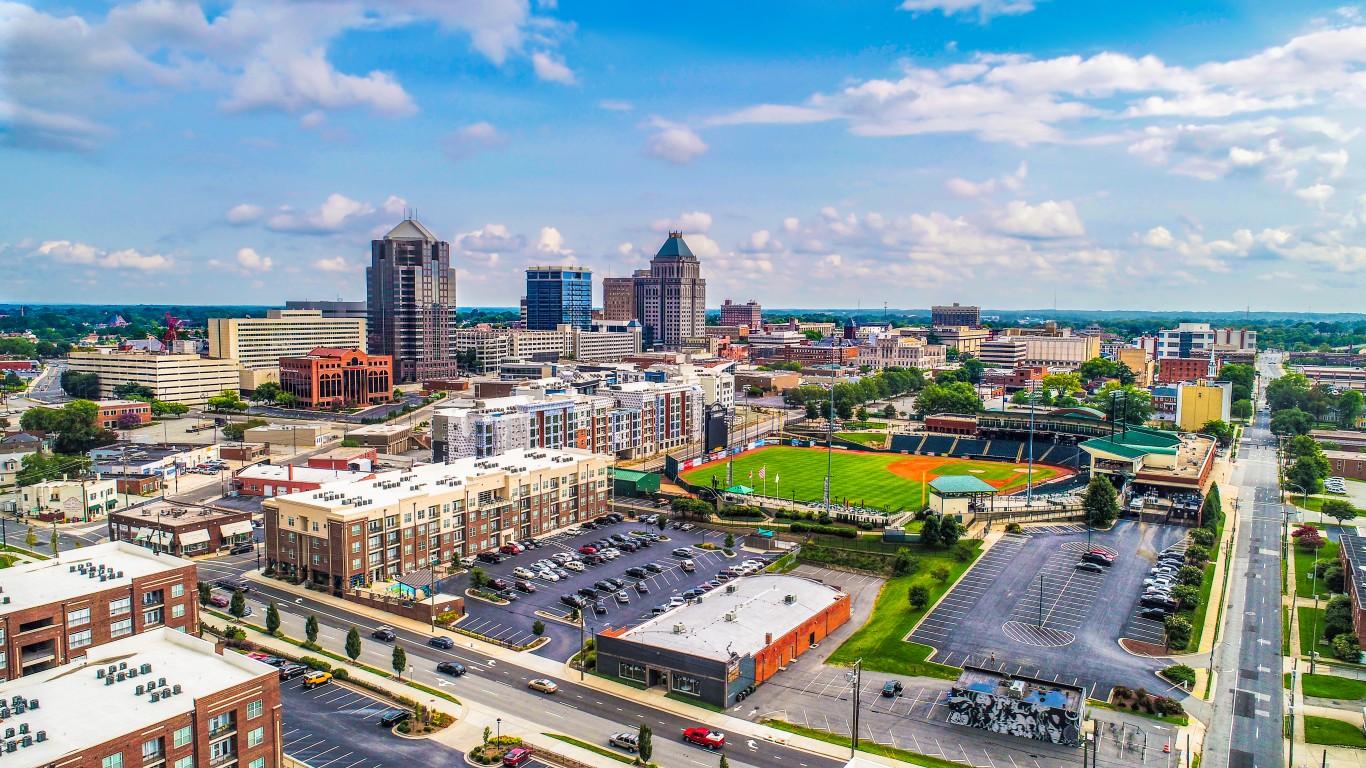
- Motor-vehicle thefts in metro area, 2022: 285.9 per 100,000 people (2,242 total)
- Motor-vehicle thefts in state, 2022: 220.4 per 100,000 people (23,576 total)
- National ranking of motor vehicle theft rate in metro area: Num. 113 of 384 U.S. metro areas
- Metro area population in 2023: 789,842
- Metro areas considered in the state: 15
North Dakota: Fargo

- Motor-vehicle thefts in metro area, 2022: 338.7 per 100,000 people (876 total)
- Motor-vehicle thefts in state, 2022: 224.6 per 100,000 people (1,750 total)
- National ranking of motor vehicle theft rate in metro area: Num. 82 of 384 U.S. metro areas
- Metro area population in 2023: 262,620
- Metro areas considered in the state: 3
Ohio: Columbus

- Motor-vehicle thefts in metro area, 2022: 387.9 per 100,000 people (8,385 total)
- Motor-vehicle thefts in state, 2022: 258.3 per 100,000 people (30,361 total)
- National ranking of motor vehicle theft rate in metro area: Num. 57 of 384 U.S. metro areas
- Metro area population in 2023: 2,180,271
- Metro areas considered in the state: 11
Oklahoma: Tulsa

- Motor-vehicle thefts in metro area, 2022: 417.2 per 100,000 people (4,314 total)
- Motor-vehicle thefts in state, 2022: 298.7 per 100,000 people (12,007 total)
- National ranking of motor vehicle theft rate in metro area: Num. 47 of 384 U.S. metro areas
- Metro area population in 2023: 1,044,287
- Metro areas considered in the state: 4
Oregon: Portland-Vancouver-Hillsboro

- Motor-vehicle thefts in metro area, 2022: 796.9 per 100,000 people (19,999 total)
- Motor-vehicle thefts in state, 2022: 540.9 per 100,000 people (22,934 total)
- National ranking of motor vehicle theft rate in metro area: Num. 5 of 384 U.S. metro areas
- Metro area population in 2023: 2,509,925
- Metro areas considered in the state: 8
Pennsylvania: Philadelphia-Camden-Wilmington

- Motor-vehicle thefts in metro area, 2022: 312.2 per 100,000 people (19,486 total)
- Motor-vehicle thefts in state, 2022: 172.7 per 100,000 people (22,407 total)
- National ranking of motor vehicle theft rate in metro area: Num. 90 of 384 U.S. metro areas
- Metro area population in 2023: 6,246,160
- Metro areas considered in the state: 18
Rhode Island: Providence-Warwick

- Motor-vehicle thefts in metro area, 2022: 149.8 per 100,000 people (2,508 total)
- Motor-vehicle thefts in state, 2022: 164.2 per 100,000 people (1,796 total)
- National ranking of motor vehicle theft rate in metro area: Num. 258 of 384 U.S. metro areas
- Metro area population in 2023: 1,677,803
- Metro areas considered in the state: 1
South Carolina: Columbia

- Motor-vehicle thefts in metro area, 2022: 370.3 per 100,000 people (3,139 total)
- Motor-vehicle thefts in state, 2022: 290.5 per 100,000 people (15,345 total)
- National ranking of motor vehicle theft rate in metro area: Num. 66 of 384 U.S. metro areas
- Metro area population in 2023: 856,889
- Metro areas considered in the state: 8
South Dakota: Sioux Falls

- Motor-vehicle thefts in metro area, 2022: 403.3 per 100,000 people (1,168 total)
- Motor-vehicle thefts in state, 2022: 248.3 per 100,000 people (2,259 total)
- National ranking of motor vehicle theft rate in metro area: Num. 50 of 384 U.S. metro areas
- Metro area population in 2023: 303,827
- Metro areas considered in the state: 2
Tennessee: Memphis

- Motor-vehicle thefts in metro area, 2022: 845.7 per 100,000 people (11,267 total)
- Motor-vehicle thefts in state, 2022: 337.9 per 100,000 people (23,830 total)
- National ranking of motor vehicle theft rate in metro area: Num. 4 of 384 U.S. metro areas
- Metro area population in 2023: 1,335,549
- Metro areas considered in the state: 10
Texas: San Antonio-New Braunfels

- Motor-vehicle thefts in metro area, 2022: 549.7 per 100,000 people (14,595 total)
- Motor-vehicle thefts in state, 2022: 350.1 per 100,000 people (105,133 total)
- National ranking of motor vehicle theft rate in metro area: Num. 14 of 384 U.S. metro areas
- Metro area population in 2023: 2,703,999
- Metro areas considered in the state: 25
Utah: Salt Lake City

- Motor-vehicle thefts in metro area, 2022: 379.0 per 100,000 people (4,799 total)
- Motor-vehicle thefts in state, 2022: 209.5 per 100,000 people (7,082 total)
- National ranking of motor vehicle theft rate in metro area: Num. 60 of 384 U.S. metro areas
- Metro area population in 2023: 1,267,864
- Metro areas considered in the state: 5
Vermont: Burlington-South Burlington

- Motor-vehicle thefts in metro area, 2022: 268.6 per 100,000 people (611 total)
- Motor-vehicle thefts in state, 2022: 160.6 per 100,000 people (1,039 total)
- National ranking of motor vehicle theft rate in metro area: Num. 125 of 384 U.S. metro areas
- Metro area population in 2023: 227,719
- Metro areas considered in the state: 1
Virginia: Virginia Beach-Norfolk-Newport News

- Motor-vehicle thefts in metro area, 2022: 266.2 per 100,000 people (4,810 total)
- Motor-vehicle thefts in state, 2022: 164.2 per 100,000 people (14,256 total)
- National ranking of motor vehicle theft rate in metro area: Num. 127 of 384 U.S. metro areas
- Metro area population in 2023: 1,781,671
- Metro areas considered in the state: 9
Washington: Seattle-Tacoma-Bellevue

- Motor-vehicle thefts in metro area, 2022: 758.7 per 100,000 people (30,607 total)
- Motor-vehicle thefts in state, 2022: 603.5 per 100,000 people (46,990 total)
- National ranking of motor vehicle theft rate in metro area: Num. 7 of 384 U.S. metro areas
- Metro area population in 2023: 4,044,837
- Metro areas considered in the state: 11
West Virginia: Charleston

- Motor-vehicle thefts in metro area, 2022: 208.8 per 100,000 people (526 total)
- Motor-vehicle thefts in state, 2022: 115.3 per 100,000 people (2,046 total)
- National ranking of motor vehicle theft rate in metro area: Num. 185 of 384 U.S. metro areas
- Metro area population in 2023: 203,259
- Metro areas considered in the state: 7
Wisconsin: Milwaukee-Waukesha

- Motor-vehicle thefts in metro area, 2022: 500.4 per 100,000 people (7,805 total)
- Motor-vehicle thefts in state, 2022: 198.7 per 100,000 people (11,709 total)
- National ranking of motor vehicle theft rate in metro area: Num. 23 of 384 U.S. metro areas
- Metro area population in 2023: 1,560,424
- Metro areas considered in the state: 12
Wyoming: Cheyenne
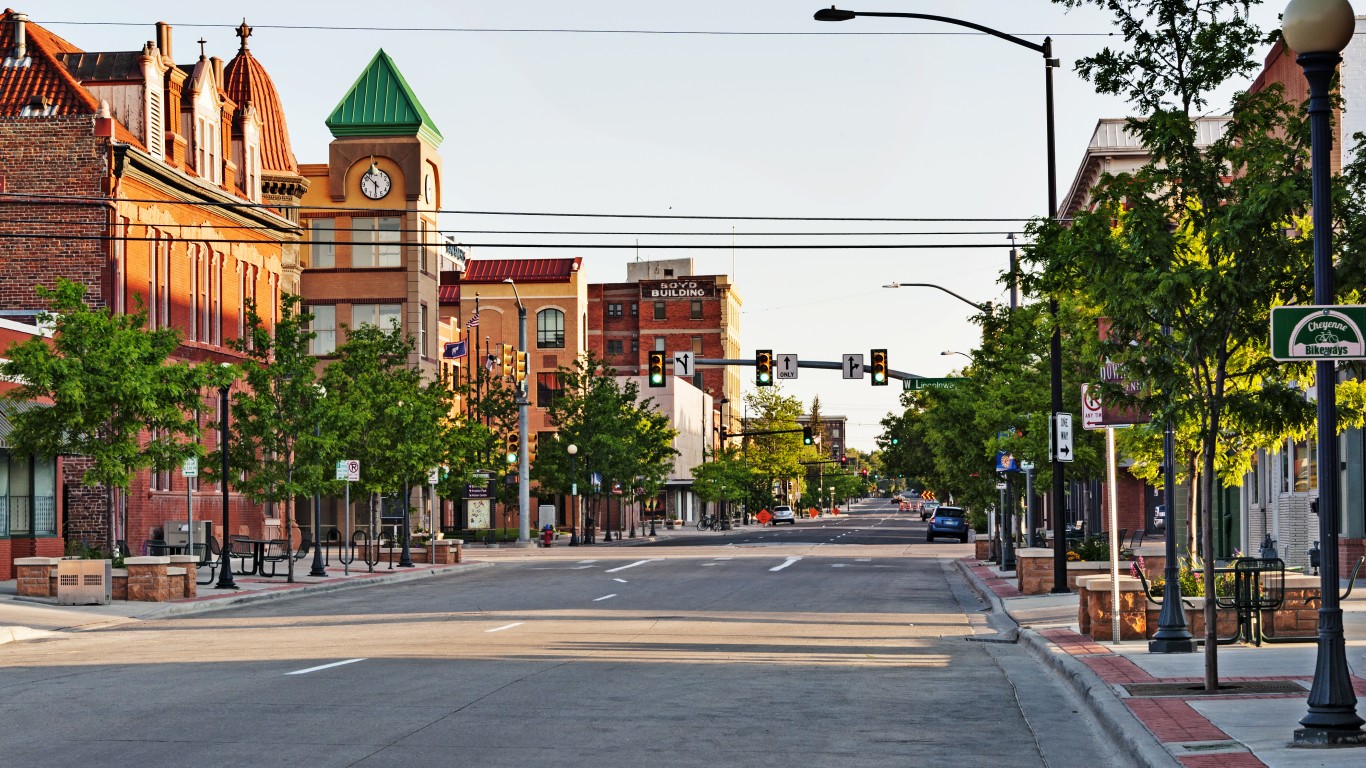
- Motor-vehicle thefts in metro area, 2022: 283.0 per 100,000 people (285 total)
- Motor-vehicle thefts in state, 2022: 132.4 per 100,000 people (770 total)
- National ranking of motor vehicle theft rate in metro area: Num. 115 of 384 U.S. metro areas
- Metro area population in 2023: 100,984
- Metro areas considered in the state: 2
Contact [email protected] for any questions or corrections.