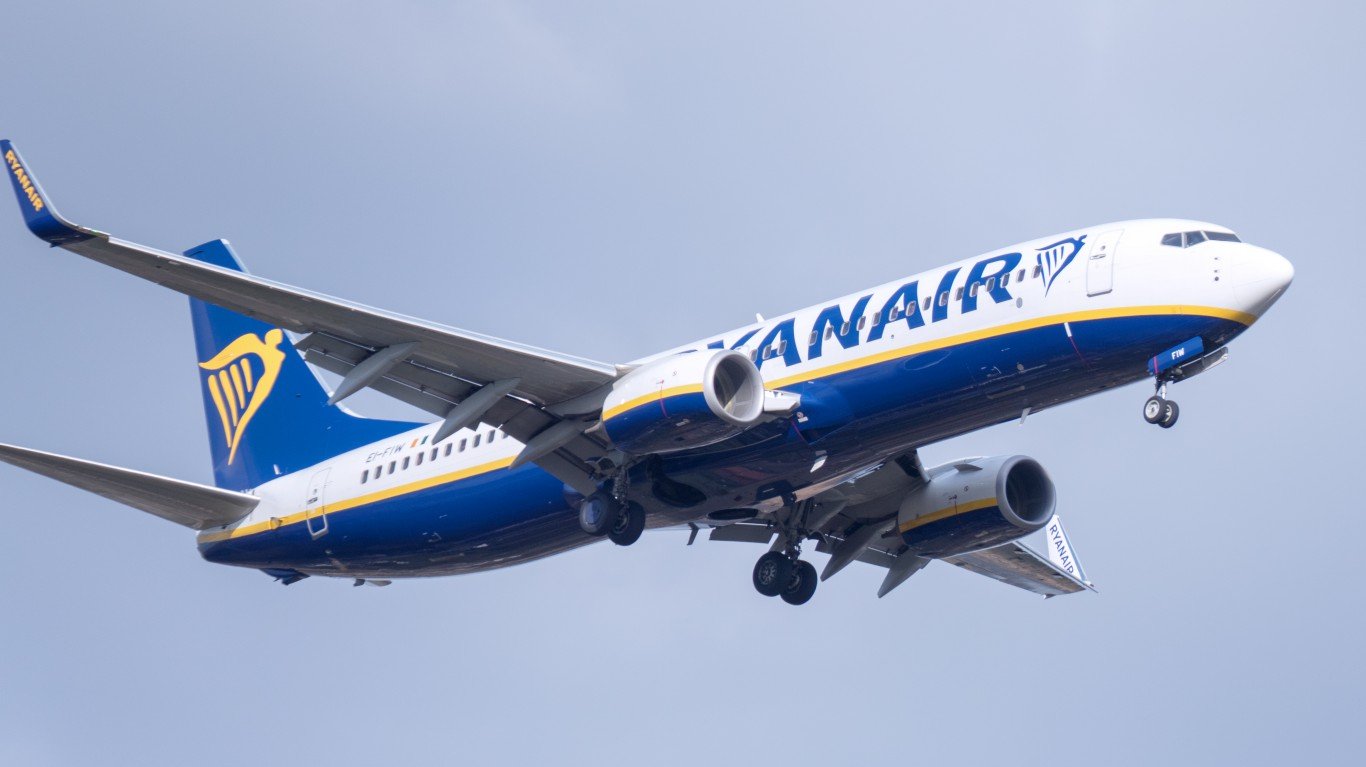
Netflix (NASDAQ:NFLX | NFLX Price Prediction) and Disney (NYSE:DIS) just gave investors a side by side look at two very different streaming playbooks. Netflix posted a Q1 FY26 beat on revenue but a rare EPS miss, while Disney delivered its fiscal Q2 FY26 with a streaming profitability milestone, record parks revenue, and an ESPN reset.
Ad Tier Carries Netflix. Parks and SVOD Carry Disney.
Netflix grew Q1 revenue to $12.25 billion, up 16.2% year over year, with EPS of $1.23 versus a $1.34 estimate. The miss is messy on the surface, but net income included a $2.80 billion termination fee from walking away from the Warner Bros. deal. Co-CEOs Greg Peters and Ted Sarandos leaned hard into the ad tier, which drove over 60% of Q1 sign-ups in ads markets, while advertiser count climbed 70% to more than 4,000 clients. Ad revenue is on track to roughly double to $3 billion in 2026.
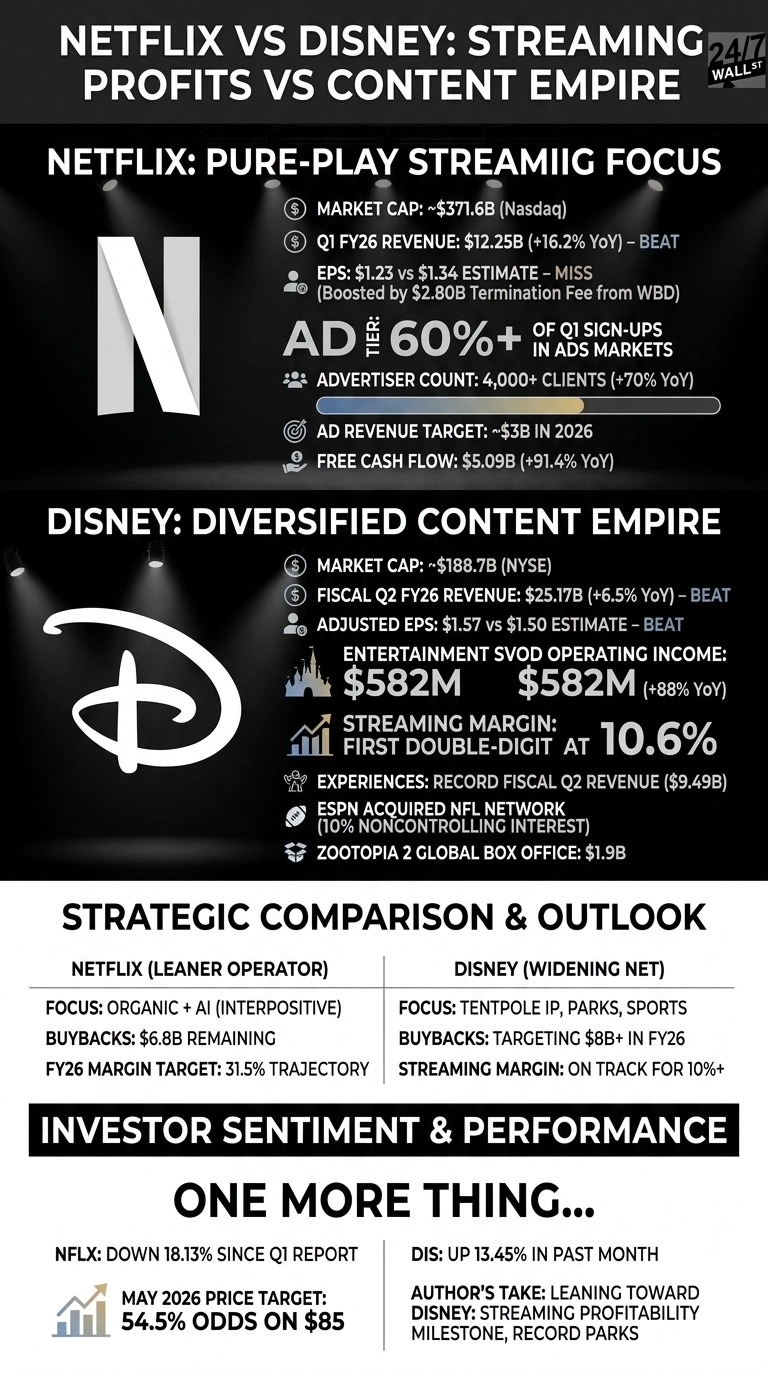
Disney’s quarter looked broader. Revenue rose to $25.17 billion, up 6.5%, with adjusted EPS of $1.57 against a $1.50 consensus. Entertainment SVOD revenue jumped 13% to $5.49 billion, and segment operating income surged 88% to $582 million at a 10.6% margin, the first double-digit print. Experiences hit a record fiscal Q2 of $9.49 billion, helped by 5% higher domestic per capita spending.
| Business Driver | Netflix | Disney |
| Main Growth Engine | Ad-supported tier, price increases | Parks, SVOD bundles, tentpole IP |
| Margin Story | 31.5% operating margin trajectory | Streaming first hit 10.6% |
Pure Play Streamer Versus a Sprawling IP Empire
Netflix is choosing focus. Walking away from Warner Bros., acquiring Ben Affleck’s InterPositive GenAI filmmaking tools, and resuming buybacks ($1.3 billion repurchased in Q1, $6.8 billion remaining) all point to a leaner, software-style operator. Live events like the upcoming Tyson Fury vs Anthony Joshua bout add reach without changing the model.
Disney is widening the net, but smartly. New CEO Josh D’Amaro told investors, “Our creative and operational momentum drove strong quarterly results, and we continue to expect growth to accelerate in the second half of the fiscal year.” ESPN absorbed NFL Network in exchange for a 10% noncontrolling stake, the Disney Adventure cruise launched in Singapore, and an Abu Dhabi park uses capital-light partners. Buybacks were raised to $8 billion-plus for FY26.
The Next Test Is Whether Margins Hold
Netflix guided FY26 revenue to $50.7 to $51.7 billion with free cash flow raised to roughly $12.5 billion. Yet shares are down 18.13% since the April 16 earnings report, and Polymarket traders place 54.5% odds on $85 as the May target. I read that as the market wanting proof the ad tier scales without subscriber churn.
Disney expects ~16% adjusted EPS growth in FY26, though Sports operating income may fall about 14% in Q3 on higher rights costs. The Zootopia 2 box office of $1.9 billion shows the IP flywheel still spins.
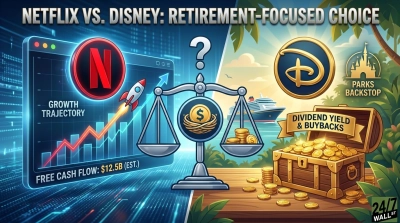
Why I Lean Toward Disney Right Now
Personally, Disney looks more interesting at this moment. Streaming has finally turned profitable, parks are setting records, and DIS is up 13.45% in the past month. Netflix is the cleaner business, but with a 23.62% one-year decline and soft Q2 guide chatter, I want clearer ad tier traction before adding. Growth investors may still prefer NFLX. I would change my view if Disney’s sports margins slip further, or if Netflix’s ad revenue closes in on that $3 billion bar early.
Contact [email protected] for any questions or corrections.