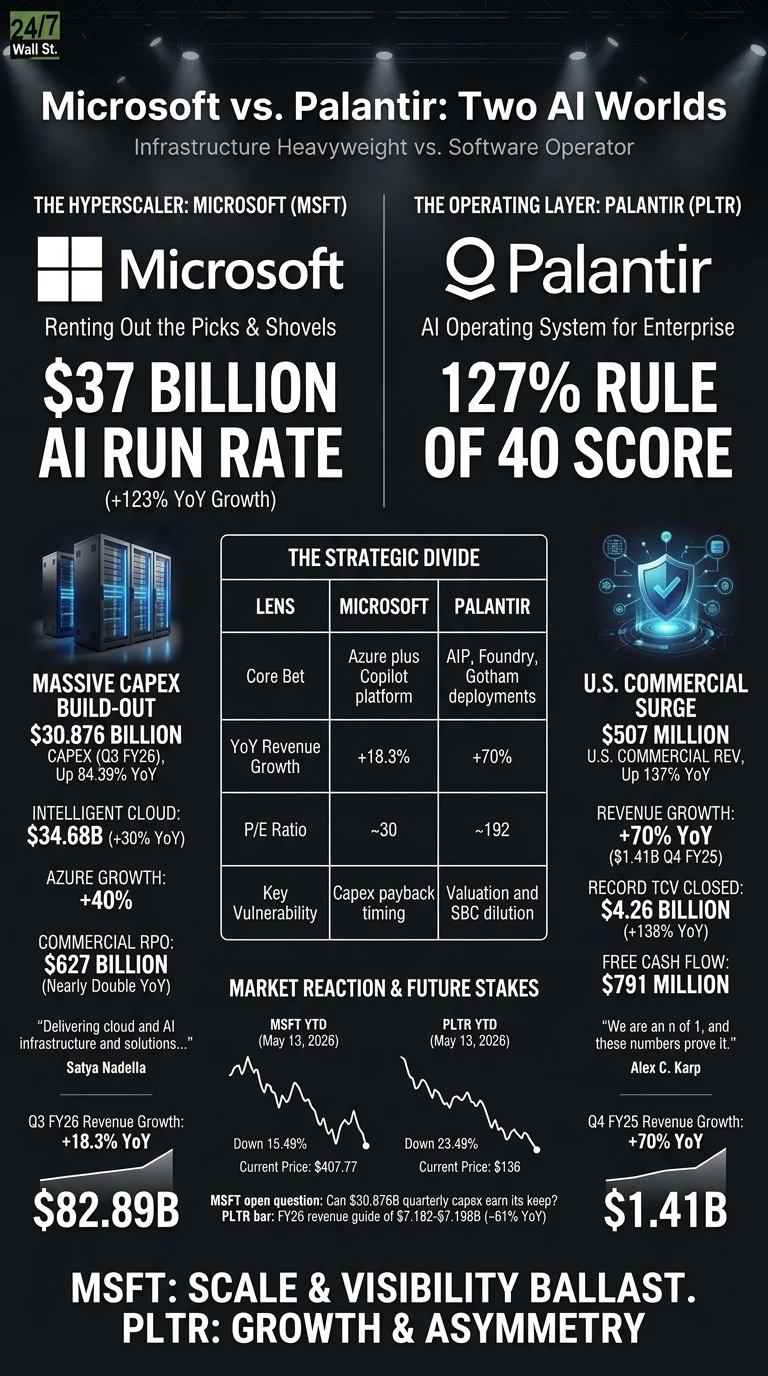
Microsoft (NASDAQ:MSFT | MSFT Price Prediction) and Palantir (NASDAQ:PLTR) both delivered AI-fueled earnings beats this season, yet the businesses behind those tickers operate at completely different altitudes. Microsoft is the hyperscaler renting out the picks and shovels.
Palantir is the operating layer that sits on top of enterprise and government data. Comparing them right now exposes how Wall Street is pricing two very different bets on the same theme.
Azure Carries Microsoft. U.S. Commercial Carries Palantir.
Microsoft’s Q3 FY26 report showed Intelligent Cloud revenue of $34.681 billion, up 30%, with Azure growing 40%. The headline number that mattered: an AI business at a $37 billion annual run rate, up 123%. Commercial remaining performance obligations sit at $627 billion, nearly double a year ago. That is a real demand backlog with contractual visibility.
Palantir’s Q4 FY25 was a smaller, hotter print. Revenue grew 70% to $1.41 billion, U.S. commercial revenue surged 137%, and the company posted a Rule of 40 score of 127%.
CEO Alex Karp’s commentary stayed characteristically loud, calling Palantir “an n of 1” while pointing to $4.26 billion in record TCV closed. Satya Nadella’s tone was the opposite, framing the quarter around delivering “cloud and AI infrastructure and solutions” for the agentic computing era.
Infrastructure Heavyweight vs. Software-Only Operator
The capital story is where the divide gets sharp. Microsoft spent $30.876 billion on capex in a single quarter, up 84.39%, mostly on GPUs, data centers, and power. Palantir is capital-light SaaS, generating $791 million in free cash flow against a much smaller revenue base. One company is buying the physics of AI. The other is selling the workflow on top.
| Lens | Microsoft | Palantir |
| Core bet | Azure plus Copilot platform | AIP, Foundry, Gotham deployments |
| YoY revenue growth | 18.3% | 70% |
| P/E ratio | ~30 | ~192 |
| Key vulnerability | Capex payback timing | Valuation and SBC dilution |
Microsoft’s customer base is sprawling and global. Palantir’s revenue is U.S.-heavy, with U.S. government at $570 million giving it defense and intelligence exposure that Microsoft does not match in concentration.
The Stock Reactions Tell the Real Story
Despite the beat, MSFT is down 15.49% year to date and trades at $407.77. Palantir is also lower YTD at down 23.49%, sitting at $136. Polymarket traders see PLTR pinning near $138 with 81% probability through this week.
What to Watch Through 2026
For Microsoft, the open question is whether that $30.876 billion quarterly capex earns its keep. Azure growth needs to stay above 35% to justify the spend.
For Palantir, the bar is the FY26 guide of $7.182 to $7.198 billion and U.S. commercial topping $3.144 billion. Karp set those numbers high on purpose.
Microsoft Screens as Ballast, Palantir as Asymmetry
On the metrics, Microsoft screens as the steadier core holding today. The $31.78 billion in net income and $627 billion RPO give me visibility I cannot get anywhere else at this scale, and the analyst target of $561.56 suggests Wall Street still sees room.
Palantir is a different animal. The 192 P/E only works if commercial TCV keeps compounding at triple digits, and the $684 million in FY25 stock-based comp remains a dilution overhang. PLTR’s profile skews to higher-beta, growth-dependent outcomes, while MSFT’s profile skews to scale, visibility, and cash generation.
Contact [email protected] for any questions or corrections.