
Nearly 2.5 million Americans to date have tested positive for COVID-19. During the month of June, the number of daily new COVID-19 cases in America steadily increased, setting new records on June 24 and 25 with more than 37,000 cases each day. This increase has largely been due to the rapid spread of coronavirus in several major metro areas.
Using data from state and local health departments, 24/7 Wall St. compiled and reviewed the average of new daily confirmed COVID-19 cases for the seven-day period ending June 24 and compared it to the average of new daily cases from the previous week to determine the cities where the virus is growing the fastest.
The 50 metro areas where COVID-19 is growing the fastest are spread out among 16 states, nearly all of which are in the Southern and Western U.S. Texas has by far the most cities on the list with 14, followed by Florida with eight, California with six, and Arizona with five. These are just a handful of states that have confirmed more cases since mid-May than they did during the previous two months of the pandemic. These are the states where COVID-19 cases have doubled in the last month.
This sharp increase in confirmed cases comes on the heels of many states easing social distancing restrictions. Recently, the governors of Texas, Florida, and several other states had to pause expansions of their reopening plans or even move their states back to more restrictive phases. These are every state’s rules for reopening amid the COVID-19 pandemic.
Click here too see the cities where COVIDd-19 is growing the fastest
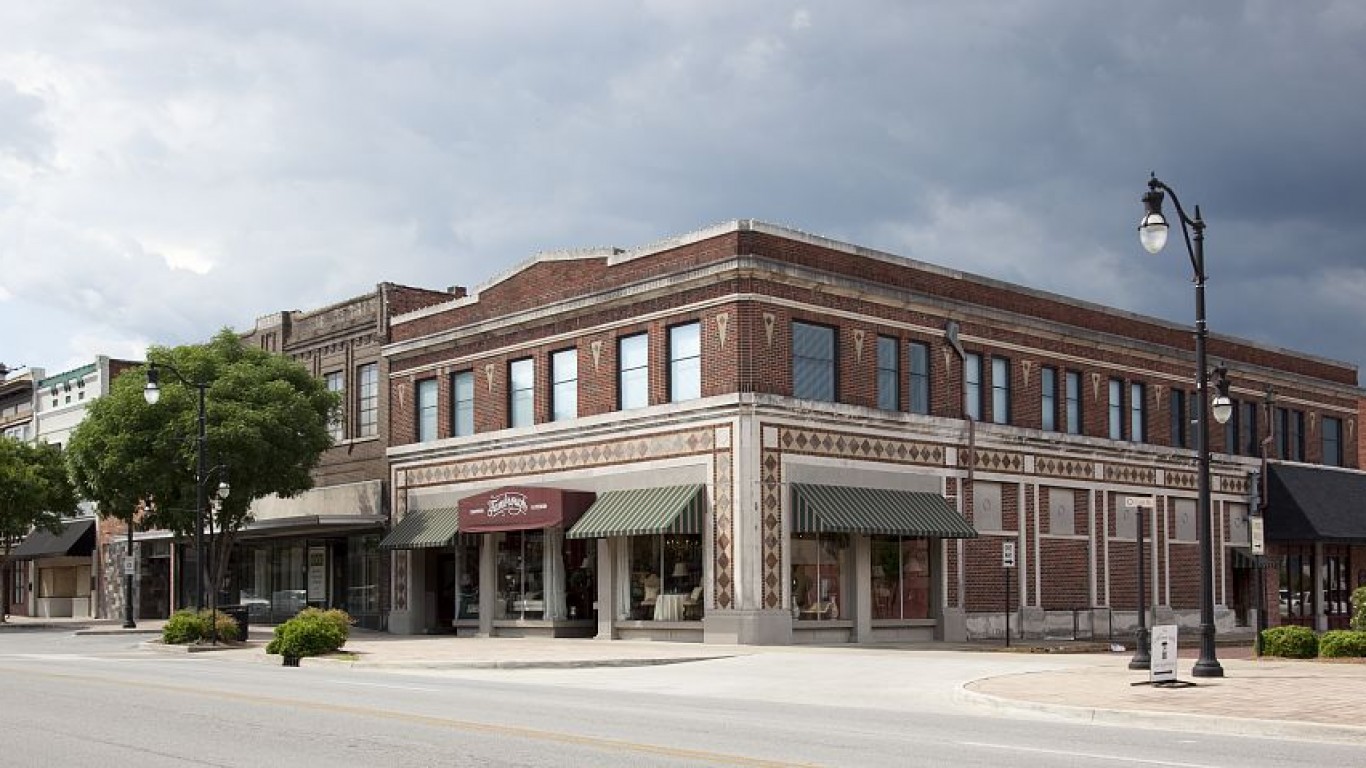
50. Gadsden, AL
> Change in daily avg. new COVID-19 cases week over week: +5.4 per 100,000 people
> Avg. new daily cases June 18-24: 11.7 per 100,000 people (rank: 71 out of 384 metro areas)
> Avg. new daily cases June 11-17: 6.3 per 100,000 people (rank: 126 out of 384 metro areas)
> Cumulative COVID-19 cases as of June 24: 440 per 100,000 people (total: 453)
> Cumulative COVID-19 deaths as of June 24: 12 per 100,000 people (total: 12)
> Population: 102,501
[in-text-ad]

49. Visalia, CA
> Change in daily avg. new COVID-19 cases week over week: +5.5 per 100,000 people
> Avg. new daily cases June 18-24: 17.5 per 100,000 people (rank: 33 out of 384 metro areas)
> Avg. new daily cases June 11-17: 12.0 per 100,000 people (rank: 40 out of 384 metro areas)
> Cumulative COVID-19 cases as of June 24: 769 per 100,000 people (total: 3,541)
> Cumulative COVID-19 deaths as of June 24: 26 per 100,000 people (total: 118)
> Population: 465,861
[recirclink id=715663]
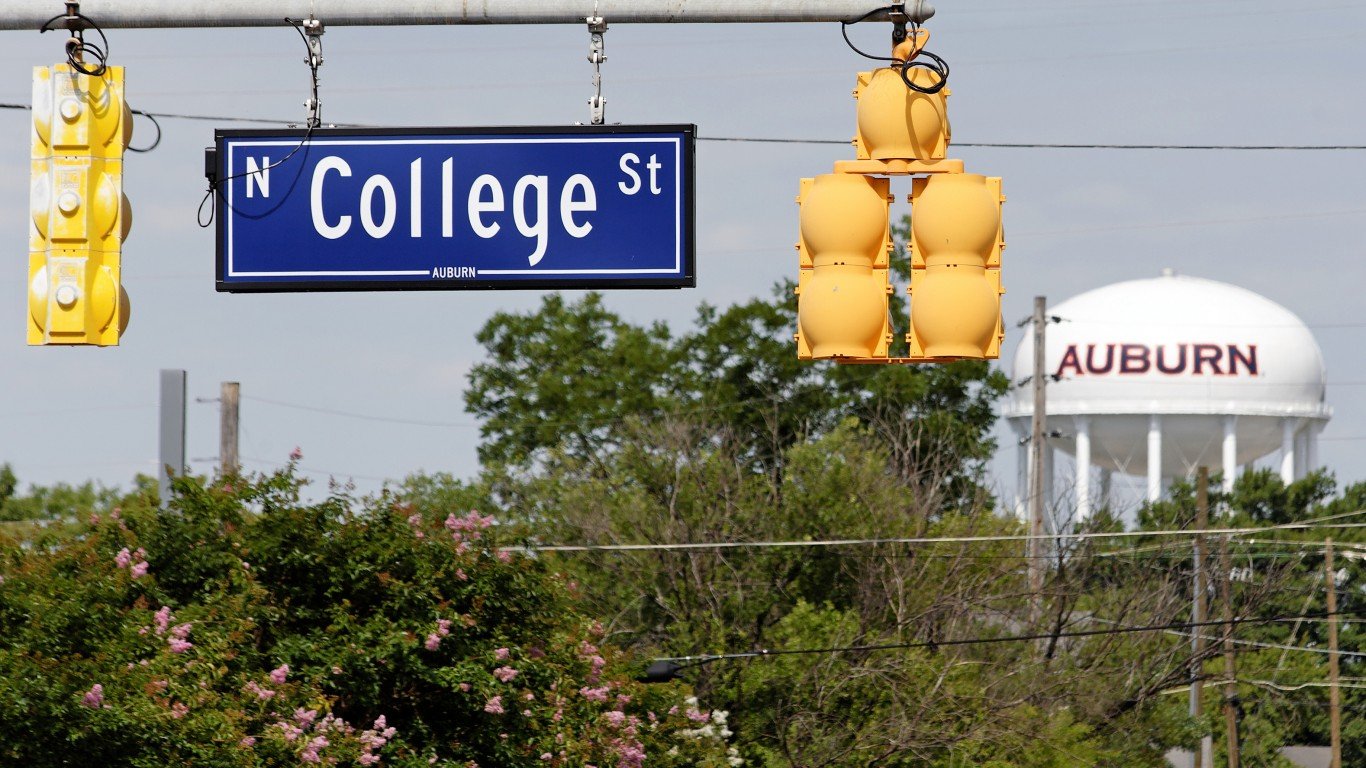
48. Auburn-Opelika, AL
> Change in daily avg. new COVID-19 cases week over week: +5.7 per 100,000 people
> Avg. new daily cases June 18-24: 15.0 per 100,000 people (rank: 48 out of 384 metro areas)
> Avg. new daily cases June 11-17: 9.3 per 100,000 people (rank: 66 out of 384 metro areas)
> Cumulative COVID-19 cases as of June 24: 602 per 100,000 people (total: 959)
> Cumulative COVID-19 deaths as of June 24: 23 per 100,000 people (total: 36)
> Population: 163,941

47. Wichita Falls, TX
> Change in daily avg. new COVID-19 cases week over week: +5.8 per 100,000 people
> Avg. new daily cases June 18-24: 7.3 per 100,000 people (rank: 137 out of 384 metro areas)
> Avg. new daily cases June 11-17: 1.5 per 100,000 people (rank: 315 out of 384 metro areas)
> Cumulative COVID-19 cases as of June 24: 165 per 100,000 people (total: 235)
> Cumulative COVID-19 deaths as of June 24: 1 per 100,000 people (total: 02)
> Population: 151,306
[in-text-ad-2]

46. Madera, CA
> Change in daily avg. new COVID-19 cases week over week: +5.8 per 100,000 people
> Avg. new daily cases June 18-24: 11.0 per 100,000 people (rank: 81 out of 384 metro areas)
> Avg. new daily cases June 11-17: 5.1 per 100,000 people (rank: 146 out of 384 metro areas)
> Cumulative COVID-19 cases as of June 24: 241 per 100,000 people (total: 373)
> Cumulative COVID-19 deaths as of June 24: 3 per 100,000 people (total: 05)
> Population: 157,672
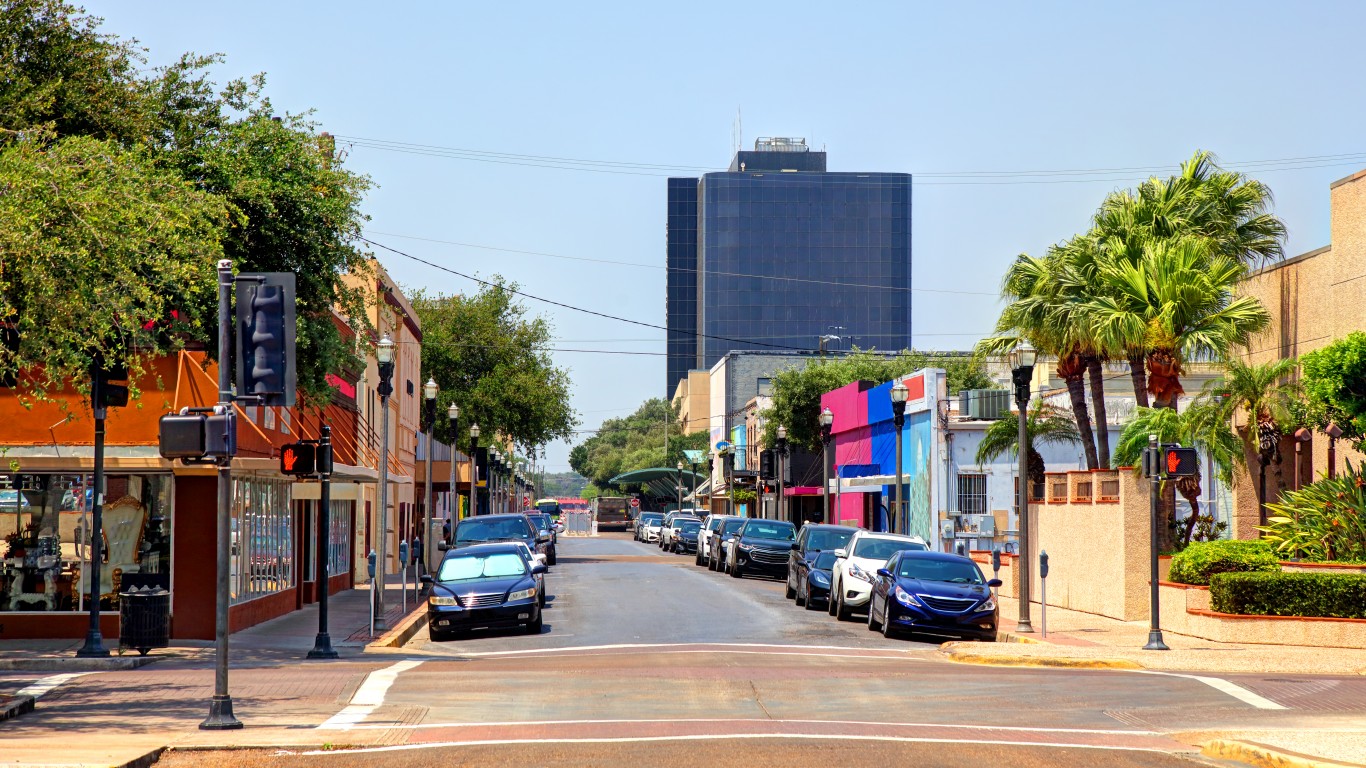
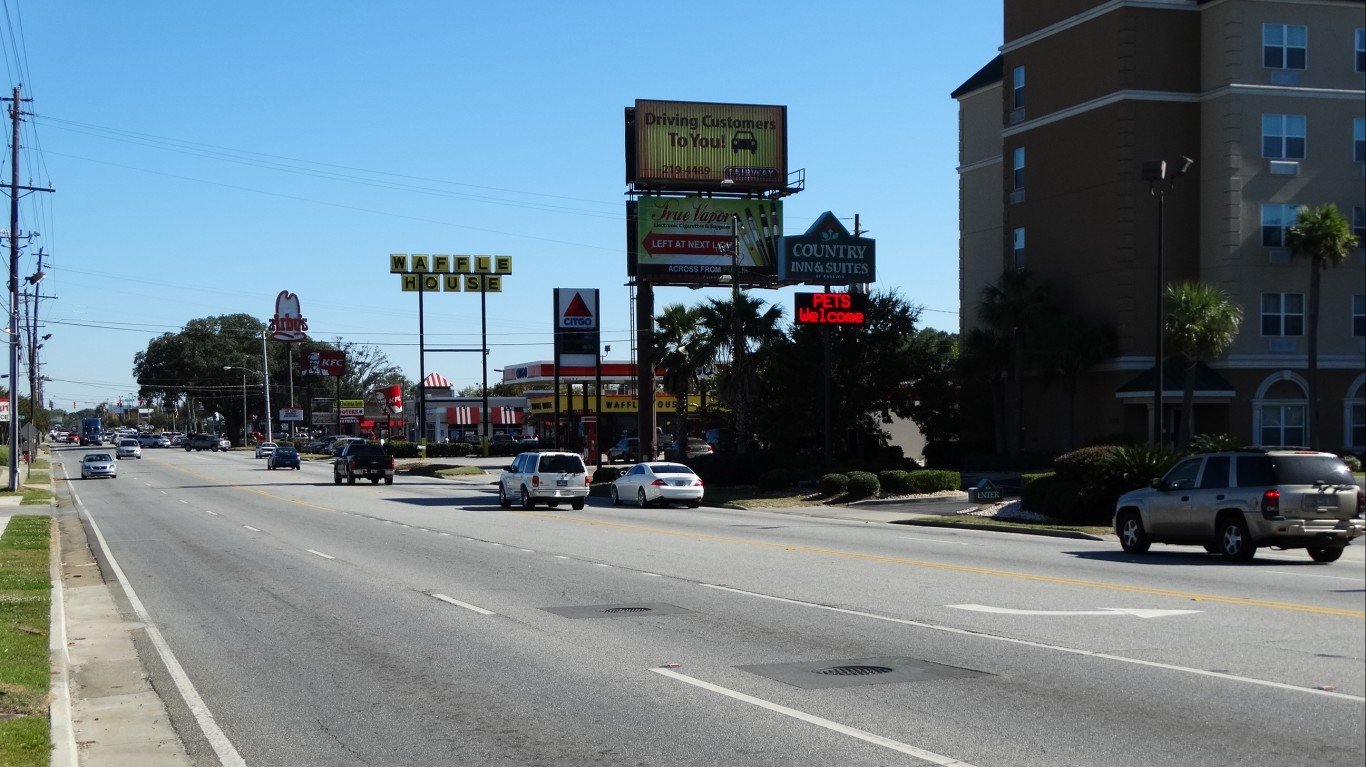
45. McAllen-Edinburg-Mission, TX
> Change in daily avg. new COVID-19 cases week over week: +5.8 per 100,000 people
> Avg. new daily cases June 18-24: 10.9 per 100,000 people (rank: 82 out of 384 metro areas)
> Avg. new daily cases June 11-17: 5.1 per 100,000 people (rank: 151 out of 384 metro areas)
> Cumulative COVID-19 cases as of June 24: 251 per 100,000 people (total: 2,130)
> Cumulative COVID-19 deaths as of June 24: 3 per 100,000 people (total: 25)
> Population: 865,939
[in-text-ad]

44. Boise City, ID
> Change in daily avg. new COVID-19 cases week over week: +5.9 per 100,000 people
> Avg. new daily cases June 18-24: 7.4 per 100,000 people (rank: 133 out of 384 metro areas)
> Avg. new daily cases June 11-17: 1.5 per 100,000 people (rank: 314 out of 384 metro areas)
> Cumulative COVID-19 cases as of June 24: 299 per 100,000 people (total: 2,077)
> Cumulative COVID-19 deaths as of June 24: 4 per 100,000 people (total: 29)
> Population: 732,257
[recirclink id=715446]

43. Merced, CA
> Change in daily avg. new COVID-19 cases week over week: +6.0 per 100,000 people
> Avg. new daily cases June 18-24: 9.8 per 100,000 people (rank: 96 out of 384 metro areas)
> Avg. new daily cases June 11-17: 3.9 per 100,000 people (rank: 198 out of 384 metro areas)
> Cumulative COVID-19 cases as of June 24: 259 per 100,000 people (total: 696)
> Cumulative COVID-19 deaths as of June 24: 4 per 100,000 people (total: 10)
> Population: 274,765

42. Elkhart-Goshen, IN
> Change in daily avg. new COVID-19 cases week over week: +6.0 per 100,000 people
> Avg. new daily cases June 18-24: 34.1 per 100,000 people (rank: 7 out of 384 metro areas)
> Avg. new daily cases June 11-17: 28.1 per 100,000 people (rank: 6 out of 384 metro areas)
> Cumulative COVID-19 cases as of June 24: 1,329 per 100,000 people (total: 2,705)
> Cumulative COVID-19 deaths as of June 24: 20 per 100,000 people (total: 40)
> Population: 205,560
[in-text-ad-2]

41. Tulsa, OK
> Change in daily avg. new COVID-19 cases week over week: +6.1 per 100,000 people
> Avg. new daily cases June 18-24: 12.5 per 100,000 people (rank: 66 out of 384 metro areas)
> Avg. new daily cases June 11-17: 6.4 per 100,000 people (rank: 122 out of 384 metro areas)
> Cumulative COVID-19 cases as of June 24: 354 per 100,000 people (total: 3,491)
> Cumulative COVID-19 deaths as of June 24: 11 per 100,000 people (total: 106)
> Population: 993,928

40. Cape Coral-Fort Myers, FL
> Change in daily avg. new COVID-19 cases week over week: +6.1 per 100,000 people
> Avg. new daily cases June 18-24: 16.3 per 100,000 people (rank: 41 out of 384 metro areas)
> Avg. new daily cases June 11-17: 10.2 per 100,000 people (rank: 56 out of 384 metro areas)
> Cumulative COVID-19 cases as of June 24: 549 per 100,000 people (total: 3,944)
> Cumulative COVID-19 deaths as of June 24: 21 per 100,000 people (total: 148)
> Population: 754,610
[in-text-ad]
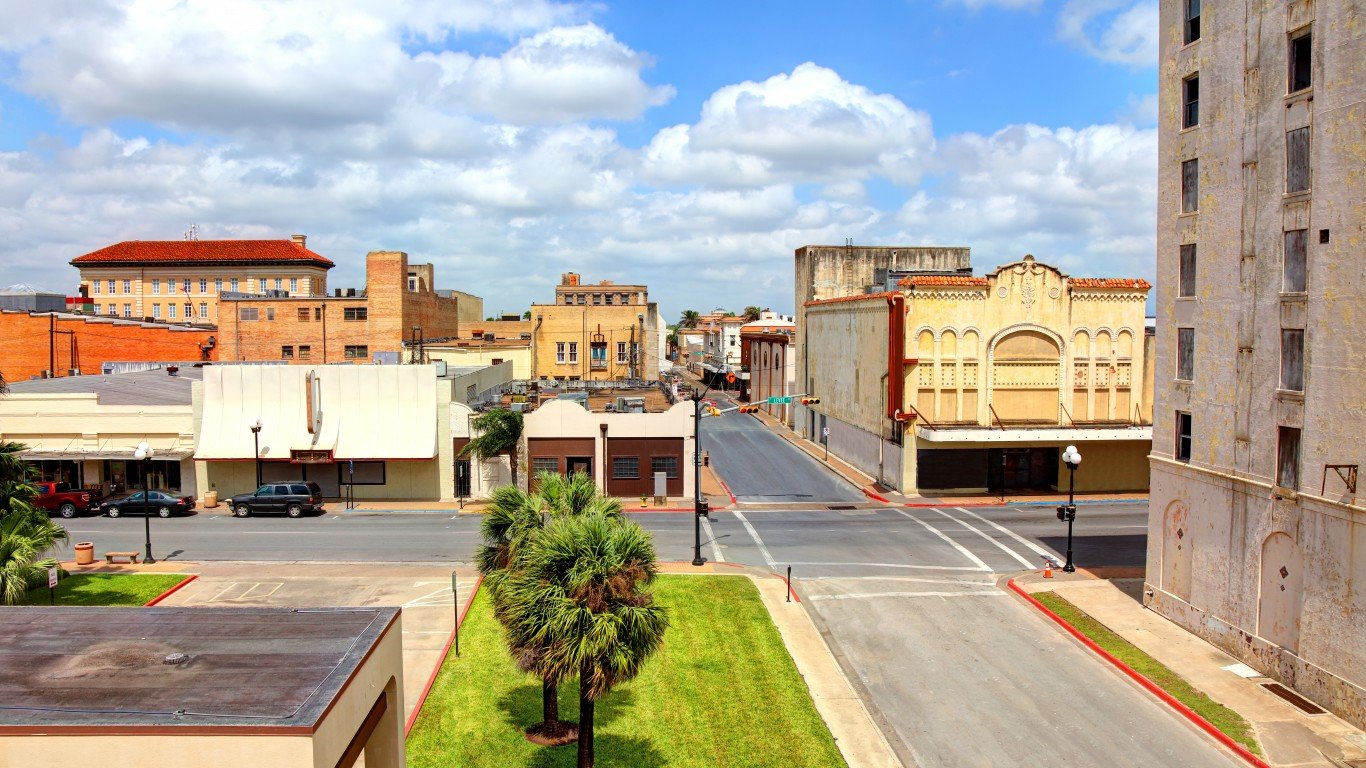
39. Brownsville-Harlingen, TX
> Change in daily avg. new COVID-19 cases week over week: +6.3 per 100,000 people
> Avg. new daily cases June 18-24: 13.9 per 100,000 people (rank: 56 out of 384 metro areas)
> Avg. new daily cases June 11-17: 7.6 per 100,000 people (rank: 98 out of 384 metro areas)
> Cumulative COVID-19 cases as of June 24: 417 per 100,000 people (total: 1,758)
> Cumulative COVID-19 deaths as of June 24: 12 per 100,000 people (total: 50)
> Population: 423,908
[recirclink id=715424]

38. Victoria, TX
> Change in daily avg. new COVID-19 cases week over week: +6.3 per 100,000 people
> Avg. new daily cases June 18-24: 9.7 per 100,000 people (rank: 101 out of 384 metro areas)
> Avg. new daily cases June 11-17: 3.4 per 100,000 people (rank: 218 out of 384 metro areas)
> Cumulative COVID-19 cases as of June 24: 355 per 100,000 people (total: 353)
> Cumulative COVID-19 deaths as of June 24: 8 per 100,000 people (total: 08)
> Population: 99,047

37. Waco, TX
> Change in daily avg. new COVID-19 cases week over week: +6.3 per 100,000 people
> Avg. new daily cases June 18-24: 8.4 per 100,000 people (rank: 115 out of 384 metro areas)
> Avg. new daily cases June 11-17: 2.0 per 100,000 people (rank: 287 out of 384 metro areas)
> Cumulative COVID-19 cases as of June 24: 168 per 100,000 people (total: 446)
> Cumulative COVID-19 deaths as of June 24: 2 per 100,000 people (total: 05)
> Population: 270,566
[in-text-ad-2]

36. San Angelo, TX
> Change in daily avg. new COVID-19 cases week over week: +6.3 per 100,000 people
> Avg. new daily cases June 18-24: 9.7 per 100,000 people (rank: 102 out of 384 metro areas)
> Avg. new daily cases June 11-17: 3.3 per 100,000 people (rank: 222 out of 384 metro areas)
> Cumulative COVID-19 cases as of June 24: 175 per 100,000 people (total: 206)
> Cumulative COVID-19 deaths as of June 24: 1 per 100,000 people (total: 01)
> Population: 119,310
35. Valdosta, GA
> Change in daily avg. new COVID-19 cases week over week: +6.4 per 100,000 people
> Avg. new daily cases June 18-24: 33.8 per 100,000 people (rank: 8 out of 384 metro areas)
> Avg. new daily cases June 11-17: 27.4 per 100,000 people (rank: 7 out of 384 metro areas)
> Cumulative COVID-19 cases as of June 24: 993 per 100,000 people (total: 1,435)
> Cumulative COVID-19 deaths as of June 24: 15 per 100,000 people (total: 21)
> Population: 145,577
[in-text-ad]
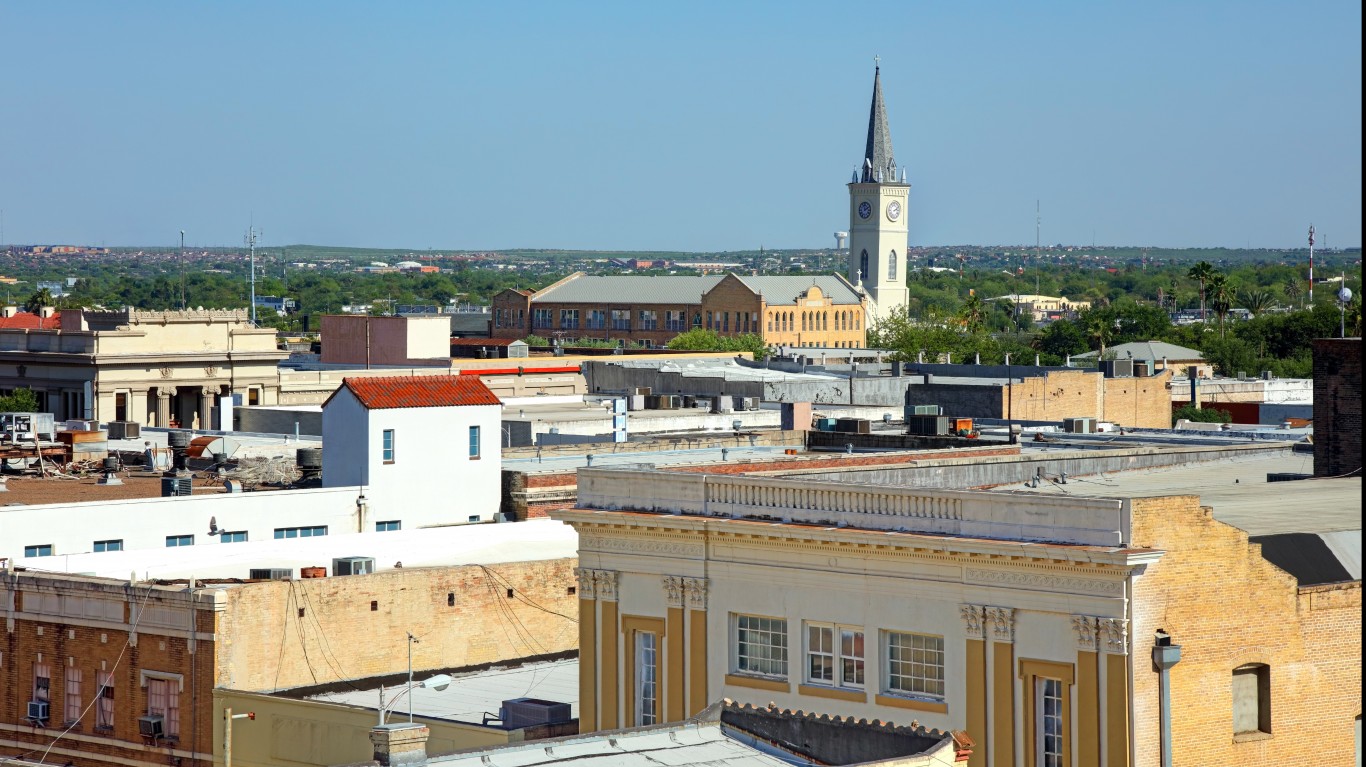
34. Laredo, TX
> Change in daily avg. new COVID-19 cases week over week: +6.5 per 100,000 people
> Avg. new daily cases June 18-24: 11.2 per 100,000 people (rank: 76 out of 384 metro areas)
> Avg. new daily cases June 11-17: 4.7 per 100,000 people (rank: 162 out of 384 metro areas)
> Cumulative COVID-19 cases as of June 24: 369 per 100,000 people (total: 1,003)
> Cumulative COVID-19 deaths as of June 24: 8 per 100,000 people (total: 23)
> Population: 275,910
[recirclink id=715037]

33. Miami-Fort Lauderdale-Pompano Beach, FL
> Change in daily avg. new COVID-19 cases week over week: +6.6 per 100,000 people
> Avg. new daily cases June 18-24: 18.6 per 100,000 people (rank: 29 out of 384 metro areas)
> Avg. new daily cases June 11-17: 12.0 per 100,000 people (rank: 39 out of 384 metro areas)
> Cumulative COVID-19 cases as of June 24: 849 per 100,000 people (total: 51,532)
> Cumulative COVID-19 deaths as of June 24: 29 per 100,000 people (total: 1,786)
> Population: 6,198,782

32. Mankato, MN
> Change in daily avg. new COVID-19 cases week over week: +6.6 per 100,000 people
> Avg. new daily cases June 18-24: 8.9 per 100,000 people (rank: 109 out of 384 metro areas)
> Avg. new daily cases June 11-17: 2.3 per 100,000 people (rank: 274 out of 384 metro areas)
> Cumulative COVID-19 cases as of June 24: 377 per 100,000 people (total: 377)
> Cumulative COVID-19 deaths as of June 24: 14 per 100,000 people (total: 14)
> Population: 101,647
[in-text-ad-2]

31. Modesto, CA
> Change in daily avg. new COVID-19 cases week over week: +6.7 per 100,000 people
> Avg. new daily cases June 18-24: 13.8 per 100,000 people (rank: 59 out of 384 metro areas)
> Avg. new daily cases June 11-17: 7.1 per 100,000 people (rank: 105 out of 384 metro areas)
> Cumulative COVID-19 cases as of June 24: 378 per 100,000 people (total: 2,039)
> Cumulative COVID-19 deaths as of June 24: 7 per 100,000 people (total: 38)
> Population: 549,815

30. Lakeland-Winter Haven, FL
> Change in daily avg. new COVID-19 cases week over week: +6.8 per 100,000 people
> Avg. new daily cases June 18-24: 12.9 per 100,000 people (rank: 64 out of 384 metro areas)
> Avg. new daily cases June 11-17: 6.1 per 100,000 people (rank: 127 out of 384 metro areas)
> Cumulative COVID-19 cases as of June 24: 367 per 100,000 people (total: 2,454)
> Cumulative COVID-19 deaths as of June 24: 12 per 100,000 people (total: 80)
> Population: 708,009
[in-text-ad]

29. North Port-Sarasota-Bradenton, FL
> Change in daily avg. new COVID-19 cases week over week: +7.1 per 100,000 people
> Avg. new daily cases June 18-24: 12.1 per 100,000 people (rank: 68 out of 384 metro areas)
> Avg. new daily cases June 11-17: 5.0 per 100,000 people (rank: 152 out of 384 metro areas)
> Cumulative COVID-19 cases as of June 24: 410 per 100,000 people (total: 3,223)
> Cumulative COVID-19 deaths as of June 24: 28 per 100,000 people (total: 222)
> Population: 821,573
[recirclink id=715143]

28. Houston-The Woodlands-Sugar Land, TX
> Change in daily avg. new COVID-19 cases week over week: +7.3 per 100,000 people
> Avg. new daily cases June 18-24: 13.9 per 100,000 people (rank: 57 out of 384 metro areas)
> Avg. new daily cases June 11-17: 6.6 per 100,000 people (rank: 120 out of 384 metro areas)
> Cumulative COVID-19 cases as of June 24: 498 per 100,000 people (total: 33,785)
> Cumulative COVID-19 deaths as of June 24: 7 per 100,000 people (total: 483)
> Population: 6,997,384

27. Jacksonville, FL
> Change in daily avg. new COVID-19 cases week over week: +7.6 per 100,000 people
> Avg. new daily cases June 18-24: 10.6 per 100,000 people (rank: 85 out of 384 metro areas)
> Avg. new daily cases June 11-17: 3.0 per 100,000 people (rank: 237 out of 384 metro areas)
> Cumulative COVID-19 cases as of June 24: 316 per 100,000 people (total: 4,660)
> Cumulative COVID-19 deaths as of June 24: 7 per 100,000 people (total: 107)
> Population: 1,534,701
[in-text-ad-2]

26. Flagstaff, AZ
> Change in daily avg. new COVID-19 cases week over week: +7.6 per 100,000 people
> Avg. new daily cases June 18-24: 17.0 per 100,000 people (rank: 36 out of 384 metro areas)
> Avg. new daily cases June 11-17: 9.3 per 100,000 people (rank: 63 out of 384 metro areas)
> Cumulative COVID-19 cases as of June 24: 1,149 per 100,000 people (total: 1,611)
> Cumulative COVID-19 deaths as of June 24: 65 per 100,000 people (total: 91)
> Population: 142,854

25. Hilton Head Island-Bluffton, SC
> Change in daily avg. new COVID-19 cases week over week: +7.7 per 100,000 people
> Avg. new daily cases June 18-24: 18.6 per 100,000 people (rank: 28 out of 384 metro areas)
> Avg. new daily cases June 11-17: 10.9 per 100,000 people (rank: 49 out of 384 metro areas)
> Cumulative COVID-19 cases as of June 24: 493 per 100,000 people (total: 1,039)
> Cumulative COVID-19 deaths as of June 24: 9 per 100,000 people (total: 20)
> Population: 217,686
[in-text-ad]

24. Iowa City, IA
> Change in daily avg. new COVID-19 cases week over week: +7.7 per 100,000 people
> Avg. new daily cases June 18-24: 9.8 per 100,000 people (rank: 98 out of 384 metro areas)
> Avg. new daily cases June 11-17: 2.1 per 100,000 people (rank: 286 out of 384 metro areas)
> Cumulative COVID-19 cases as of June 24: 620 per 100,000 people (total: 1,049)
> Cumulative COVID-19 deaths as of June 24: 10 per 100,000 people (total: 17)
> Population: 173,401
[recirclink id=715663]

23. Corpus Christi, TX
> Change in daily avg. new COVID-19 cases week over week: +8.0 per 100,000 people
> Avg. new daily cases June 18-24: 9.8 per 100,000 people (rank: 99 out of 384 metro areas)
> Avg. new daily cases June 11-17: 1.8 per 100,000 people (rank: 299 out of 384 metro areas)
> Cumulative COVID-19 cases as of June 24: 210 per 100,000 people (total: 898)
> Cumulative COVID-19 deaths as of June 24: 1 per 100,000 people (total: 06)
> Population: 452,927

22. Midland, TX
> Change in daily avg. new COVID-19 cases week over week: +8.0 per 100,000 people
> Avg. new daily cases June 18-24: 11.9 per 100,000 people (rank: 69 out of 384 metro areas)
> Avg. new daily cases June 11-17: 3.9 per 100,000 people (rank: 199 out of 384 metro areas)
> Cumulative COVID-19 cases as of June 24: 272 per 100,000 people (total: 462)
> Cumulative COVID-19 deaths as of June 24: 9 per 100,000 people (total: 15)
> Population: 177,218
[in-text-ad-2]

21. San Antonio-New Braunfels, TX
> Change in daily avg. new COVID-19 cases week over week: +8.5 per 100,000 people
> Avg. new daily cases June 18-24: 14.9 per 100,000 people (rank: 50 out of 384 metro areas)
> Avg. new daily cases June 11-17: 6.4 per 100,000 people (rank: 123 out of 384 metro areas)
> Cumulative COVID-19 cases as of June 24: 361 per 100,000 people (total: 8,756)
> Cumulative COVID-19 deaths as of June 24: 5 per 100,000 people (total: 117)
> Population: 2,518,036

20. La Crosse-Onalaska, WI-MN
> Change in daily avg. new COVID-19 cases week over week: +9.3 per 100,000 people
> Avg. new daily cases June 18-24: 14.4 per 100,000 people (rank: 52 out of 384 metro areas)
> Avg. new daily cases June 11-17: 5.1 per 100,000 people (rank: 147 out of 384 metro areas)
> Cumulative COVID-19 cases as of June 24: 242 per 100,000 people (total: 331)
> Cumulative COVID-19 deaths as of June 24: 0 per 100,000 people (total: 00)
> Population: 136,808
[in-text-ad]

19. Orlando-Kissimmee-Sanford, FL
> Change in daily avg. new COVID-19 cases week over week: +9.3 per 100,000 people
> Avg. new daily cases June 18-24: 16.4 per 100,000 people (rank: 40 out of 384 metro areas)
> Avg. new daily cases June 11-17: 7.1 per 100,000 people (rank: 106 out of 384 metro areas)
> Cumulative COVID-19 cases as of June 24: 398 per 100,000 people (total: 9,740)
> Cumulative COVID-19 deaths as of June 24: 5 per 100,000 people (total: 114)
> Population: 2,572,962
[recirclink id=715446]

18. Tampa-St. Petersburg-Clearwater, FL
> Change in daily avg. new COVID-19 cases week over week: +9.4 per 100,000 people
> Avg. new daily cases June 18-24: 17.5 per 100,000 people (rank: 34 out of 384 metro areas)
> Avg. new daily cases June 11-17: 8.0 per 100,000 people (rank: 85 out of 384 metro areas)
> Cumulative COVID-19 cases as of June 24: 415 per 100,000 people (total: 12,581)
> Cumulative COVID-19 deaths as of June 24: 9 per 100,000 people (total: 275)
> Population: 3,142,663

17. Austin-Round Rock-Georgetown, TX
> Change in daily avg. new COVID-19 cases week over week: +9.8 per 100,000 people
> Avg. new daily cases June 18-24: 19.1 per 100,000 people (rank: 26 out of 384 metro areas)
> Avg. new daily cases June 11-17: 9.3 per 100,000 people (rank: 64 out of 384 metro areas)
> Cumulative COVID-19 cases as of June 24: 522 per 100,000 people (total: 10,754)
> Cumulative COVID-19 deaths as of June 24: 8 per 100,000 people (total: 157)
> Population: 2,168,316
[in-text-ad-2]

16. Kennewick-Richland, WA
> Change in daily avg. new COVID-19 cases week over week: +10.0 per 100,000 people
> Avg. new daily cases June 18-24: 28.9 per 100,000 people (rank: 10 out of 384 metro areas)
> Avg. new daily cases June 11-17: 18.9 per 100,000 people (rank: 18 out of 384 metro areas)
> Cumulative COVID-19 cases as of June 24: 1,029 per 100,000 people (total: 2,930)
> Cumulative COVID-19 deaths as of June 24: 38 per 100,000 people (total: 107)
> Population: 296,224

15. Sierra Vista-Douglas, AZ
> Change in daily avg. new COVID-19 cases week over week: +10.3 per 100,000 people
> Avg. new daily cases June 18-24: 18.2 per 100,000 people (rank: 32 out of 384 metro areas)
> Avg. new daily cases June 11-17: 7.9 per 100,000 people (rank: 89 out of 384 metro areas)
> Cumulative COVID-19 cases as of June 24: 349 per 100,000 people (total: 441)
> Cumulative COVID-19 deaths as of June 24: 5 per 100,000 people (total: 06)
> Population: 126,770
[in-text-ad]

14. Tucson, AZ
> Change in daily avg. new COVID-19 cases week over week: +10.9 per 100,000 people
> Avg. new daily cases June 18-24: 22.7 per 100,000 people (rank: 16 out of 384 metro areas)
> Avg. new daily cases June 11-17: 11.8 per 100,000 people (rank: 42 out of 384 metro areas)
> Cumulative COVID-19 cases as of June 24: 620 per 100,000 people (total: 6,318)
> Cumulative COVID-19 deaths as of June 24: 25 per 100,000 people (total: 255)
> Population: 1,039,073
[recirclink id=715424]
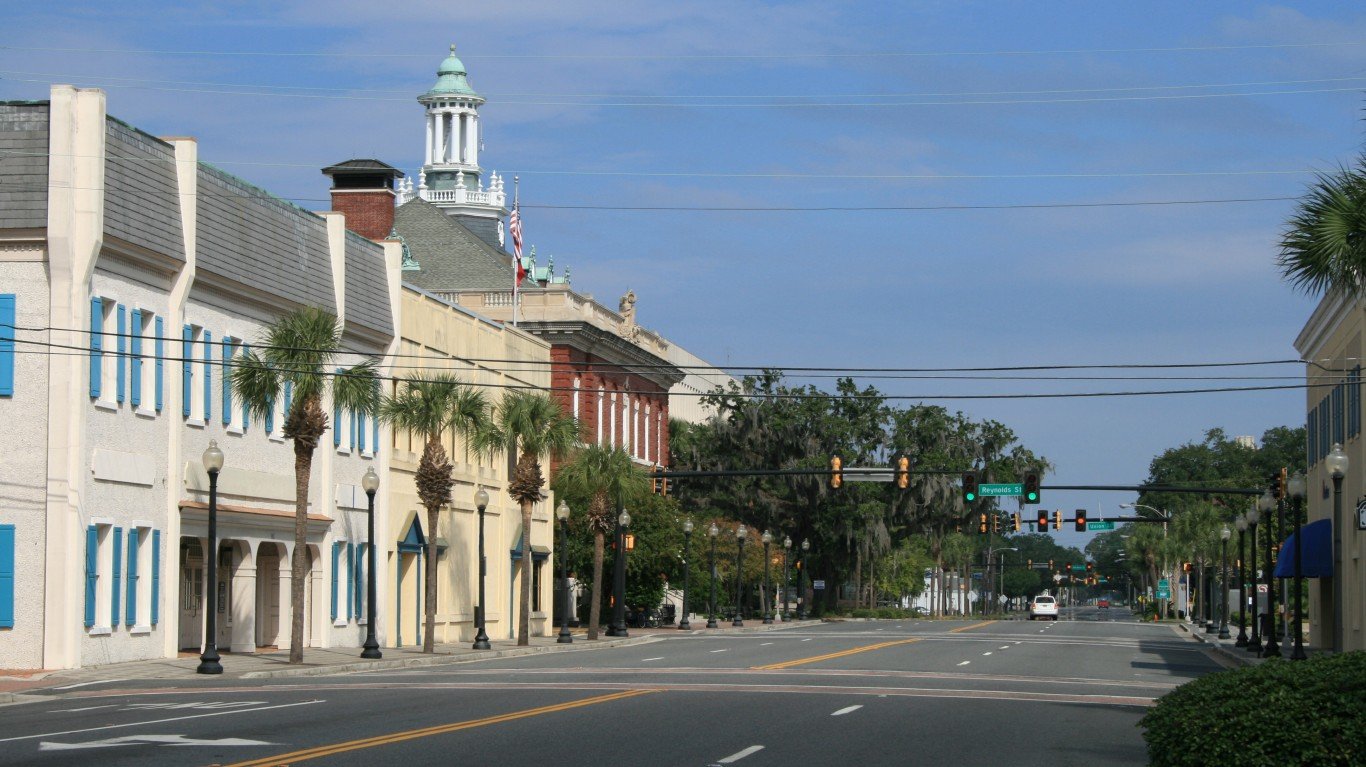
13. Brunswick, GA
> Change in daily avg. new COVID-19 cases week over week: +11.0 per 100,000 people
> Avg. new daily cases June 18-24: 16.3 per 100,000 people (rank: 42 out of 384 metro areas)
> Avg. new daily cases June 11-17: 5.2 per 100,000 people (rank: 145 out of 384 metro areas)
> Cumulative COVID-19 cases as of June 24: 437 per 100,000 people (total: 510)
> Cumulative COVID-19 deaths as of June 24: 5 per 100,000 people (total: 06)
> Population: 116,864

12. Sebastian-Vero Beach, FL
> Change in daily avg. new COVID-19 cases week over week: +11.2 per 100,000 people
> Avg. new daily cases June 18-24: 15.8 per 100,000 people (rank: 45 out of 384 metro areas)
> Avg. new daily cases June 11-17: 4.7 per 100,000 people (rank: 163 out of 384 metro areas)
> Cumulative COVID-19 cases as of June 24: 303 per 100,000 people (total: 457)
> Cumulative COVID-19 deaths as of June 24: 10 per 100,000 people (total: 15)
> Population: 157,413
[in-text-ad-2]

11. Myrtle Beach-Conway-North Myrtle Beach, SC-NC
> Change in daily avg. new COVID-19 cases week over week: +11.6 per 100,000 people
> Avg. new daily cases June 18-24: 29.9 per 100,000 people (rank: 9 out of 384 metro areas)
> Avg. new daily cases June 11-17: 18.3 per 100,000 people (rank: 19 out of 384 metro areas)
> Cumulative COVID-19 cases as of June 24: 617 per 100,000 people (total: 2,761)
> Cumulative COVID-19 deaths as of June 24: 10 per 100,000 people (total: 45)
> Population: 480,891

10. Charleston-North Charleston, SC
> Change in daily avg. new COVID-19 cases week over week: +12.3 per 100,000 people
> Avg. new daily cases June 18-24: 21.4 per 100,000 people (rank: 18 out of 384 metro areas)
> Avg. new daily cases June 11-17: 9.0 per 100,000 people (rank: 70 out of 384 metro areas)
> Cumulative COVID-19 cases as of June 24: 475 per 100,000 people (total: 3,608)
> Cumulative COVID-19 deaths as of June 24: 6 per 100,000 people (total: 44)
> Population: 787,643
[in-text-ad]

9. Ames, IA
> Change in daily avg. new COVID-19 cases week over week: +13.0 per 100,000 people
> Avg. new daily cases June 18-24: 25.8 per 100,000 people (rank: 12 out of 384 metro areas)
> Avg. new daily cases June 11-17: 12.7 per 100,000 people (rank: 35 out of 384 metro areas)
> Cumulative COVID-19 cases as of June 24: 534 per 100,000 people (total: 659)
> Cumulative COVID-19 deaths as of June 24: 3 per 100,000 people (total: 04)
> Population: 98,105
[recirclink id=715037]
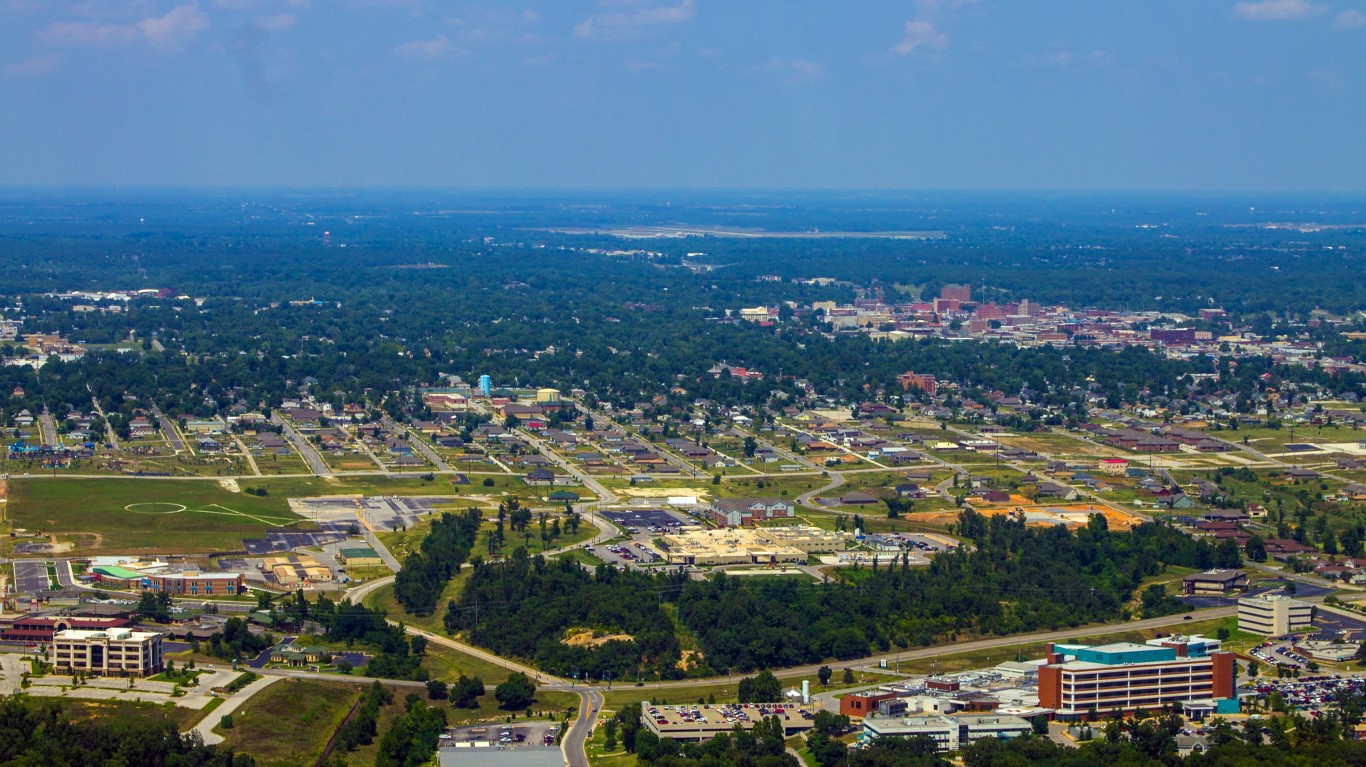
8. Joplin, MO
> Change in daily avg. new COVID-19 cases week over week: +13.4 per 100,000 people
> Avg. new daily cases June 18-24: 21.3 per 100,000 people (rank: 19 out of 384 metro areas)
> Avg. new daily cases June 11-17: 7.9 per 100,000 people (rank: 88 out of 384 metro areas)
> Cumulative COVID-19 cases as of June 24: 322 per 100,000 people (total: 572)
> Cumulative COVID-19 deaths as of June 24: 1 per 100,000 people (total: 02)
> Population: 178,902

7. College Station-Bryan, TX
> Change in daily avg. new COVID-19 cases week over week: +14.3 per 100,000 people
> Avg. new daily cases June 18-24: 25.1 per 100,000 people (rank: 13 out of 384 metro areas)
> Avg. new daily cases June 11-17: 10.8 per 100,000 people (rank: 52 out of 384 metro areas)
> Cumulative COVID-19 cases as of June 24: 553 per 100,000 people (total: 1,405)
> Cumulative COVID-19 deaths as of June 24: 10 per 100,000 people (total: 25)
> Population: 265,024
[in-text-ad-2]
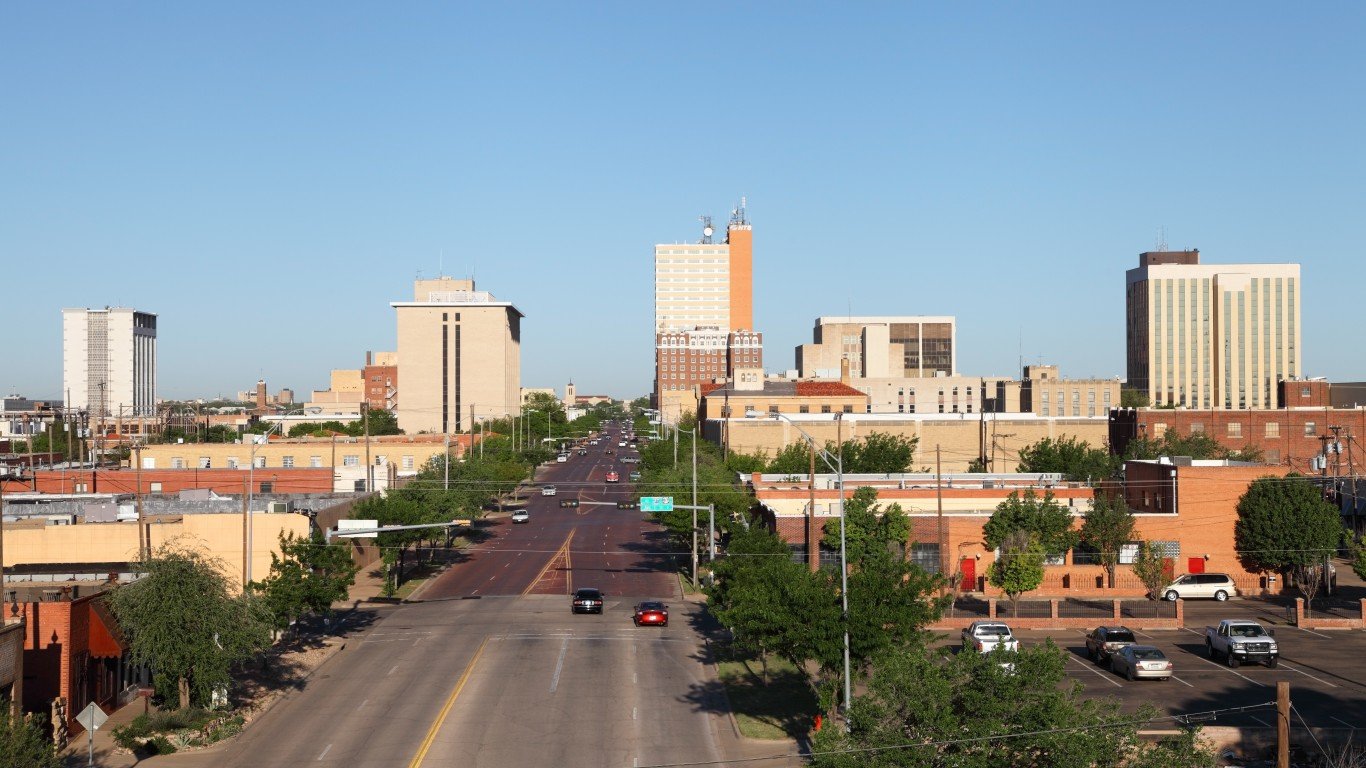
6. Lubbock, TX
> Change in daily avg. new COVID-19 cases week over week: +14.6 per 100,000 people
> Avg. new daily cases June 18-24: 20.1 per 100,000 people (rank: 21 out of 384 metro areas)
> Avg. new daily cases June 11-17: 5.4 per 100,000 people (rank: 139 out of 384 metro areas)
> Cumulative COVID-19 cases as of June 24: 506 per 100,000 people (total: 1,583)
> Cumulative COVID-19 deaths as of June 24: 17 per 100,000 people (total: 53)
> Population: 319,995

5. Springfield, OH
> Change in daily avg. new COVID-19 cases week over week: +15.1 per 100,000 people
> Avg. new daily cases June 18-24: 23.1 per 100,000 people (rank: 15 out of 384 metro areas)
> Avg. new daily cases June 11-17: 8.0 per 100,000 people (rank: 87 out of 384 metro areas)
> Cumulative COVID-19 cases as of June 24: 516 per 100,000 people (total: 697)
> Cumulative COVID-19 deaths as of June 24: 6 per 100,000 people (total: 08)
> Population: 134,585
[in-text-ad]

4. Phoenix-Mesa-Chandler, AZ
> Change in daily avg. new COVID-19 cases week over week: +19.8 per 100,000 people
> Avg. new daily cases June 18-24: 37.3 per 100,000 people (rank: 5 out of 384 metro areas)
> Avg. new daily cases June 11-17: 17.5 per 100,000 people (rank: 21 out of 384 metro areas)
> Cumulative COVID-19 cases as of June 24: 808 per 100,000 people (total: 37,770)
> Cumulative COVID-19 deaths as of June 24: 16 per 100,000 people (total: 745)
> Population: 4,857,962
[recirclink id=715143]
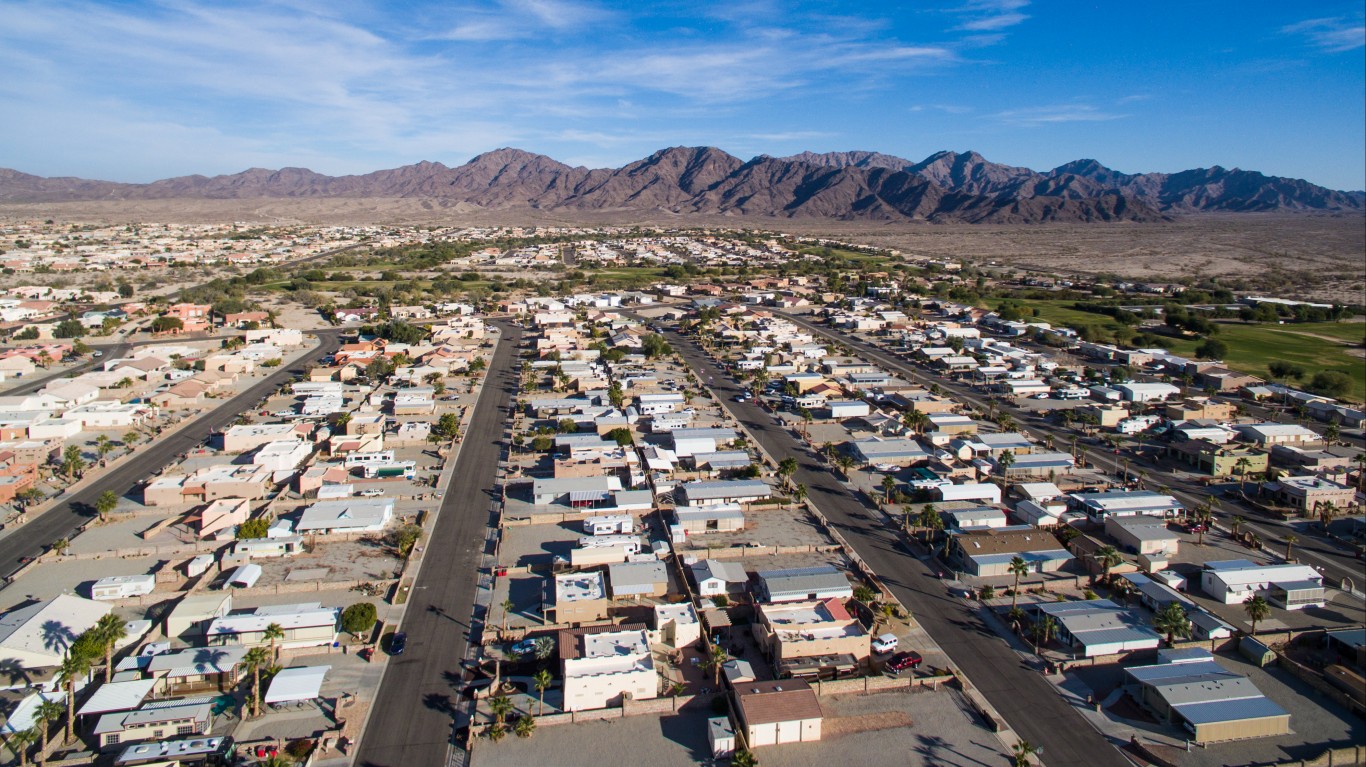
3. Yuma, AZ
> Change in daily avg. new COVID-19 cases week over week: +19.9 per 100,000 people
> Avg. new daily cases June 18-24: 89.6 per 100,000 people (rank: 1 out of 384 metro areas)
> Avg. new daily cases June 11-17: 69.6 per 100,000 people (rank: 1 out of 384 metro areas)
> Cumulative COVID-19 cases as of June 24: 2,365 per 100,000 people (total: 4,915)
> Cumulative COVID-19 deaths as of June 24: 33 per 100,000 people (total: 68)
> Population: 212,128

2. El Centro, CA
> Change in daily avg. new COVID-19 cases week over week: +23.6 per 100,000 people
> Avg. new daily cases June 18-24: 78.1 per 100,000 people (rank: 2 out of 384 metro areas)
> Avg. new daily cases June 11-17: 54.4 per 100,000 people (rank: 2 out of 384 metro areas)
> Cumulative COVID-19 cases as of June 24: 2,851 per 100,000 people (total: 5,138)
> Cumulative COVID-19 deaths as of June 24: 39 per 100,000 people (total: 70)
> Population: 181,827
[in-text-ad-2]

1. Hanford-Corcoran, CA
> Change in daily avg. new COVID-19 cases week over week: +32.1 per 100,000 people
> Avg. new daily cases June 18-24: 44.0 per 100,000 people (rank: 4 out of 384 metro areas)
> Avg. new daily cases June 11-17: 11.9 per 100,000 people (rank: 41 out of 384 metro areas)
> Cumulative COVID-19 cases as of June 24: 1,375 per 100,000 people (total: 2,063)
> Cumulative COVID-19 deaths as of June 24: 13 per 100,000 people (total: 20)
> Population: 151,366
Contact [email protected] for any questions or corrections.