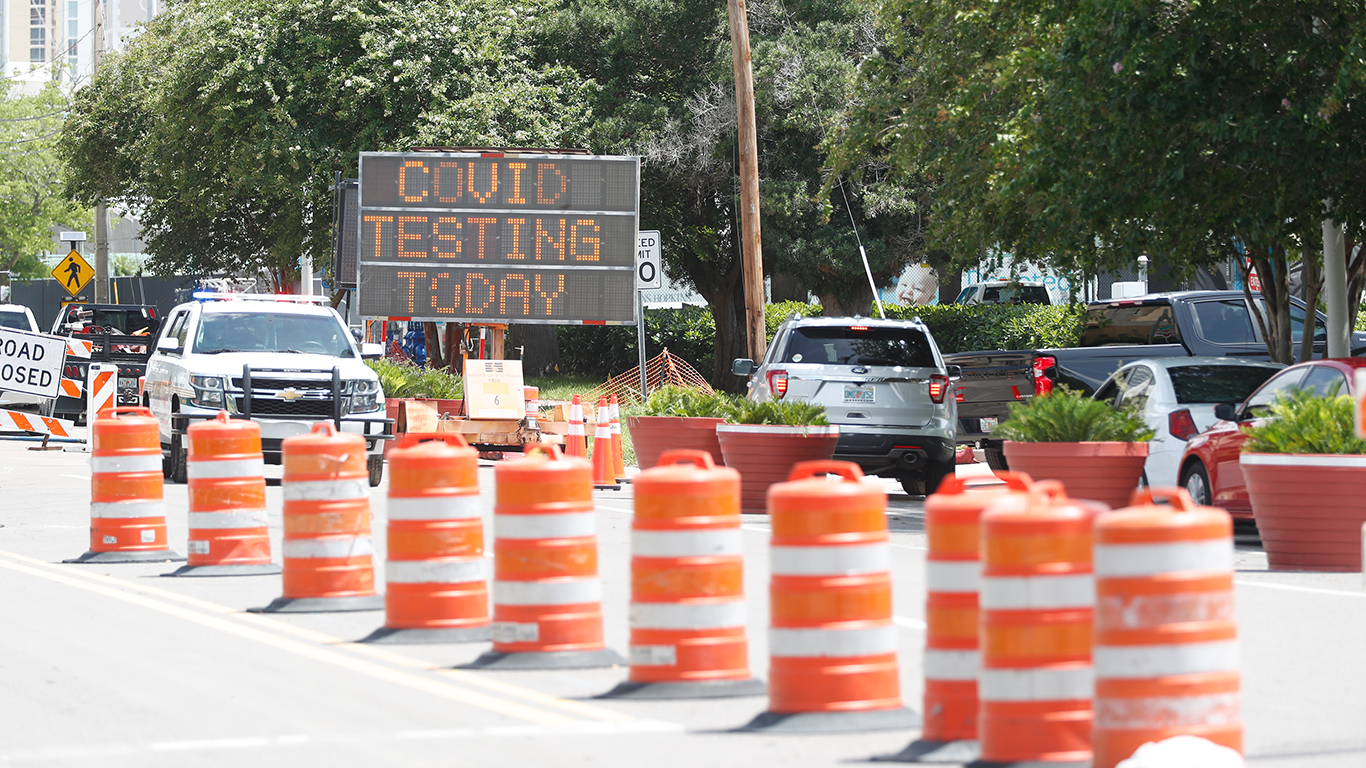
More than 52,600 new cases of COVID-19 were diagnosed in the United States on July 1 — an all-time high and a 123% increase from two weeks prior. According to testimony from Dr. Anthony Fauci, the nation’s leading infectious disease specialist, new cases could soon reach as high as 100,000 per day — a stark reminder that in many states, the projected peak date for the outbreak lies months in the future. Here is a look at the COVID-19 peak date in every state.
While new cases of the virus are spiking dramatically nationwide, in some metropolitan areas, the average daily increase dwarfs that of the U.S. as a whole, adjusting for population.
Using data from state and local health departments, 24/7 Wall St. compiled and reviewed the average number of new daily confirmed COVID-19 cases for the week ending June 29 and compared it to the average of new daily cases from the previous week to determine the cities where the virus is growing the fastest. For comparison purposes, we adjusted the number of confirmed cases per 100,000 people.
Nationwide, the average number of new daily cases climbed by 2.9 per 100,000 people week over week. Among the metro areas on this list, the average climbed anywhere between 6.9 cases to 57.4 per 100,000 people.
The surge in infections among the metro areas on this list are driving up overall infection rates in their respective states. For example, half of the cities on this list are located in either Florida or Texas. It is no coincidence that both Florida and Texas also rank among the top five states where the virus is currently surging. Here is a complete list of the states where the virus is growing the fastest right now.
Click here to see the cities where COVID-19 is growing the fastest

50. Baton Rouge, LA
> Change in daily avg. new COVID-19 cases week over week: +6.9 per 100,000 people
> Avg. new daily cases June 23-29: 15.6 per 100,000 people (rank: 76 out of 383 metro areas)
> Avg. new daily cases June 16-22: 8.7 per 100,000 people (rank: 103 out of 383 metro areas)
> Cumulative COVID-19 cases as of June 29: 1,082 per 100,000 people (total: 9,224)
> Cumulative COVID-19 deaths as of June 29: 62 per 100,000 people (total: 527)
> Population: 831,310
[in-text-ad]

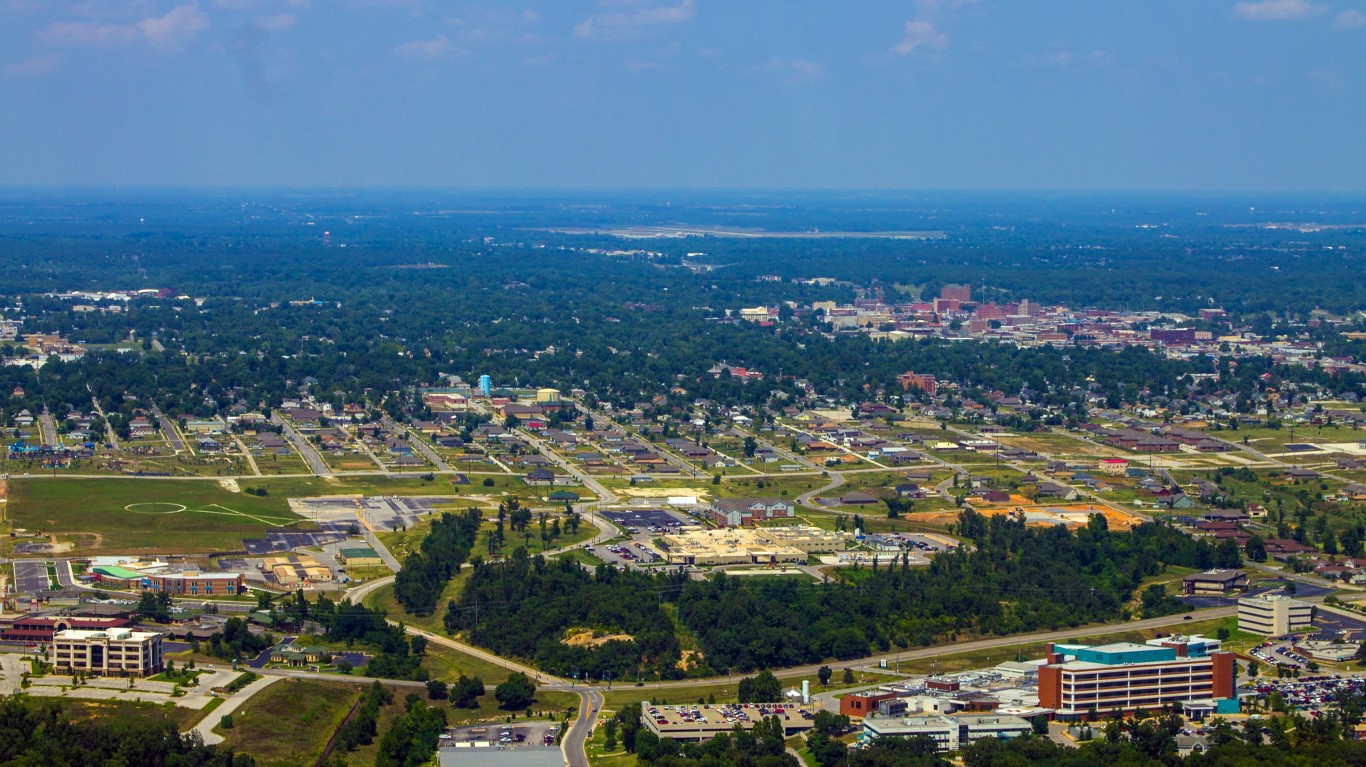
49. Memphis, TN-MS-AR
> Change in daily avg. new COVID-19 cases week over week: +7.0 per 100,000 people
> Avg. new daily cases June 23-29: 21.5 per 100,000 people (rank: 39 out of 383 metro areas)
> Avg. new daily cases June 16-22: 14.5 per 100,000 people (rank: 44 out of 383 metro areas)
> Cumulative COVID-19 cases as of June 29: 979 per 100,000 people (total: 13,094)
> Cumulative COVID-19 deaths as of June 29: 17 per 100,000 people (total: 230)
> Population: 1.4 million
[recirclink id=713288]

48. Tallahassee, FL
> Change in daily avg. new COVID-19 cases week over week: +7.0 per 100,000 people
> Avg. new daily cases June 23-29: 10.4 per 100,000 people (rank: 121 out of 383 metro areas)
> Avg. new daily cases June 16-22: 3.4 per 100,000 people (rank: 236 out of 383 metro areas)
> Cumulative COVID-19 cases as of June 29: 388 per 100,000 people (total: 1,475)
> Cumulative COVID-19 deaths as of June 29: 5 per 100,000 people (total: 20)
> Population: 387,455

47. Shreveport-Bossier City, LA
> Change in daily avg. new COVID-19 cases week over week: +7.0 per 100,000 people
> Avg. new daily cases June 23-29: 15.0 per 100,000 people (rank: 82 out of 383 metro areas)
> Avg. new daily cases June 16-22: 8.0 per 100,000 people (rank: 110 out of 383 metro areas)
> Cumulative COVID-19 cases as of June 29: 1,105 per 100,000 people (total: 4,437)
> Cumulative COVID-19 deaths as of June 29: 69 per 100,000 people (total: 279)
> Population: 436,341
[in-text-ad-2]

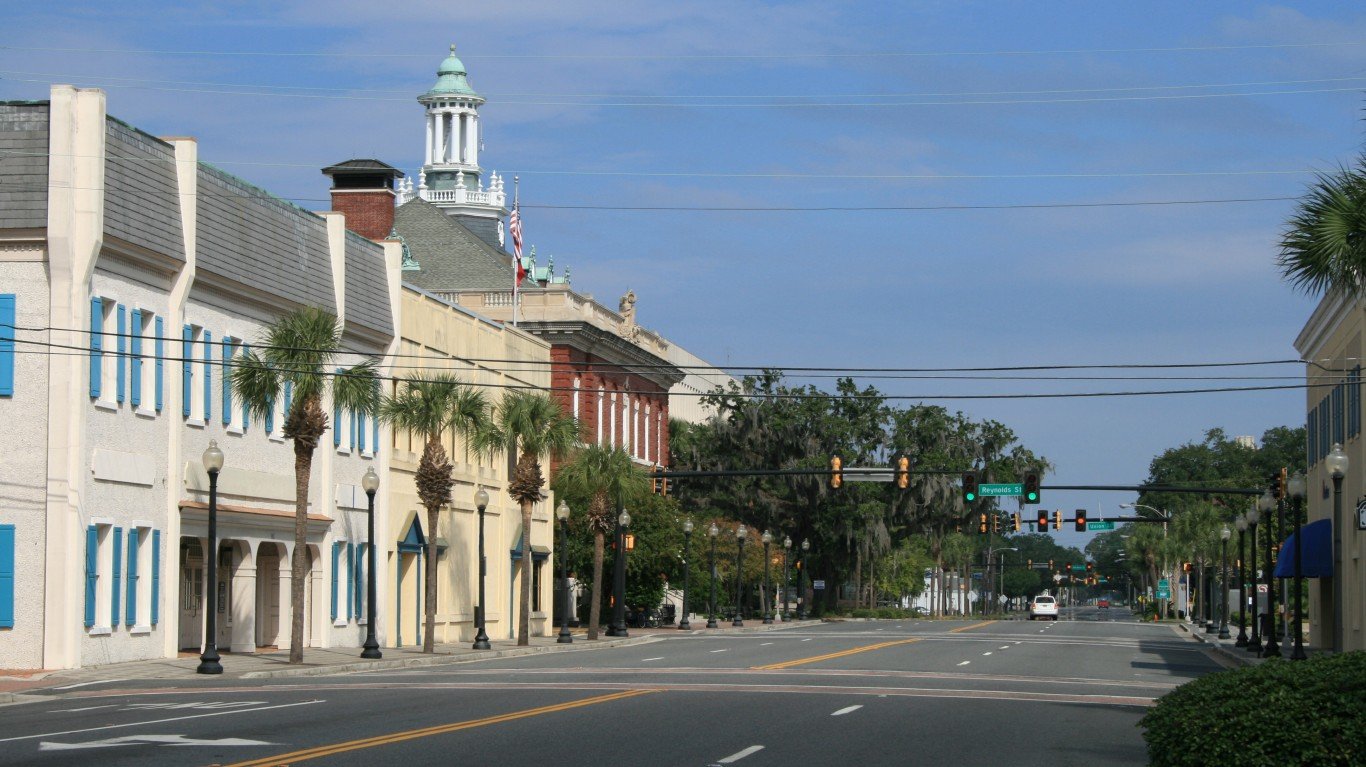
46. Savannah, GA
> Change in daily avg. new COVID-19 cases week over week: +7.0 per 100,000 people
> Avg. new daily cases June 23-29: 12.8 per 100,000 people (rank: 102 out of 383 metro areas)
> Avg. new daily cases June 16-22: 5.8 per 100,000 people (rank: 153 out of 383 metro areas)
> Cumulative COVID-19 cases as of June 29: 364 per 100,000 people (total: 1,388)
> Cumulative COVID-19 deaths as of June 29: 11 per 100,000 people (total: 43)
> Population: 389,494

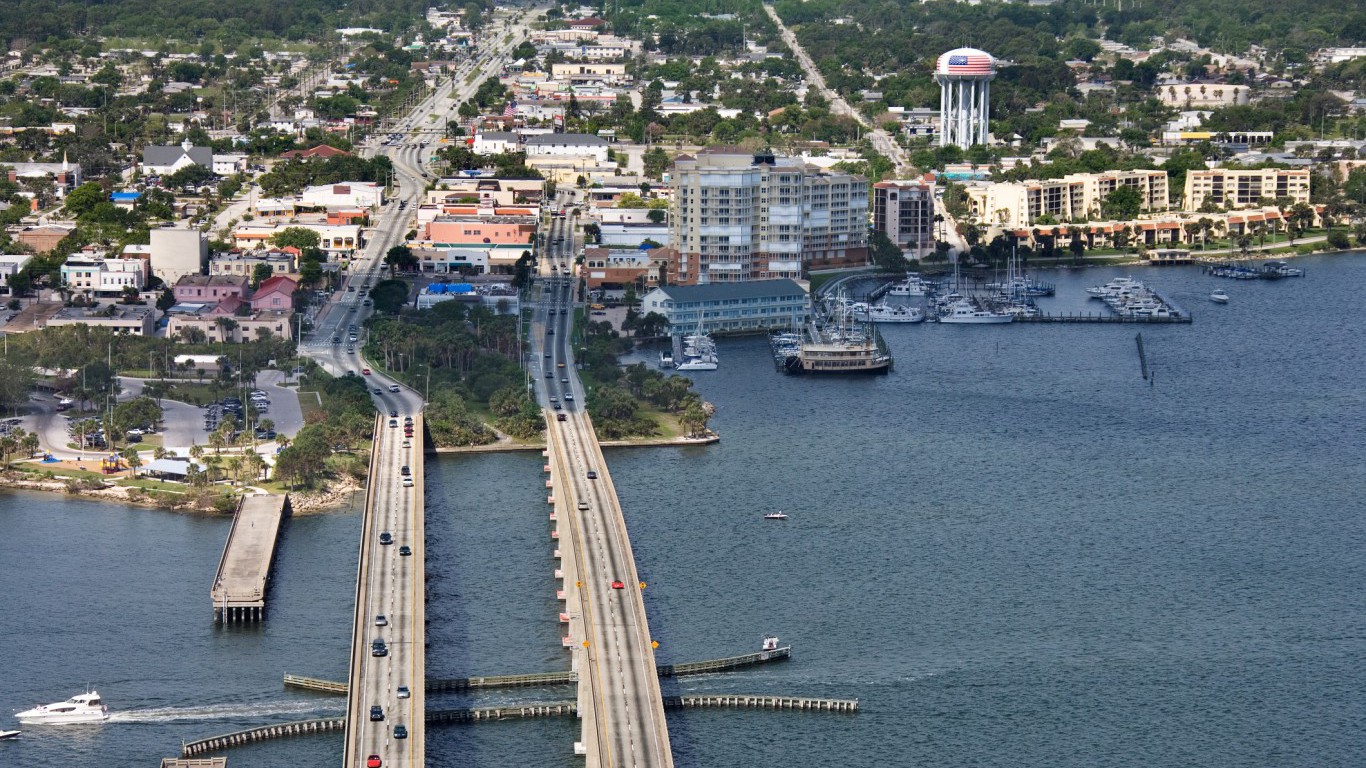
45. Cape Coral-Fort Myers, FL
> Change in daily avg. new COVID-19 cases week over week: +7.0 per 100,000 people
> Avg. new daily cases June 23-29: 23.1 per 100,000 people (rank: 33 out of 383 metro areas)
> Avg. new daily cases June 16-22: 16.1 per 100,000 people (rank: 38 out of 383 metro areas)
> Cumulative COVID-19 cases as of June 29: 746 per 100,000 people (total: 5,363)
> Cumulative COVID-19 deaths as of June 29: 22 per 100,000 people (total: 156)
> Population: 754,610
[in-text-ad]

44. Prescott Valley-Prescott, AZ
> Change in daily avg. new COVID-19 cases week over week: +7.1 per 100,000 people
> Avg. new daily cases June 23-29: 11.3 per 100,000 people (rank: 115 out of 383 metro areas)
> Avg. new daily cases June 16-22: 4.2 per 100,000 people (rank: 198 out of 383 metro areas)
> Cumulative COVID-19 cases as of June 29: 336 per 100,000 people (total: 755)
> Cumulative COVID-19 deaths as of June 29: 4 per 100,000 people (total: 8)
> Population: 231,993
[recirclink id=715424]

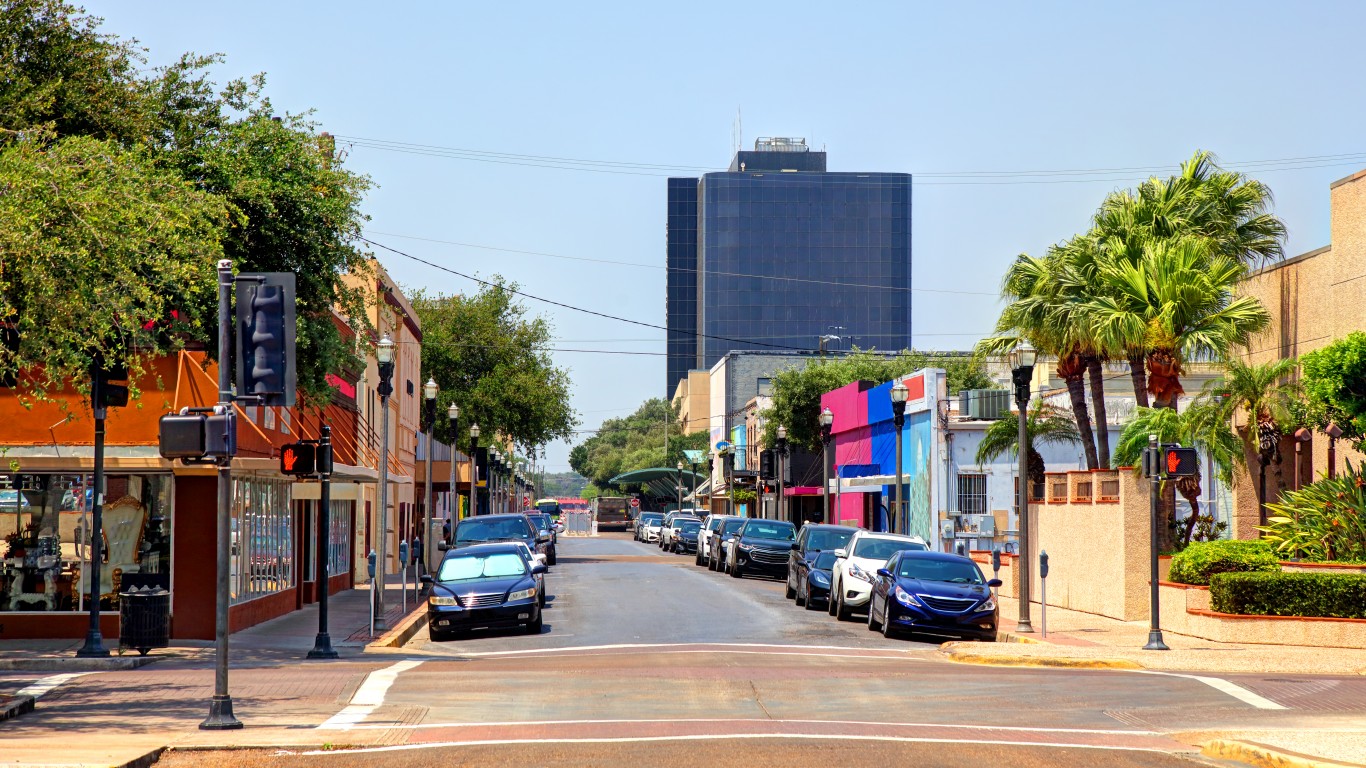
43. Odessa, TX
> Change in daily avg. new COVID-19 cases week over week: +7.3 per 100,000 people
> Avg. new daily cases June 23-29: 14.0 per 100,000 people (rank: 92 out of 383 metro areas)
> Avg. new daily cases June 16-22: 6.8 per 100,000 people (rank: 129 out of 383 metro areas)
> Cumulative COVID-19 cases as of June 29: 320 per 100,000 people (total: 506)
> Cumulative COVID-19 deaths as of June 29: 4 per 100,000 people (total: 7)
> Population: 162,124

42. Laredo, TX
> Change in daily avg. new COVID-19 cases week over week: +7.3 per 100,000 people
> Avg. new daily cases June 23-29: 16.7 per 100,000 people (rank: 68 out of 383 metro areas)
> Avg. new daily cases June 16-22: 9.3 per 100,000 people (rank: 92 out of 383 metro areas)
> Cumulative COVID-19 cases as of June 29: 536 per 100,000 people (total: 1,457)
> Cumulative COVID-19 deaths as of June 29: 9 per 100,000 people (total: 25)
> Population: 275,910
[in-text-ad-2]

41. Ames, IA
> Change in daily avg. new COVID-19 cases week over week: +7.4 per 100,000 people
> Avg. new daily cases June 23-29: 28.9 per 100,000 people (rank: 15 out of 383 metro areas)
> Avg. new daily cases June 16-22: 21.6 per 100,000 people (rank: 14 out of 383 metro areas)
> Cumulative COVID-19 cases as of June 29: 659 per 100,000 people (total: 813)
> Cumulative COVID-19 deaths as of June 29: 3 per 100,000 people (total: 4)
> Population: 98,105
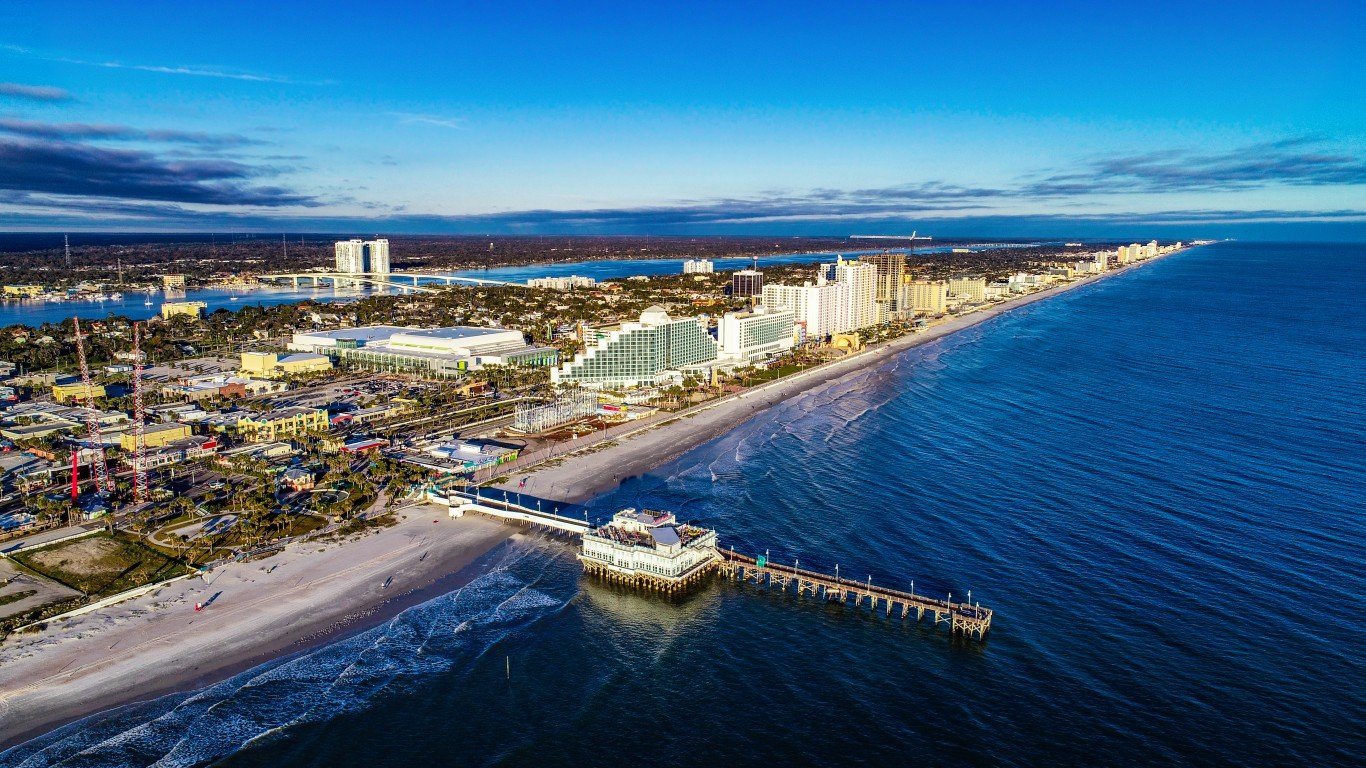
40. Deltona-Daytona Beach-Ormond Beach, FL
> Change in daily avg. new COVID-19 cases week over week: +7.5 per 100,000 people
> Avg. new daily cases June 23-29: 12.9 per 100,000 people (rank: 100 out of 383 metro areas)
> Avg. new daily cases June 16-22: 5.4 per 100,000 people (rank: 164 out of 383 metro areas)
> Cumulative COVID-19 cases as of June 29: 366 per 100,000 people (total: 2,326)
> Cumulative COVID-19 deaths as of June 29: 10 per 100,000 people (total: 61)
> Population: 659,605
[in-text-ad]
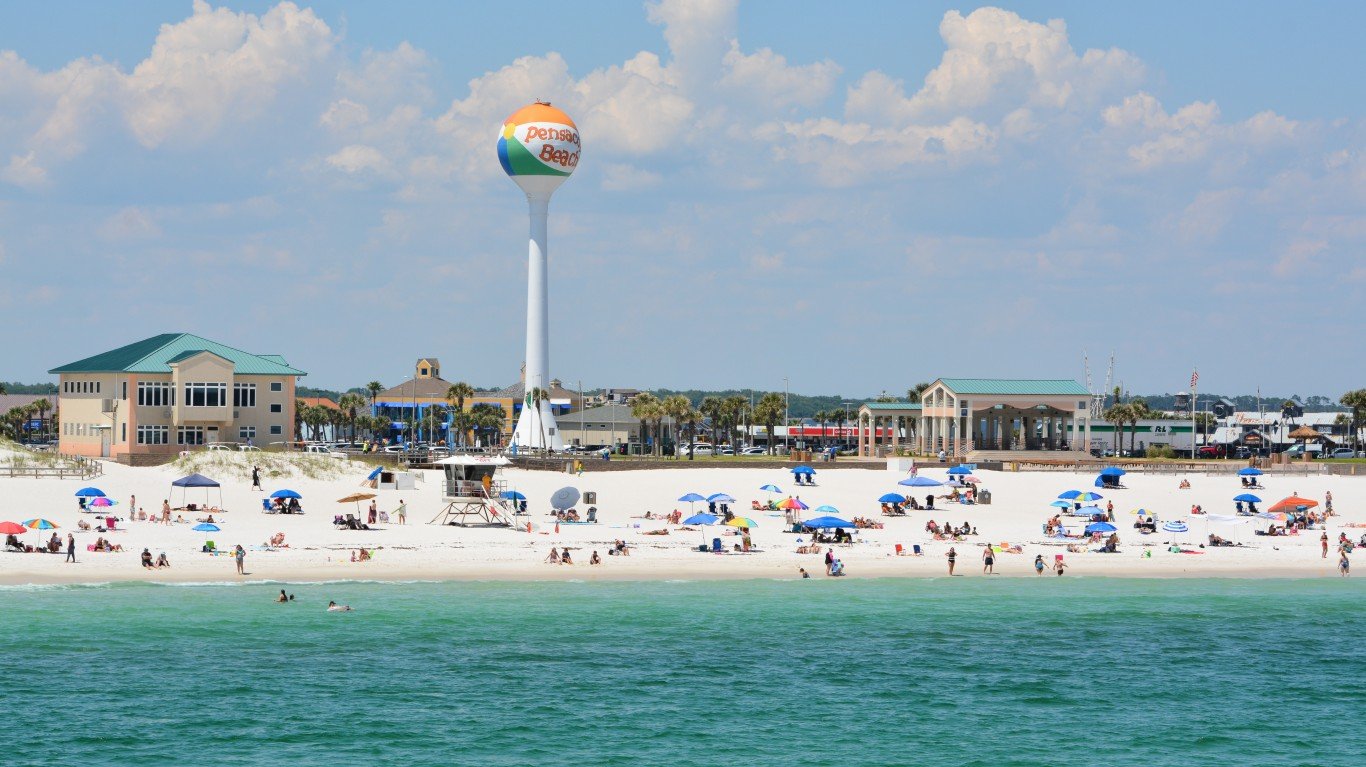
39. Pensacola-Ferry Pass-Brent, FL
> Change in daily avg. new COVID-19 cases week over week: +7.5 per 100,000 people
> Avg. new daily cases June 23-29: 14.0 per 100,000 people (rank: 91 out of 383 metro areas)
> Avg. new daily cases June 16-22: 6.5 per 100,000 people (rank: 136 out of 383 metro areas)
> Cumulative COVID-19 cases as of June 29: 453 per 100,000 people (total: 2,184)
> Cumulative COVID-19 deaths as of June 29: 11 per 100,000 people (total: 53)
> Population: 494,883
[recirclink id=715663]

38. El Paso, TX
> Change in daily avg. new COVID-19 cases week over week: +7.5 per 100,000 people
> Avg. new daily cases June 23-29: 16.5 per 100,000 people (rank: 70 out of 383 metro areas)
> Avg. new daily cases June 16-22: 9.0 per 100,000 people (rank: 101 out of 383 metro areas)
> Cumulative COVID-19 cases as of June 29: 686 per 100,000 people (total: 5,745)
> Cumulative COVID-19 deaths as of June 29: 15 per 100,000 people (total: 128)
> Population: 844,723
37. Dubuque, IA
> Change in daily avg. new COVID-19 cases week over week: +7.8 per 100,000 people
> Avg. new daily cases June 23-29: 11.4 per 100,000 people (rank: 113 out of 383 metro areas)
> Avg. new daily cases June 16-22: 3.6 per 100,000 people (rank: 221 out of 383 metro areas)
> Cumulative COVID-19 cases as of June 29: 518 per 100,000 people (total: 501)
> Cumulative COVID-19 deaths as of June 29: 23 per 100,000 people (total: 22)
> Population: 96,854
[in-text-ad-2]

36. Brownsville-Harlingen, TX
> Change in daily avg. new COVID-19 cases week over week: +8.0 per 100,000 people
> Avg. new daily cases June 23-29: 19.7 per 100,000 people (rank: 49 out of 383 metro areas)
> Avg. new daily cases June 16-22: 11.7 per 100,000 people (rank: 60 out of 383 metro areas)
> Cumulative COVID-19 cases as of June 29: 518 per 100,000 people (total: 2,183)
> Cumulative COVID-19 deaths as of June 29: 13 per 100,000 people (total: 55)
> Population: 423,908

35. Myrtle Beach-Conway-North Myrtle Beach, SC-NC
> Change in daily avg. new COVID-19 cases week over week: +8.1 per 100,000 people
> Avg. new daily cases June 23-29: 35.0 per 100,000 people (rank: 7 out of 383 metro areas)
> Avg. new daily cases June 16-22: 26.9 per 100,000 people (rank: 9 out of 383 metro areas)
> Cumulative COVID-19 cases as of June 29: 815 per 100,000 people (total: 3,651)
> Cumulative COVID-19 deaths as of June 29: 11 per 100,000 people (total: 49)
> Population: 480,891
[in-text-ad]

34. Lake Havasu City-Kingman, AZ
> Change in daily avg. new COVID-19 cases week over week: +8.2 per 100,000 people
> Avg. new daily cases June 23-29: 16.2 per 100,000 people (rank: 72 out of 383 metro areas)
> Avg. new daily cases June 16-22: 8.0 per 100,000 people (rank: 109 out of 383 metro areas)
> Cumulative COVID-19 cases as of June 29: 499 per 100,000 people (total: 1,028)
> Cumulative COVID-19 deaths as of June 29: 41 per 100,000 people (total: 85)
> Population: 209,550
[recirclink id=715584]
33. Joplin, MO
> Change in daily avg. new COVID-19 cases week over week: +8.5 per 100,000 people
> Avg. new daily cases June 23-29: 25.2 per 100,000 people (rank: 26 out of 383 metro areas)
> Avg. new daily cases June 16-22: 16.6 per 100,000 people (rank: 33 out of 383 metro areas)
> Cumulative COVID-19 cases as of June 29: 397 per 100,000 people (total: 704)
> Cumulative COVID-19 deaths as of June 29: 2 per 100,000 people (total: 3)
> Population: 178,902
32. Palm Bay-Melbourne-Titusville, FL
> Change in daily avg. new COVID-19 cases week over week: +8.6 per 100,000 people
> Avg. new daily cases June 23-29: 14.3 per 100,000 people (rank: 87 out of 383 metro areas)
> Avg. new daily cases June 16-22: 5.7 per 100,000 people (rank: 156 out of 383 metro areas)
> Cumulative COVID-19 cases as of June 29: 297 per 100,000 people (total: 1,716)
> Cumulative COVID-19 deaths as of June 29: 3 per 100,000 people (total: 17)
> Population: 596,849
[in-text-ad-2]

31. San Antonio-New Braunfels, TX
> Change in daily avg. new COVID-19 cases week over week: +8.7 per 100,000 people
> Avg. new daily cases June 23-29: 20.4 per 100,000 people (rank: 43 out of 383 metro areas)
> Avg. new daily cases June 16-22: 11.8 per 100,000 people (rank: 58 out of 383 metro areas)
> Cumulative COVID-19 cases as of June 29: 485 per 100,000 people (total: 11,762)
> Cumulative COVID-19 deaths as of June 29: 5 per 100,000 people (total: 126)
> Population: 3.5 million

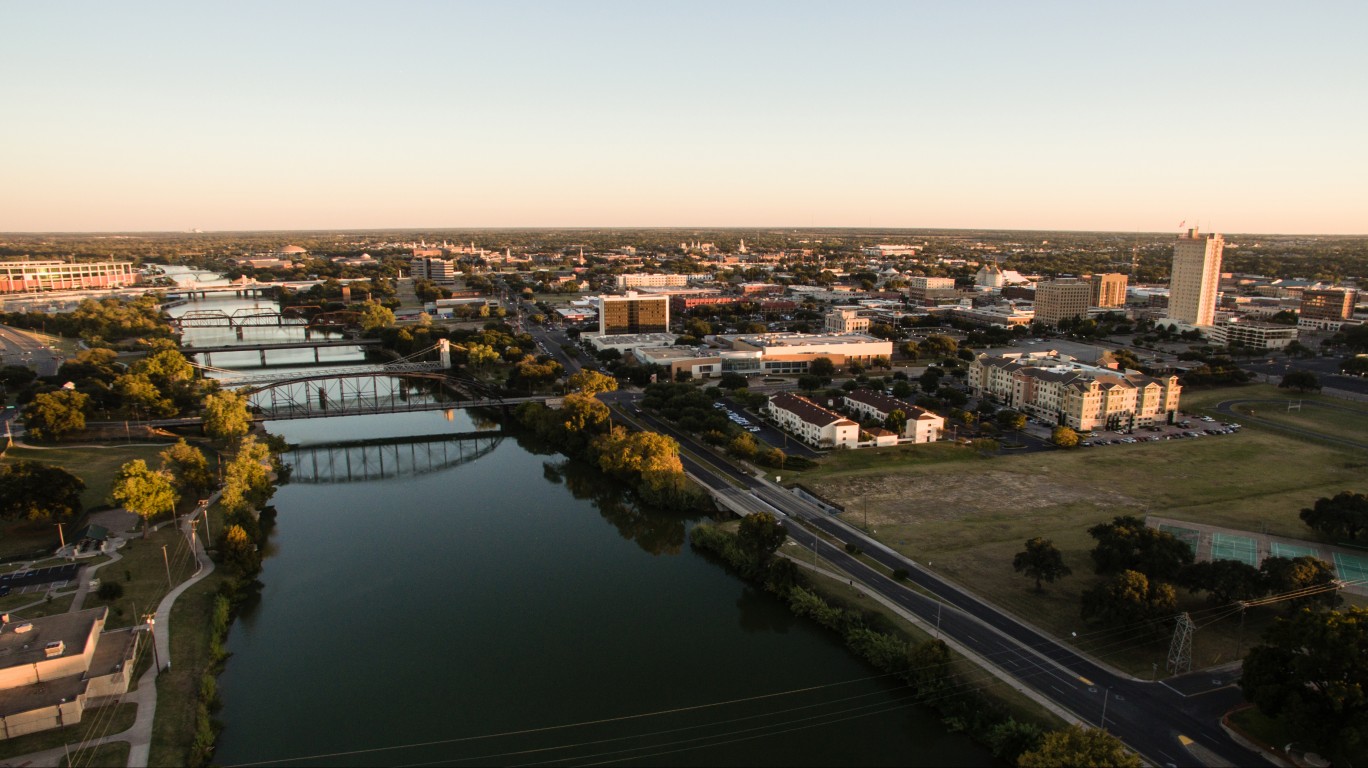
30. Austin-Round Rock-Georgetown, TX
> Change in daily avg. new COVID-19 cases week over week: +8.7 per 100,000 people
> Avg. new daily cases June 23-29: 24.8 per 100,000 people (rank: 27 out of 383 metro areas)
> Avg. new daily cases June 16-22: 16.1 per 100,000 people (rank: 37 out of 383 metro areas)
> Cumulative COVID-19 cases as of June 29: 672 per 100,000 people (total: 13,837)
> Cumulative COVID-19 deaths as of June 29: 8 per 100,000 people (total: 166)
> Population: 2.2 million
[in-text-ad]

29. Hattiesburg, MS
> Change in daily avg. new COVID-19 cases week over week: +8.9 per 100,000 people
> Avg. new daily cases June 23-29: 14.8 per 100,000 people (rank: 84 out of 383 metro areas)
> Avg. new daily cases June 16-22: 5.9 per 100,000 people (rank: 149 out of 383 metro areas)
> Cumulative COVID-19 cases as of June 29: 898 per 100,000 people (total: 1,507)
> Cumulative COVID-19 deaths as of June 29: 35 per 100,000 people (total: 58)
> Population: 149,119
[recirclink id=716181]

28. Lake Charles, LA
> Change in daily avg. new COVID-19 cases week over week: +9.0 per 100,000 people
> Avg. new daily cases June 23-29: 19.2 per 100,000 people (rank: 57 out of 383 metro areas)
> Avg. new daily cases June 16-22: 10.2 per 100,000 people (rank: 76 out of 383 metro areas)
> Cumulative COVID-19 cases as of June 29: 626 per 100,000 people (total: 1,297)
> Cumulative COVID-19 deaths as of June 29: 26 per 100,000 people (total: 54)
> Population: 209,548

27. Sebastian-Vero Beach, FL
> Change in daily avg. new COVID-19 cases week over week: +9.0 per 100,000 people
> Avg. new daily cases June 23-29: 21.7 per 100,000 people (rank: 38 out of 383 metro areas)
> Avg. new daily cases June 16-22: 12.6 per 100,000 people (rank: 52 out of 383 metro areas)
> Cumulative COVID-19 cases as of June 29: 454 per 100,000 people (total: 686)
> Cumulative COVID-19 deaths as of June 29: 11 per 100,000 people (total: 16)
> Population: 157,413
[in-text-ad-2]

26. Gadsden, AL
> Change in daily avg. new COVID-19 cases week over week: +9.2 per 100,000 people
> Avg. new daily cases June 23-29: 19.3 per 100,000 people (rank: 54 out of 383 metro areas)
> Avg. new daily cases June 16-22: 10.2 per 100,000 people (rank: 78 out of 383 metro areas)
> Cumulative COVID-19 cases as of June 29: 580 per 100,000 people (total: 597)
> Cumulative COVID-19 deaths as of June 29: 13 per 100,000 people (total: 13)
> Population: 102,501
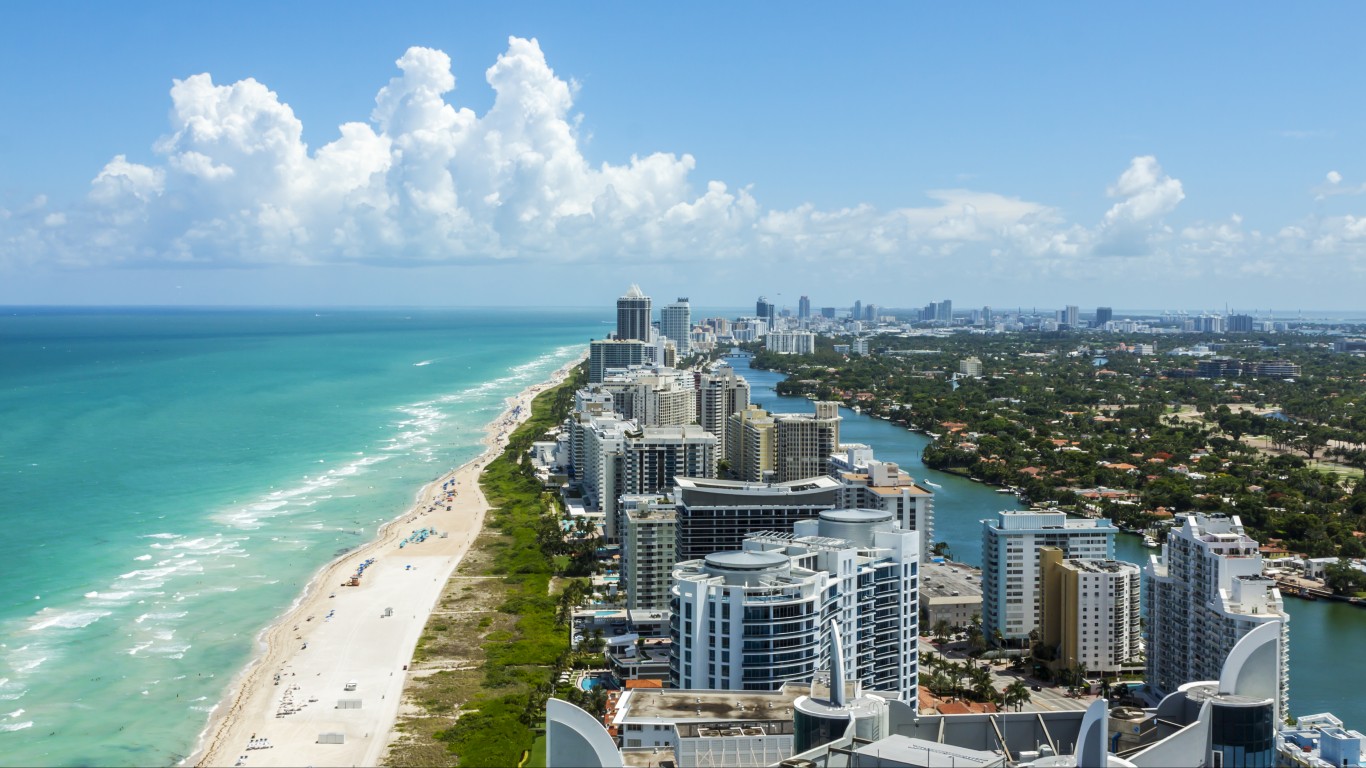
25. Miami-Fort Lauderdale-Pompano Beach, FL
> Change in daily avg. new COVID-19 cases week over week: +9.7 per 100,000 people
> Avg. new daily cases June 23-29: 26.6 per 100,000 people (rank: 21 out of 383 metro areas)
> Avg. new daily cases June 16-22: 16.9 per 100,000 people (rank: 32 out of 383 metro areas)
> Cumulative COVID-19 cases as of June 29: 1,054 per 100,000 people (total: 63,978)
> Cumulative COVID-19 deaths as of June 29: 31 per 100,000 people (total: 1,860)
> Population: 6.2 million
[in-text-ad]
24. North Port-Sarasota-Bradenton, FL
> Change in daily avg. new COVID-19 cases week over week: +10.0 per 100,000 people
> Avg. new daily cases June 23-29: 19.7 per 100,000 people (rank: 50 out of 383 metro areas)
> Avg. new daily cases June 16-22: 9.6 per 100,000 people (rank: 83 out of 383 metro areas)
> Cumulative COVID-19 cases as of June 29: 542 per 100,000 people (total: 4,257)
> Cumulative COVID-19 deaths as of June 29: 29 per 100,000 people (total: 226)
> Population: 821,573
[recirclink id=716251]

23. Houston-The Woodlands-Sugar Land, TX
> Change in daily avg. new COVID-19 cases week over week: +10.2 per 100,000 people
> Avg. new daily cases June 23-29: 21.5 per 100,000 people (rank: 40 out of 383 metro areas)
> Avg. new daily cases June 16-22: 11.2 per 100,000 people (rank: 63 out of 383 metro areas)
> Cumulative COVID-19 cases as of June 29: 603 per 100,000 people (total: 40,861)
> Cumulative COVID-19 deaths as of June 29: 8 per 100,000 people (total: 526)
> Population: 7.0 million
22. Waco, TX
> Change in daily avg. new COVID-19 cases week over week: +10.6 per 100,000 people
> Avg. new daily cases June 23-29: 16.5 per 100,000 people (rank: 69 out of 383 metro areas)
> Avg. new daily cases June 16-22: 5.9 per 100,000 people (rank: 148 out of 383 metro areas)
> Cumulative COVID-19 cases as of June 29: 291 per 100,000 people (total: 772)
> Cumulative COVID-19 deaths as of June 29: 2 per 100,000 people (total: 6)
> Population: 270,566
[in-text-ad-2]

21. Lafayette, LA
> Change in daily avg. new COVID-19 cases week over week: +10.6 per 100,000 people
> Avg. new daily cases June 23-29: 28.5 per 100,000 people (rank: 17 out of 383 metro areas)
> Avg. new daily cases June 16-22: 17.9 per 100,000 people (rank: 28 out of 383 metro areas)
> Cumulative COVID-19 cases as of June 29: 921 per 100,000 people (total: 4,504)
> Cumulative COVID-19 deaths as of June 29: 31 per 100,000 people (total: 154)
> Population: 489,364

20. Flagstaff, AZ
> Change in daily avg. new COVID-19 cases week over week: +10.6 per 100,000 people
> Avg. new daily cases June 23-29: 24.7 per 100,000 people (rank: 28 out of 383 metro areas)
> Avg. new daily cases June 16-22: 14.1 per 100,000 people (rank: 47 out of 383 metro areas)
> Cumulative COVID-19 cases as of June 29: 1,319 per 100,000 people (total: 1,850)
> Cumulative COVID-19 deaths as of June 29: 66 per 100,000 people (total: 92)
> Population: 142,854
[in-text-ad]
19. McAllen-Edinburg-Mission, TX
> Change in daily avg. new COVID-19 cases week over week: +11.2 per 100,000 people
> Avg. new daily cases June 23-29: 20.0 per 100,000 people (rank: 48 out of 383 metro areas)
> Avg. new daily cases June 16-22: 8.9 per 100,000 people (rank: 102 out of 383 metro areas)
> Cumulative COVID-19 cases as of June 29: 388 per 100,000 people (total: 3,294)
> Cumulative COVID-19 deaths as of June 29: 4 per 100,000 people (total: 32)
> Population: 865,939
[recirclink id=713288]

18. Midland, TX
> Change in daily avg. new COVID-19 cases week over week: +11.6 per 100,000 people
> Avg. new daily cases June 23-29: 19.5 per 100,000 people (rank: 51 out of 383 metro areas)
> Avg. new daily cases June 16-22: 7.9 per 100,000 people (rank: 112 out of 383 metro areas)
> Cumulative COVID-19 cases as of June 29: 340 per 100,000 people (total: 577)
> Cumulative COVID-19 deaths as of June 29: 9 per 100,000 people (total: 15)
> Population: 177,218

17. Lakeland-Winter Haven, FL
> Change in daily avg. new COVID-19 cases week over week: +12.4 per 100,000 people
> Avg. new daily cases June 23-29: 22.7 per 100,000 people (rank: 34 out of 383 metro areas)
> Avg. new daily cases June 16-22: 10.3 per 100,000 people (rank: 74 out of 383 metro areas)
> Cumulative COVID-19 cases as of June 29: 551 per 100,000 people (total: 3,682)
> Cumulative COVID-19 deaths as of June 29: 14 per 100,000 people (total: 93)
> Population: 708,009
[in-text-ad-2]

16. Phoenix-Mesa-Chandler, AZ
> Change in daily avg. new COVID-19 cases week over week: +12.9 per 100,000 people
> Avg. new daily cases June 23-29: 44.5 per 100,000 people (rank: 5 out of 383 metro areas)
> Avg. new daily cases June 16-22: 31.5 per 100,000 people (rank: 8 out of 383 metro areas)
> Cumulative COVID-19 cases as of June 29: 1,039 per 100,000 people (total: 48,560)
> Cumulative COVID-19 deaths as of June 29: 17 per 100,000 people (total: 809)
> Population: 4.9 million

15. Yuma, AZ
> Change in daily avg. new COVID-19 cases week over week: +13.4 per 100,000 people
> Avg. new daily cases June 23-29: 95.1 per 100,000 people (rank: 1 out of 383 metro areas)
> Avg. new daily cases June 16-22: 81.7 per 100,000 people (rank: 1 out of 383 metro areas)
> Cumulative COVID-19 cases as of June 29: 2,830 per 100,000 people (total: 5,882)
> Cumulative COVID-19 deaths as of June 29: 38 per 100,000 people (total: 80)
> Population: 212,128
[in-text-ad]

14. Iowa City, IA
> Change in daily avg. new COVID-19 cases week over week: +13.7 per 100,000 people
> Avg. new daily cases June 23-29: 20.1 per 100,000 people (rank: 47 out of 383 metro areas)
> Avg. new daily cases June 16-22: 6.5 per 100,000 people (rank: 137 out of 383 metro areas)
> Cumulative COVID-19 cases as of June 29: 782 per 100,000 people (total: 1,323)
> Cumulative COVID-19 deaths as of June 29: 10 per 100,000 people (total: 17)
> Population: 173,401
[recirclink id=715424]

13. Boise City, ID
> Change in daily avg. new COVID-19 cases week over week: +14.2 per 100,000 people
> Avg. new daily cases June 23-29: 18.4 per 100,000 people (rank: 58 out of 383 metro areas)
> Avg. new daily cases June 16-22: 4.1 per 100,000 people (rank: 201 out of 383 metro areas)
> Cumulative COVID-19 cases as of June 29: 373 per 100,000 people (total: 2,589)
> Cumulative COVID-19 deaths as of June 29: 4 per 100,000 people (total: 29)
> Population: 732,257

12. Jackson, MS
> Change in daily avg. new COVID-19 cases week over week: +14.3 per 100,000 people
> Avg. new daily cases June 23-29: 23.3 per 100,000 people (rank: 32 out of 383 metro areas)
> Avg. new daily cases June 16-22: 9.0 per 100,000 people (rank: 100 out of 383 metro areas)
> Cumulative COVID-19 cases as of June 29: 963 per 100,000 people (total: 5,762)
> Cumulative COVID-19 deaths as of June 29: 24 per 100,000 people (total: 144)
> Population: 583,080
[in-text-ad-2]

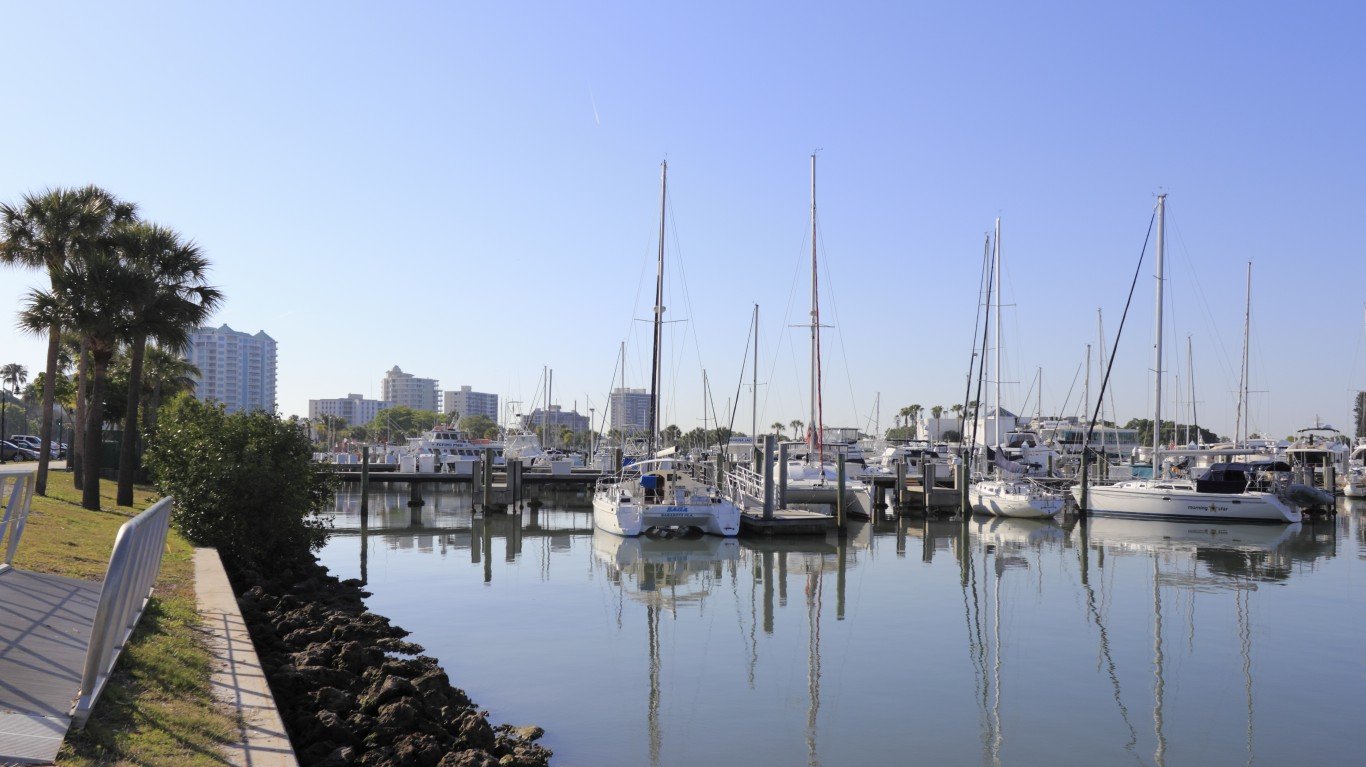
11. Tampa-St. Petersburg-Clearwater, FL
> Change in daily avg. new COVID-19 cases week over week: +14.4 per 100,000 people
> Avg. new daily cases June 23-29: 28.8 per 100,000 people (rank: 16 out of 383 metro areas)
> Avg. new daily cases June 16-22: 14.4 per 100,000 people (rank: 45 out of 383 metro areas)
> Cumulative COVID-19 cases as of June 29: 622 per 100,000 people (total: 18,853)
> Cumulative COVID-19 deaths as of June 29: 10 per 100,000 people (total: 311)
> Population: 3.1 million

10. Jacksonville, FL
> Change in daily avg. new COVID-19 cases week over week: +14.7 per 100,000 people
> Avg. new daily cases June 23-29: 22.4 per 100,000 people (rank: 35 out of 383 metro areas)
> Avg. new daily cases June 16-22: 7.7 per 100,000 people (rank: 115 out of 383 metro areas)
> Cumulative COVID-19 cases as of June 29: 518 per 100,000 people (total: 7,648)
> Cumulative COVID-19 deaths as of June 29: 7 per 100,000 people (total: 110)
> Population: 1.5 million
[in-text-ad]
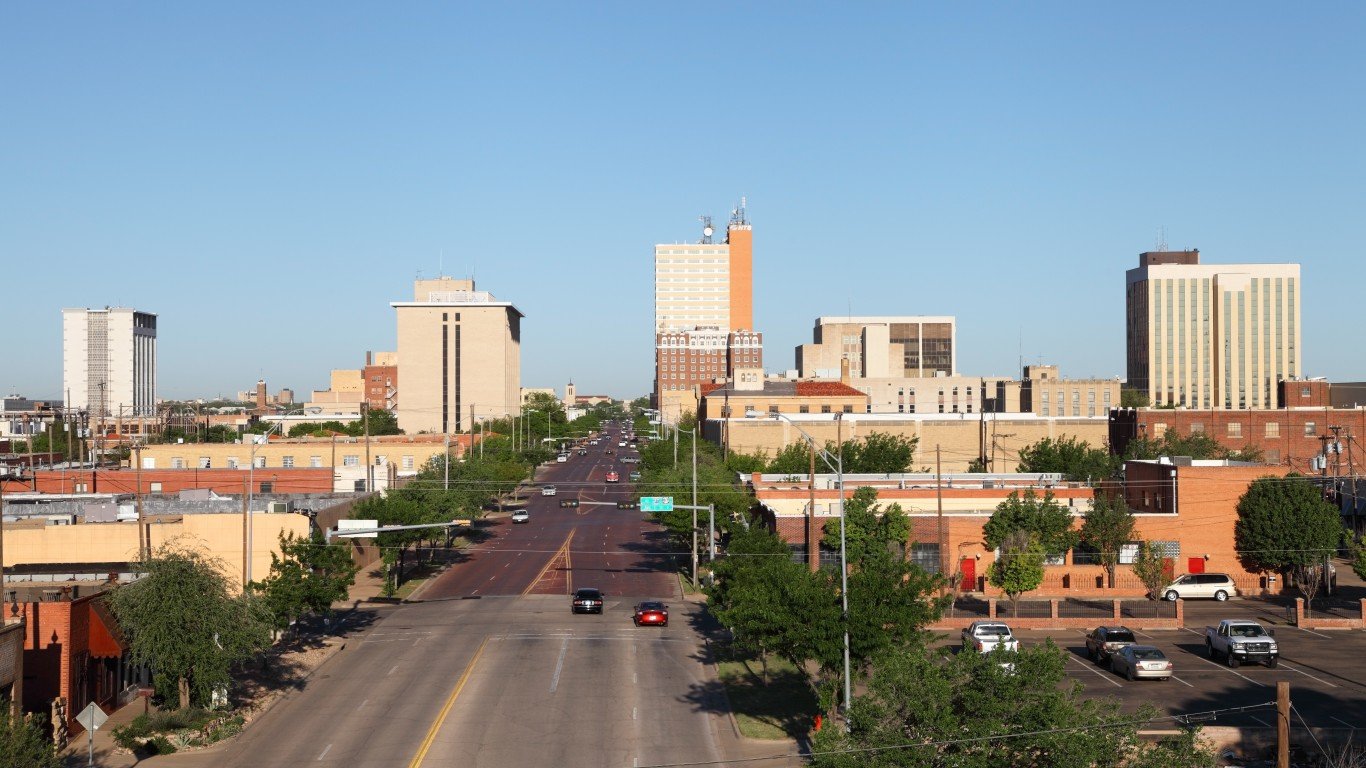
9. Lubbock, TX
> Change in daily avg. new COVID-19 cases week over week: +14.8 per 100,000 people
> Avg. new daily cases June 23-29: 30.0 per 100,000 people (rank: 13 out of 383 metro areas)
> Avg. new daily cases June 16-22: 15.2 per 100,000 people (rank: 42 out of 383 metro areas)
> Cumulative COVID-19 cases as of June 29: 666 per 100,000 people (total: 2,084)
> Cumulative COVID-19 deaths as of June 29: 17 per 100,000 people (total: 53)
> Population: 319,995
[recirclink id=715663]

8. Mankato, MN
> Change in daily avg. new COVID-19 cases week over week: +15.1 per 100,000 people
> Avg. new daily cases June 23-29: 20.4 per 100,000 people (rank: 44 out of 383 metro areas)
> Avg. new daily cases June 16-22: 5.3 per 100,000 people (rank: 170 out of 383 metro areas)
> Cumulative COVID-19 cases as of June 29: 512 per 100,000 people (total: 513)
> Cumulative COVID-19 deaths as of June 29: 14 per 100,000 people (total: 14)
> Population: 101,647

7. Twin Falls, ID
> Change in daily avg. new COVID-19 cases week over week: +15.8 per 100,000 people
> Avg. new daily cases June 23-29: 20.4 per 100,000 people (rank: 45 out of 383 metro areas)
> Avg. new daily cases June 16-22: 4.5 per 100,000 people (rank: 184 out of 383 metro areas)
> Cumulative COVID-19 cases as of June 29: 731 per 100,000 people (total: 783)
> Cumulative COVID-19 deaths as of June 29: 27 per 100,000 people (total: 29)
> Population: 109,264
[in-text-ad-2]

6. Orlando-Kissimmee-Sanford, FL
> Change in daily avg. new COVID-19 cases week over week: +18.1 per 100,000 people
> Avg. new daily cases June 23-29: 31.2 per 100,000 people (rank: 10 out of 383 metro areas)
> Avg. new daily cases June 16-22: 13.1 per 100,000 people (rank: 51 out of 383 metro areas)
> Cumulative COVID-19 cases as of June 29: 639 per 100,000 people (total: 15,662)
> Cumulative COVID-19 deaths as of June 29: 5 per 100,000 people (total: 118)
> Population: 2.6 million

5. Charleston-North Charleston, SC
> Change in daily avg. new COVID-19 cases week over week: +18.3 per 100,000 people
> Avg. new daily cases June 23-29: 34.6 per 100,000 people (rank: 8 out of 383 metro areas)
> Avg. new daily cases June 16-22: 16.3 per 100,000 people (rank: 35 out of 383 metro areas)
> Cumulative COVID-19 cases as of June 29: 696 per 100,000 people (total: 5,288)
> Cumulative COVID-19 deaths as of June 29: 6 per 100,000 people (total: 47)
> Population: 787,643
[in-text-ad]

4. Victoria, TX
> Change in daily avg. new COVID-19 cases week over week: +20.0 per 100,000 people
> Avg. new daily cases June 23-29: 25.8 per 100,000 people (rank: 23 out of 383 metro areas)
> Avg. new daily cases June 16-22: 5.8 per 100,000 people (rank: 151 out of 383 metro areas)
> Cumulative COVID-19 cases as of June 29: 494 per 100,000 people (total: 492)
> Cumulative COVID-19 deaths as of June 29: 8 per 100,000 people (total: 8)
> Population: 99,047
[recirclink id=716251]
3. Brunswick, GA
> Change in daily avg. new COVID-19 cases week over week: +21.0 per 100,000 people
> Avg. new daily cases June 23-29: 31.2 per 100,000 people (rank: 11 out of 383 metro areas)
> Avg. new daily cases June 16-22: 10.2 per 100,000 people (rank: 77 out of 383 metro areas)
> Cumulative COVID-19 cases as of June 29: 568 per 100,000 people (total: 663)
> Cumulative COVID-19 deaths as of June 29: 6 per 100,000 people (total: 7)
> Population: 116,864

2. Corpus Christi, TX
> Change in daily avg. new COVID-19 cases week over week: +21.5 per 100,000 people
> Avg. new daily cases June 23-29: 27.9 per 100,000 people (rank: 18 out of 383 metro areas)
> Avg. new daily cases June 16-22: 6.4 per 100,000 people (rank: 140 out of 383 metro areas)
> Cumulative COVID-19 cases as of June 29: 473 per 100,000 people (total: 2,024)
> Cumulative COVID-19 deaths as of June 29: 2 per 100,000 people (total: 7)
> Population: 452,927
[in-text-ad-2]

1. Hanford-Corcoran, CA
> Change in daily avg. new COVID-19 cases week over week: +57.4 per 100,000 people
> Avg. new daily cases June 23-29: 82.5 per 100,000 people (rank: 2 out of 383 metro areas)
> Avg. new daily cases June 16-22: 25.0 per 100,000 people (rank: 11 out of 383 metro areas)
> Cumulative COVID-19 cases as of June 29: 1,519 per 100,000 people (total: 2,280)
> Cumulative COVID-19 deaths as of June 29: 19 per 100,000 people (total: 28)
> Population: 151,366
Contact [email protected] for any questions or corrections.