Microsoft Beat Again. Its Stock Is Still Lower Than a Year Ago
Microsoft keeps beating earnings estimates, yet its stock trades below where it stood a year ago. The reason why tells you something important about what the market is actually betting on right now.

Microsoft (NASDAQ:MSFT | MSFT Price Prediction) exceeded Wall Street estimates again on October 28, 2026. Even so, shares at $523.71 are 2.59% lower than a year ago.
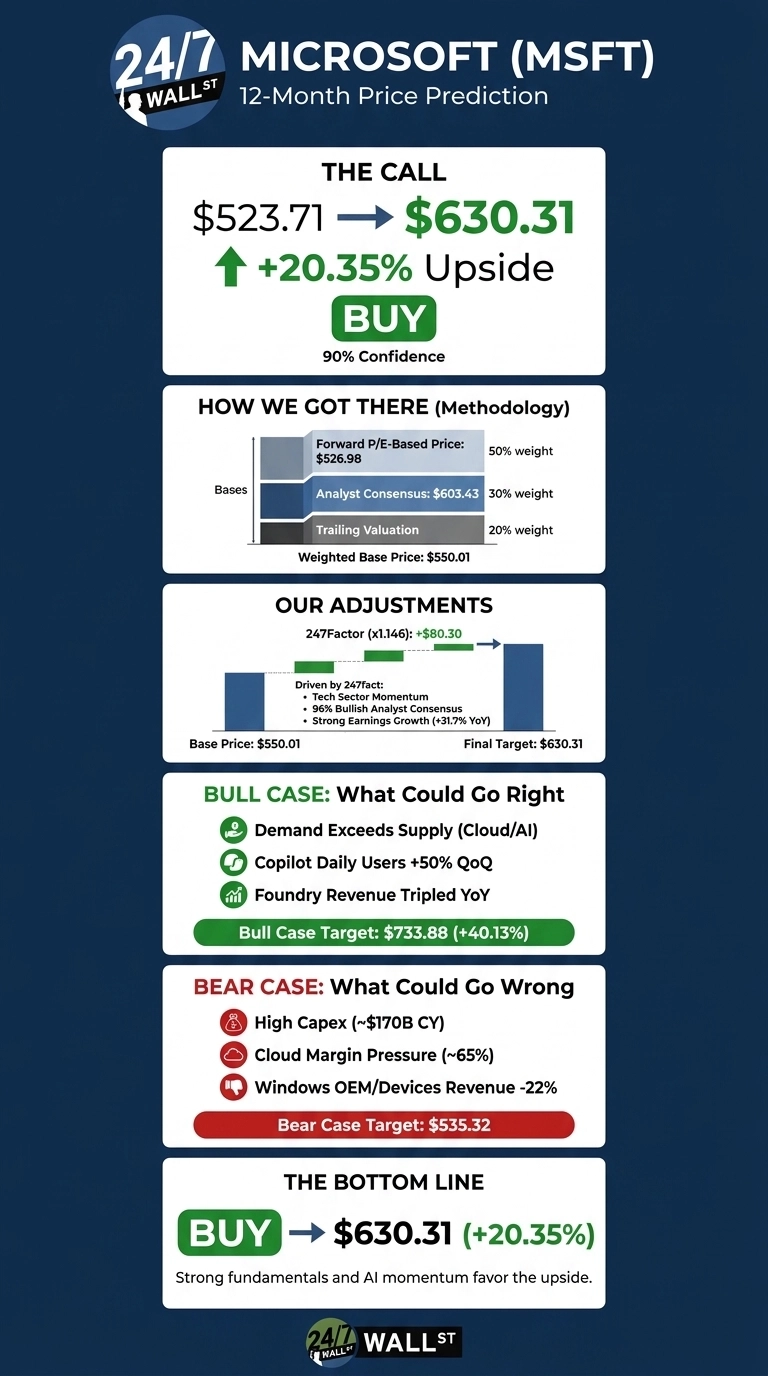
The 24/7 Wall St. price target for Microsoft is $630.31, suggesting 20.35% upside over the next 12 months. The stock gets a buy rating with high confidence.

24/7 Wall St. Price Target Summary
| Metric | Value |
|---|---|
| Current Price | $523.71 |
| Price Target from 24/7 Wall St. | $630.31 |
| Upside/Downside | 20.35% |
| Recommendation | BUY |
| Confidence Level | 90% |
Revenue came in at $92.28 billion against an estimate of $90.75 billion, up 18.8%. Non-GAAP EPS of $4.89 exceeded the $4.72 consensus.
Azure grew 48%, and commercial remaining performance obligations reached $677 billion, up 73%. Analysts are nearly unanimous: Microsoft has 14 Strong Buy, 39 Buy and 2 Hold ratings.

Lighter Capex Spooked AI Stocks After a Strong Quarter
Shares fell 1.73% over the past week, though they are up 2.85% over the past month and 8.98% year to date. That follows a 37.5% jump in the September quarter. The stock sits 4.98% below its 52-week high of $551.15.
Quarterly capex of $45.2 billion came in below expectations, and CoreWeave (NASDAQ:CRWV) and other neocloud stocks fell on the news (CNBC). For the second quarter, management guided revenue to $96 to $97.1 billion and Azure growth to 49% to 50% in constant currency.

Why Bulls See $733 and Beyond
Our bull case reaches $733.88, or 40.13% upside. Management said “customer demand continues to exceed available supply.” Copilot daily users rose nearly 50% from the prior quarter and more than 5x year over year.
Foundry has over 120,000 customers, and its revenue more than tripled. The consensus target of $603.43 sits well above where the stock trades now.

Capex and OpenAI Exposure Cap the Upside
Under the bear case, the stock reaches only $535.32. Management expects calendar-year capex of about $170 billion. Microsoft Cloud gross margin is heading toward roughly 65%. OpenAI accounted for 11% of revenue, and Windows OEM and Devices revenue fell 22%.
On the other side, about three-quarters of capex went to short-lived CPUs and GPUs (the infrastructure suppliers on the other end of that spend are the subject of a free report we put together on seven AI infrastructure names that aren’t chipmakers). Free cash flow was still $18.6 billion.
Microsoft Sits Between Alphabet and Amazon on Valuation
| Company | P/E | Operating Margin |
|---|---|---|
| Microsoft | 29 | 46.78% |
| Alphabet | 14 | 32.06% |
| Amazon | 35 | 11.16% |
Alphabet (NASDAQ:GOOGL) competes directly in cloud and AI. Google Cloud grew 103%, yet free cash flow was -$9.06 billion. Its low P/E shows that cash burn, and Microsoft gets its premium by staying cash-positive.
Amazon (NASDAQ:AMZN) makes the most direct comparison for Azure. AWS grew 37% last quarter, which trails Azure. Amazon still trades at a higher multiple with a much lower margin. Against these two peers, the 24/7 Wall St. price target looks reasonable.
Fundamentals Favor the Upside Case
The 24/7 Wall St. price target of $630.31 comes with a buy rating and 90% confidence. What tips the scale is a signed backlog that keeps growing faster than revenue.
I find the setup compelling if Azure growth reaches the guided range as new capacity comes online. I would grow more conservative if cloud margins slip below guidance while capex keeps rising.
Here is where our model projects Microsoft could trade, assuming current growth trends and market conditions hold.
| Year | Price Target from 24/7 Wall St. |
|---|---|
| 2026 | $548.04 |
| 2027 | $638.92 |
| 2028 | $707.07 |
| 2029 | $806.97 |
| 2030 | $846.52 |
These projections assume Microsoft keeps executing on its AI infrastructure strategy. Results could land well above or below these levels depending on capex returns, the OpenAI relationship and how quickly Copilot switches to usage-based revenue.
Contact [email protected] for any questions or corrections.
Vandita Jadeja is a financial publisher with over a decade of experience writing about financial topics, including investment, savings, retirement, insurance and banking. Vandita is a Chartered Accountant who loves to debunk financial concepts for readers.
Her work has appeared on sites that include The Motley Fool, InvestorPlace, and Benzinga. She covers investing and focuses on stock picks and price prediction for 24/7 Wall St.
When not looking for the next stock investment opportunity, she can be found traveling, reading, chasing sunsets and enjoying her iced latte.