
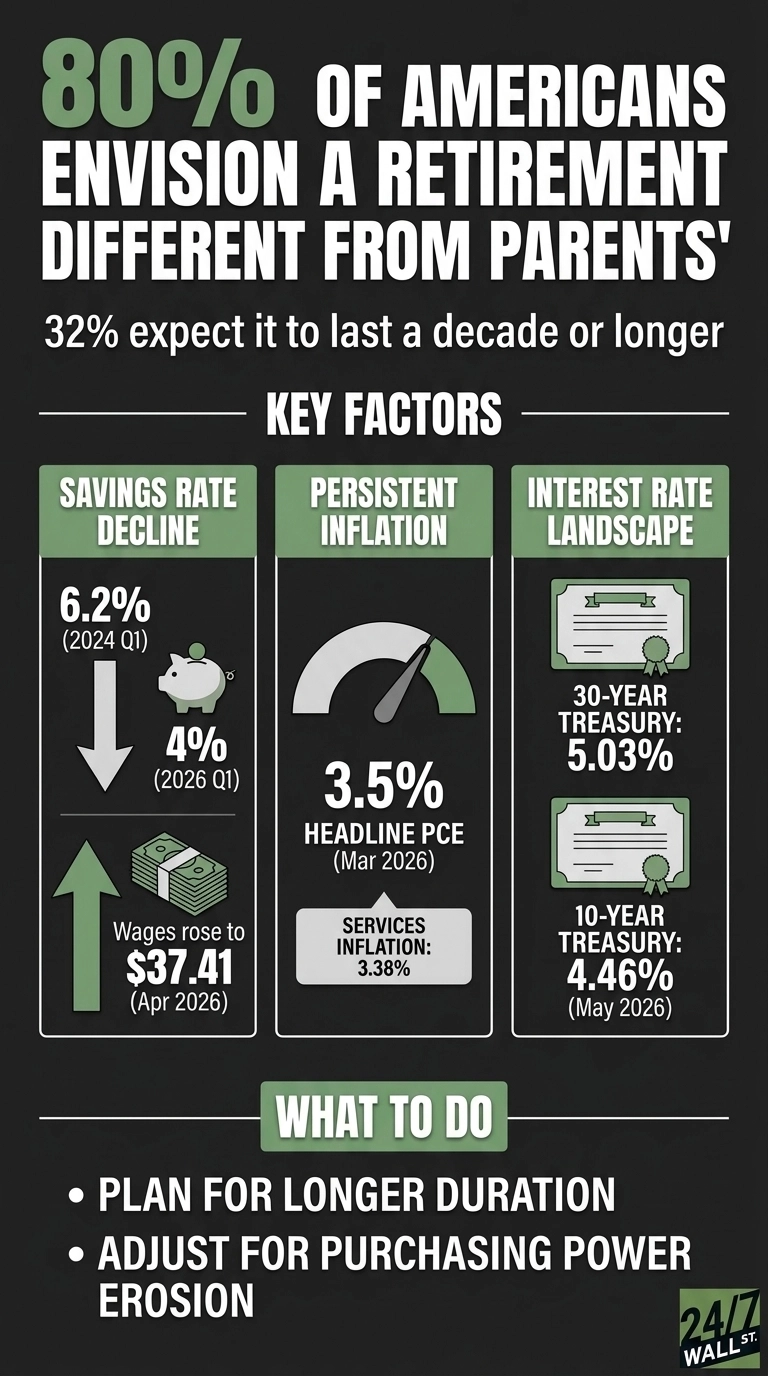
The Northwestern Mutual 2025 Planning & Progress Study put a number on what most Americans already sensed: their retirement will look almost nothing like their parents’ did. According to the study, 80% of Americans envision a retirement different from their parents’ generation, and 32% expect their retirement to last a decade or longer than their parents’ did. The survey reached 4,626 U.S. adults between January 2 and January 19, 2025, weighted to mirror the population. The picture that emerges centers on the financial backdrop reshaping what retirement can be.
A longer runway, a shakier launchpad
The shift really starts with how long people expect to live. When someone imagines a retirement that stretches a decade beyond what their parents planned for, the entire structure changes with it. A longer horizon reshapes how big the nest egg needs to be, how carefully withdrawals have to be sequenced, how much part‑time work might matter, and how far Social Security can realistically carry the load. In the group that expects a different kind of retirement, many picture themselves working longer and placing greater emphasis on protecting what they’ve built, a noticeable departure from the simpler “stop at 65” model that shaped the generation before them.
The savings backdrop makes that vision harder to execute. The U.S. personal savings rate has slipped from 6.2% in the first quarter of 2024 to 4% in the first quarter of 2026, even as wages kept climbing. Average hourly earnings for private‑sector workers reached $37.41 in April 2026, up from $34.47 at the start of 2024 and the highest level in the BLS series. Income is rising. The share of income being saved is falling. For a retirement expected to last longer, that mismatch works against the math that holds everything together.
Why the parents’ playbook does not transfer
Three forces explain most of the divergence.
The first is inflation that continues to run hotter than the Fed’s target. Headline PCE was rising at 3.5% year over year in March 2026, with core PCE at 3.2%. Services inflation, which shapes retiree budgets through healthcare, housing, and personal care, was running at 3.38%. Over a 30‑year retirement, a steady 3% drag on purchasing power compounds into a very different lifestyle by the later years.
The second is the interest‑rate backdrop, as the federal funds upper bound sits at 3.75% as of May 13, 2026, down 75 basis points from a year earlier. The 30‑year Treasury yields 5.03%, and the 10‑year sits at 4.46%. That is a workable income environment for retirees building bond ladders or considering annuities, and it stands in sharp contrast to the near‑zero rates that defined the 2010s. Parents who retired into that earlier era leaned more heavily on equities or pensions. Today’s near‑retirees can actually assemble a fixed‑income portfolio that pays.
The third is the role of guaranteed income. Social Security transfers totaled $1,631.2 billion in the first quarter of 2026, up from $1,427.6 billion in the first quarter of 2024. The program is paying out more in absolute terms, but private pensions have largely been replaced by 401(k) balances that workers are responsible for accumulating, allocating, and drawing down.
The mood matches the math
The University of Michigan Consumer Sentiment Index reads 48.2 as of May 2026, well below the 60 level often associated with recessionary attitudes. Sentiment has remained below that line throughout the full 12-month window. Pessimism about the near term tends to shape long-term planning assumptions, which aligns with why 80% of Americans see their retirement as a different project from the one their parents finished.
What the data actually says
The Northwestern Mutual finding describes a financial system that has reorganized itself: Retirements are getting longer, all while inflation is sticky enough to matter over the course of thirty years. Savings rates are also falling while wages rise, and, unsurprisingly, guaranteed income from employers has thinned out, while guaranteed income from Treasuries has gotten more attractive. A plan built for this environment generally assumes more years, more inflation, more personal responsibility for income generation, and more time spent working in some form past the traditional retirement date. That is what 80% of Americans are signaling when they say their retirement will look different.
Contact [email protected] for any questions or corrections.