 The prices of goods and services — whether they are essential such as housing, food, and medical care or luxury items such as tobacco and sports equipment — vary widely across the nation and within states.
Based on recently released price level data from the Bureau of Economic Analysis (BEA), 24/7 Wall St. reviewed the most expensive metropolitan areas in each state. Across all metro areas, Urban Honolulu, Hawaii has the highest cost of living, while Danville, Illinois is the least expensive place to live in the country.
Click Here To See The Most Expensive City To Live In Each State
Since every state must have a most expensive area, the city in which price levels are highest is not necessarily especially expensive compared to the nation or areas in other states. Goods and services in the most expensive city in 30 states actually cost less than they do on average nationwide. These cities are usually in states that have low costs of living themselves. For example, Jackson is the most expensive city in Mississippi, which itself is the least expensive state in the country. And prices in Jackson are 8.5% cheaper compared to national prices.
According to Eric B. Figueroa, an expert on purchasing power parity at the BEA, price levels may vary across areas for a host of reasons. The amount of land available in any given area is one factor. Rent and other living expenses are part of the regional price parity calculation, and rents tend to be higher in more-densely populated metropolitan areas.
While the exact relationship between wages and living costs is not identified by the BEA, Figueroa said, “Goods and services may have higher [prices] in areas that have higher wages relative to areas with lower wages.” The median household income in the most expensive city in 33 of the 50 states exceeded the national median of $52,250.
To identify the most expensive city in each state, 24/7 Wall St. reviewed the highest regional price parities among each state’s metro areas from the BEA. RPPs are expressed as an index of the national average price level (100) for goods and services in 2012, the most recent period available. We also reviewed socioeconomic data, including median household income, per capita income, educational attainment rates, poverty rates, and homeownership rates from the U.S. Census Bureau’s American Community Survey (ACS). Annual unemployment rates for 2014 came from the Bureau of Labor Statistics, (BLS).
Some metropolitan statistical areas span multiple states. For example, the New York-Newark-Jersey City metro area includes cities in New York as well as New Jersey. Each metro area has one principal city designated by the Office of Management and Budget. New York is the principal city of the New York-Newark-Jersey City metro area. To avoid treating a city as the most expensive place in two states, we assigned each metro area to the state in which its principal city is located. Because the New York-Newark-Jersey City metro area’s principal city was in New York, the metro area was treated as a New York metro area and was excluded from consideration for New Jersey. This means that many NJ cities that are in the metro were excluded from consideration for that state.
These are the most expensive cities in each state.
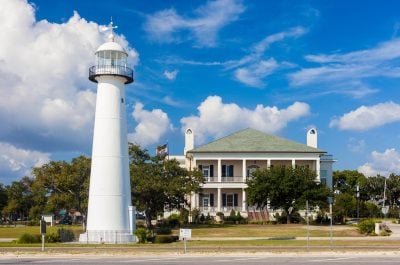
1. Huntsville, Alabama
> City cost of living: 91.3
> State cost of living: 88.1
> City median rent paid: $725
> City median household income: $55,857
With a relative price parity of 88.1, Alabama is the fourth cheapest state to live in the country. In Huntsville, a city of 435,000 people on the state’s northern border with Tennessee, the cost of living is higher than in the rest of the state but still lower than in the majority of the state’s metro areas. Compared to most of Alabama, Huntsville has many socioeconomic factors associated with higher costs of living. For example, 36.5% of adults have a bachelor’s degree compared to 23.5% of Alabama residents 25 and older. City homes are also more expensive, with a median home value of $156,700 compared to the state median home value of $122,700.
ALSO READ: 10 Cities With the Most Adultery
2. Anchorage, Alaska
> City cost of living: 110.9
> State cost of living: 107.1
> City median rent paid: $1,150
> City median household income: $76,831
Anchorage is the most expensive city in Alaska. Goods and services in the area cost nearly 11% more than they do, on average, across the nation. However, the cost of living in Anchorage is not so different than in the state. The reason for this may be that the state has only one other metro area. Alaska has among the higher costs of living compared to other states.
3. Phoenix-Mesa-Scottsdale, Arizona
> City cost of living: 99.7
> State cost of living: 98.1
> City median rent paid: $936
> City median household income: $51,847
The costs of living in both Arizona and its most expensive metropolitan, Phoenix-Mesa-Scottsdale, are roughly in line with the cost of living nationwide. Phoenix is only slightly more expensive than the state. The capital area’s median home value of $177,900 is only slightly higher than Arizona’s median home value of $166,000. The city has a median household income of $51,847, compared to a state median income of $48,510 and a national median income of $52,250.
ALSO READ: States Drinking the Most Beer
4. Little Rock-North Little Rock-Conway, Arkansas
> City cost of living: 91.1
> State cost of living: 87.6
> City median rent paid: $754
> City median household income: $48,304
Arkansas is the second least expensive state to live in after Mississippi, with goods and services costing 12.4% less than the national average prices. The state’s most expensive urban area, Little Rock-North Little Rock-Conway, is not an especially expensive place to live. The state’s median household income of $40,511 is also nearly the lowest compared to other states. In the Little Rock area, while household median income is far higher than the state’s, it is still below the national median.
5. San Jose-Sunnyvale-Santa Clara, California
> City cost of living: 122.0
> State cost of living: 112.9
> City median rent paid: $1,640
> City median household income: $91,533
On the whole, Californians live in one of the most expensive states. However, regional price parity varies widely within the state. El Centro, California has a regional price parity of 92.2. The San Jose metropolitan area, meanwhile, has a regional price parity of 122, third highest of any U.S. metropolitan area. Home to Silicon Valley and a host of high-income tech positions, the area’s median household income of $91,533 is more than $30,000 above the state’s median income. Renting is fairly common in the area, and it is not cheap. While just 15.3% of all renters nationwide pay more than $1,500 per month, 57.4% of renters in the San Jose area pay more than $1,500 per month.
6. Boulder, Colorado
> City cost of living: 108.9
> State cost of living: 101.6
> City median rent paid: $1,168
> City median household income: $71,604
Goods and services in Boulder cost about 9% more than they do nationwide and about 7% more than they do across the state. Higher incomes usually accompany higher living costs, and Boulder is no exception. The typical area household earns $71,604 annually, well above the statewide income figure of $58,823, which itself is among the highest incomes compared to all states. As is the case with the most expensive cities in many other states, Boulder residents are also very well educated. More than 58% of adults have at least a bachelor’s degree versus the statewide attainment rate of less than 38% — the second highest percentage compared to all states.
ALSO READ: States With the Fastest Growing Economies
7. Bridgeport-Stamford-Norwalk, Connecticut
> City cost of living: 121.5
> State cost of living: 109.4
> City median rent paid: $1,330
> City median household income: $82,084
Each of Connecticut’s metropolitan areas has a higher cost of living than the national average, but none are nearly as expensive as the Bridgeport-Stamford-Norwalk region, which is actually the fourth most expensive metro area in the country. The region contains multiple affluent suburbs of New York City commuters, and the typical home costs $420,600, significantly higher than the state’s median home value of $267,000 and the national median of $173,900. Like in many expensive metropolitan areas, Bridgeport residents are likely to have higher education levels. Of residents 25 or older, 45.5% have a bachelor’s degree compared to 26.6% nationwide.
8. Dover, Delaware
> City cost of living: 94.1
> State cost of living: 102.3
> City median rent paid: $955
> City median household income: $54,794
Dover is the most expensive city in Delaware by default as it is also the only metropolitan area in the state. As a result, the regional price parity in Dover of 94.1 is actually lower than the state figure. Other, less urbanized regions are more expensive, which brings up the overall price level in the state. Costs increase because incomes are higher. In Dover, this isn’t the case. While the cost of living in Dover is lower than the nation’s, the median household income of $54,794 is higher than the national figure.
ALSO READ: 9 Cities Running Out of Water
9. Miami-Fort Lauderdale-West Palm Beach, Florida
> City cost of living: 105.0
> State cost of living: 98.8
> City median rent paid: $1,120
> City median household income: $46,946
Compared to the national average price level, it costs about 5% more to live in the Miami-Fort Lauderdale area. The median rent of $1,120 is considerably higher than the state and national rents. Unlike many other expensive areas, incomes in the metro area are less than proportionate. More than 54% of renting households pay more than 35% of their income in rent. Statewide, 48.2% of renting households pay this much in rent — the highest percentage in the country. With some of the most visited beaches in the nation, many residents may be willing to pay a larger share of their income to live in the area.
10. Atlanta-Sandy Springs-Roswell, Georgia
> City cost of living: 95.6
> State cost of living: 92.0
> City median rent paid: $947
> City median household income: $55,733
None of Georgia’s metro areas has a higher cost of living than the national average, but prices in the Atlanta-Sandy Springs-Roswell area come close. Goods and services in the metro cost 4.4% less than they do across the country and nearly 4% more than across Georgia. With a relatively high median household income of $55,733, the area is actually quite affordable.
11. Urban Honolulu, Hawaii
> City cost of living: 122.9
> State cost of living: 117.2
> City median rent paid: $1,535
> City median household income: $73,388
Due in large part to costly transportation expenses, goods and services in Hawaii cost more than they do in any other state. Perhaps as a result, Honolulu, where the cost of living is nearly 23% higher than the national average, is the most expensive area in both the state and the entire country. As in most expensive areas, incomes are also high. The typical household in Honolulu earns $73,388 annually, well above the state’s income figure of $68,020, which itself is the fourth highest compared to all states.
ALSO READ: The Worst Companies To Work For
12. Boise City, Idaho
> City cost of living: 94.7
> State cost of living: 93.6
> City median rent paid: $799
> City median household income: $49,583
Boise City citizens pay slightly more for goods and services than residents statewide. Boise City is the only metropolitan area in Idaho where the cost of living is greater than the cost of living across the state. While expenses are marginally higher in Boise City, residents tend to earn more in order to afford these costs. Boise City’s per capita income was $34,818, about $600 more than income statewide. As is the case in many of the most expensive cities, residents have higher educational levels. Nearly 31% of Boise City residents have a bachelor’s degree or higher. Statewide, only 26.2% of residents have a bachelor’s degree or higher.
13. Chicago-Naperville-Elgin, Illinois
> City cost of living: 106.6
> State cost of living: 100.6
> City median rent paid: $959
> City median household income: $60,564
The Chicago-Naperville-Elgin area is the most expensive metropolitan area in Illinois. In fact, it is the only metro area with a higher price parity than the state average. While goods and services in Illinois are, on average, 0.6% more expensive than they are nationwide, the cost of living in the Chicago metro area is 6.6% more expensive than the country as a whole. None of the other nine metropolitan areas in Illinois has a higher cost of living than the national average.
14. Indianapolis-Carmel-Anderson, Indiana
> City cost of living: 93.9
> State cost of living: 91.1
> City median rent paid: $789
> City median household income: $51,087
The nearly 2 million people who call the Indianapolis area home pay more for goods and services than the residents of the state’s 11 other metropolitan areas. Housing costs in both the state and the city are cheaper than the country as a whole. While state residents pay just 75.8% of the average rent cost nationwide, people in the Indianapolis metro area pay 86.1% of the national average rent. Similarly, the median home value in the area is just shy of $140,000, almost $20,000 more than Indiana’s median home value of $122,200.
ALSO READ: 13 Cars That Cost More Than They Used To
15. Iowa City, Iowa
> City cost of living: 95.9
> State cost of living: 89.5
> City median rent paid: $799
> City median household income: $52,220
In Iowa City, the most expensive metropolitan area in Iowa, goods and services cost about 4% less on average than they do nationwide. While the cost of living in Iowa remained the same from the year before, the relative price of goods and services in Iowa City increased slightly. Despite having a higher cost of living than the state’s, Iowa City residents earn less money on average than all state residents. Per capita income in Iowa City is about $1,600 less than statewide income per person.
16. Lawrence, Kansas
> City cost of living: 95.5
> State cost of living: 89.9
> City median rent paid: $836
> City median household income: $52,150
Lawrence, Kansas has a higher cost of living than the three other metropolitan areas in the state. Manhattan, the second most expensive city in the state, has a regional price parity of 91.9, slightly less than Lawrence’s regional price parity. Though Lawrence’s 114,322 residents pay more for goods and services than state residents do, the city’s average income is significantly less than the per capita income statewide. The average individual in Lawrence earns $36,103, nearly $10,000 less than the average state resident.
ALSO READ: The States With the Strongest Unions
17. Lexington-Fayette, Kentucky
> City cost of living: 92.2
> State cost of living: 88.8
> City median rent paid: $771
> City median household income: $50,279
About 9% of Kentucky’s 4.4 million residents call the Lexington-Fayette metropolitan area home. The cost of goods and services in the Lexington area is about 3.4% higher than it is across the state. Also, median household income in Kentucky’s most expensive city is approximately $7,000 higher than the corresponding statewide figure. Residents of Lexington are also likely to be better educated. Statewide, 22.6% of residents 25 and older have at least a bachelor’s degree compared to 35.7% of Lexington adults.
18. New Orleans-Metairie, Louisiana
> City cost of living: 96.7
> State cost of living: 91.4
> City median rent paid: $908
> City median household income: $45,981
The regional price parity of New Orleans-Metairie, Louisiana’s most expensive metropolitan area, dropped slightly from the previous year. More than 37% of the state’s 4.6 millions residents call the New Orleans area home. While rent costs in Louisiana are almost 33% less expensive than the nationwide average, rent costs in the New Orleans area are more in line with nationwide rents, costing only 1% less than the national average.
19. Portland-South Portland, Maine
> City cost of living: 100.8
> State cost of living: 98.3
> City median rent paid: $902
> City median household income: $54,766
The Portland-South Portland area is the only city in Maine with a higher cost of living than the national average. At $232,300, the median home value in the Portland area is almost $60,000 more than the median home value statewide. Similarly, renters in Maine’s most expensive city pay about 14% more than renters across the state as a whole. The share of Portlanders paying more than $1,500 in rent is roughly double the share of renters who pay that much across the state.
ALSO READ: States With the Slowest Growing Economies
20. Baltimore-Columbia-Towson, Maryland
> City cost of living: 109.4
> State cost of living: 111.3
> City median rent paid: $1,132
> City median household income: $68,455
Maryland is one of only four states where the most expensive metropolitan area has a lower cost of living than the state’s. While goods and services in the Baltimore metropolitan area are 9.4% more expensive than prices nationwide, the same goods and services cost 11.3% more in all of Maryland than they do across the country. The difference in rent costs further illustrates the disparity. While the cost of renting in the Baltimore area is about 16% more expensive than the average rent cost across the nation, the expenses associated with renting a property in Maryland is over 25% more expensive than rent nationwide.
21. Boston-Cambridge-Newton, Massachusetts
> City cost of living: 111.6
> State cost of living: 107.2
> City median rent paid: $1,207
> City median household income: $72,907
A vast majority of Massachusetts’ 6.7 million residents lives in the Boston metropolitan area. While area residents pay slightly more for all goods and services than people living in other parts of the state, the difference in rent prices is the most drastic. Though rent across Massachusetts is, on average, 21.4% more expensive than rent across the country, rent in the Boston metropolitan area is over 40% higher than the average rent costs nationwide.
ALSO READ: The States With the Weakest Unions
22. Ann Arbor, Michigan
> City cost of living: 102.2
> State cost of living: 94.4
> City median rent paid: $930
> City median household income: $59,660
Of the 14 metropolitan areas in Michigan, Ann Arbor is the only one with higher prices than the nation as a whole. Like many metro areas with higher prices, residents are significantly wealthier than in most of the state. Median household income in Ann Arbor is over $10,000 higher than the typical Michigan household income.
23. Minneapolis-St. Paul-Bloomington, Minnesota
> City cost of living: 103.0
> State cost of living: 97.5
> City median rent paid: $911
> City median household income: $67,194
ALSO READ: 9 Cities Running Out Of Water
Minneapolis-St. Paul-Bloomington is the only urban area in Minnesota with a higher regional price parity than the state’s. Rochester, the second most expensive metropolitan area in the state, has regional price parity 9% lower than the twin cities’. While Minnesota’s most expensive metropolitan area is slightly more expensive than the state as a whole, incomes in the Minneapolis area are significantly higher. At $67,194, the annual median household income in the Minneapolis-St. Paul in area is over $10,000 more than the median household income of $48,273 across the state.
24. Jackson, Mississippi
> City cost of living: 91.5
> State cost of living: 86.4
> City median rent paid: $776
> City median household income: $43,611
Mississippi has the lowest cost of living of any state in the country, with regional average prices nearly 14.0% below the national average prices. Although prices in the state’s most expensive city are about 6% higher than state prices, Jackson is still rather cheap — about 8.5% cheaper compared to national prices. Jackson is about 8% more expensive than the state’s cheapest city, Hattiesburg.
25. Kansas City, Missouri
> City cost of living: 92.7
> State cost of living: 88.1
> City median rent paid: $834
> City median household income: $56,248
Though its regional price parity fell slightly from the previous year’s rate of 93.6, Kansas City is the most expensive city in Missouri. However, it is relatively inexpensive on the national scale. On average, goods and services cost 7.3% less in Kansas City than they do in the rest of the country. When compared to Jefferson City, Missouri’s least expensive metropolitan area, Kansas City is actually relatively expensive. Kansas City is 14.7% more expensive than Jefferson City.
26. Missoula, Montana
> City cost of living: 96.5
> State cost of living: 94.2
> City median rent paid: $777
> City median household income: $48,077
While all three metropolitan areas in Montana have a higher regional price parity than the state’s, Missoula is the most expensive. However, the higher cost of living in Missoula is not offset by higher pay. The average Missoula resident earns just under $36,000 annually, about $2,700 less than statewide income per capita. While the cost of living across Montana did not increase from the previous year, the relative cost of goods and services in Missoula went up slightly during the same time period.
ALSO READ: The 25 Most Expensive Steakhouses in the Country
27. Omaha-Council Bluffs, Nebraska
> City cost of living: 94.3
> State cost of living: 90.1
> City median rent paid: $783
> City median household income: $55,382
With a regional price parity of 94.3, Omaha is the most expensive metropolitan area in Nebraska. The cost of living is also higher than the statewide average cost. Like many of the more expensive places to live, Omaha has a lower poverty rate than the statewide figure of 13.2%. Furthermore, median annual household income in Omaha-Council Bluffs trumps the corresponding statewide figure of $51,440 by nearly $4,000.
28. Reno, Nevada
> City cost of living: 99.5
> State cost of living: 98.2
> City median rent paid: $870
> City median household income: $53,948
While the costs of all goods and services do not vary much across the state, Reno is the most expensive city in Nevada. The regional price parities of all three metropolitan areas in the state as well as of the state itself are within 2% of the national average cost. While Reno is only slightly more expensive than the rest of the state, income is significantly higher in the city. Per capita income in Reno is about $4,500 higher than per capita income for all of Nevada.
ALSO READ: America’s Least Healthy Fast Food Chains
29. Manchester-Nashua, New Hampshire
> City cost of living: 108.9
> State cost of living: 106.2
> City median rent paid: $1,061
> City median household income: $67,574
The Manchester-Nashua metropolitan area is the most expensive in New Hampshire by default as it is the only census-designated metropolitan area in the state. However, Manchester-Nashua residents pay nearly 9% more for goods and services than residents do nationwide, while New Hampshire residents pay just over 6% than national prices. Similarly, annual median household income in the Manchester metropolitan area is about $3,250 greater than the corresponding statewide figure.
30. Trenton, New Jersey
> City cost of living: 111.5
> State cost of living: 114.1
> City median rent paid: $1,096
> City median household income: $70,857
Even though it is the most expensive city in New Jersey, the cost of living in Trenton is actually lower than the average cost of living across the state. While Trenton’s 370,414 residents pay an average of 11.5% more for goods and services than Americans do nationwide, residents across all of New Jersey pay 14.1% more. Despite a lower cost of living, Trenton residents have higher incomes. The average Trenton resident earns $47,404, nearly $2,000 more than the corresponding figure of $45,552 for all of New Jersey.
31. Santa Fe, New Mexico
> City cost of living: 99.2
> State cost of living: 94.8
> City median rent paid: $921
> City median household income: $51,833
Sante Fe, the capital of New Mexico, is the most expensive city in the state. Prices in the metro area are roughly 5% higher in Santa Fe than across the state. Santa Fe residents pay more for goods and services than most people across the state, and like the residents of most expensive places they also earn higher salaries and are more likely to be better educated. Per capita income in Santa Fe is about $6,500 higher than the average income across the state of $35,553. Also, nearly 42% of adults in Santa Fe have a bachelor’s degree or higher compared to 26.4% of adults statewide.
ALSO READ: The Best States To Be Unemployed
32. New York-Newark-Jersey City, New York
> City cost of living: 122.2
> State cost of living: 115.4
> City median rent paid: $1,237
> City median household income: $65,786
While the New York-Newark-Jersey City metropolitan area spans two states, the largest share of the area’s residents live in New York. With just under 20 million residents, the New York metro area is the most populated in the country. Residents pay an average of 22.2% more for goods and services than residents do across the country. Even more staggering is the cost of rent in the area. The average renter in the metro area pays over 57% more than the average rent price nationwide.
33. Jacksonville, North Carolina
> City cost of living: 96.3
> State cost of living: 91.6
> City median rent paid: $949
> City median household income: $51,495
Jacksonville is more expensive than the 14 other metropolitan areas in North Carolina. While the cost of living is 8.4% less in North Carolina than it is across the country, the cost of living in Jacksonville is only 3.7% less than it is nationwide. The median household income in Jacksonville is about $5,500 more than the typical North Carolina household earnings of $45,906.
34. Bismarck, North Dakota
> City cost of living: 94.0
> State cost of living: 90.4
> City median rent paid: $715
> City median household income: $64,626
While Bismarck is the most expensive city in North Dakota, it is not much more expensive than the other two metro areas in the state. Fargo and Grand Forks have a higher regional price parity than the state as a whole. Grand Forks, the least expensive city in the state is only 1.2% cheaper than Bismarck. Bismarck is roughly 4% more expensive than the state a whole.
ALSO READ: 10 States With The Most Gun Violence
35. Columbus, Ohio
> City cost of living: 93.8
> State cost of living: 89.2
> City median rent paid: $804
> City median household income: $54,079
Ohio’s capital Columbus is also the state’s most expensive city. Median rent in Columbus is almost $100 more than the state’s median rent of $709. Also, a smaller portion of Columbus’s workforce is looking for work compared to the state as a whole. The area’s unemployment rate of 4.8% is lower than Ohio’s jobless rate of 5.7%. Similarly, income per capita is about $800 more in Columbus than the statewide income figure of $42,427.
36. Oklahoma City, Oklahoma
> City cost of living: 92.3
> State cost of living: 89.9
> City median rent paid: $762
> City median household income: $50,136
Though Oklahoma City is the most expensive metropolitan area in Oklahoma, there is little disparity in cost of living across the state. The state’s other two metro areas, Tulsa and Lawton, have a regional price parity of 91.1 and 91.5, respectively — only slightly lower than Oklahoma City’s 92.3. Compared with the rest of the state, Oklahoma City not only has a higher cost of living, but also a higher per capita income. The average person in Oklahoma City earned just over $44,500 annually, while the average state resident took home about $42,700.
37. Portland-Vancouver-Hillsboro, Oregon
> City cost of living: 100.5
> State cost of living: 98.8
> City median rent paid: $969
> City median household income: $59,168
Though part of the Portland-Vancouver-Hillsboro metropolitan area extends into Washington, the largest share of the area’s 2.3 million residents live in Portland. Of the eight metropolitan areas in the state, Portland is the only city with a higher cost of living than the national average. Furthermore, the cost of living in the other seven cities is less than the average statewide cost of living. Rent in Portland was more expensive than in any other metro area in the state, costing 9.2% more than the national average.
ALSO READ: The States With The Most People Dying From Cancer
38. Philadelphia-Camden-Wilmington, Pennsylvania
> City cost of living: 109.0
> State cost of living: 98.7
> City median rent paid: $997
> City median household income: $60,482
Though the Philadelphia-Camden-Wilmington metropolitan area spans three states, the largest share resides in and around Philadelphia. The cost of living in the area is 9% higher than the average cost of living nationwide, while the cost of living in Pennsylvania is actually 1.3% less than the average cost nationwide. State College was the only other metropolitan area out of the 18 in the state with a higher cost of living than the nationwide average. The median home value in the Philadelphia metro area was also significantly higher than the corresponding statewide cost, at $233,600 versus $164,200 respectively.
39. Providence-Warwick, Rhode Island
> City cost of living: 99.8
> State cost of living: 98.7
> City median rent paid: $885
> City median household income: $55,055
Providence-Warwick is the most expensive metropolitan area in Rhode Island by default as it is technically the only census-designed metropolitan area in the state. Though the relative price parity declined from 100.5 in the previous year to the current rate of 99.8, Providence is still more expensive than the state as a whole by about 1%. Despite a higher cost of living, per capita income is slightly lower in Providence than the state as a whole. The average metro resident earns about $43,155 annually, over $700 less than the $43,905 the average Rhode Islander takes home.
ALSO READ: America’s Most Valuable States
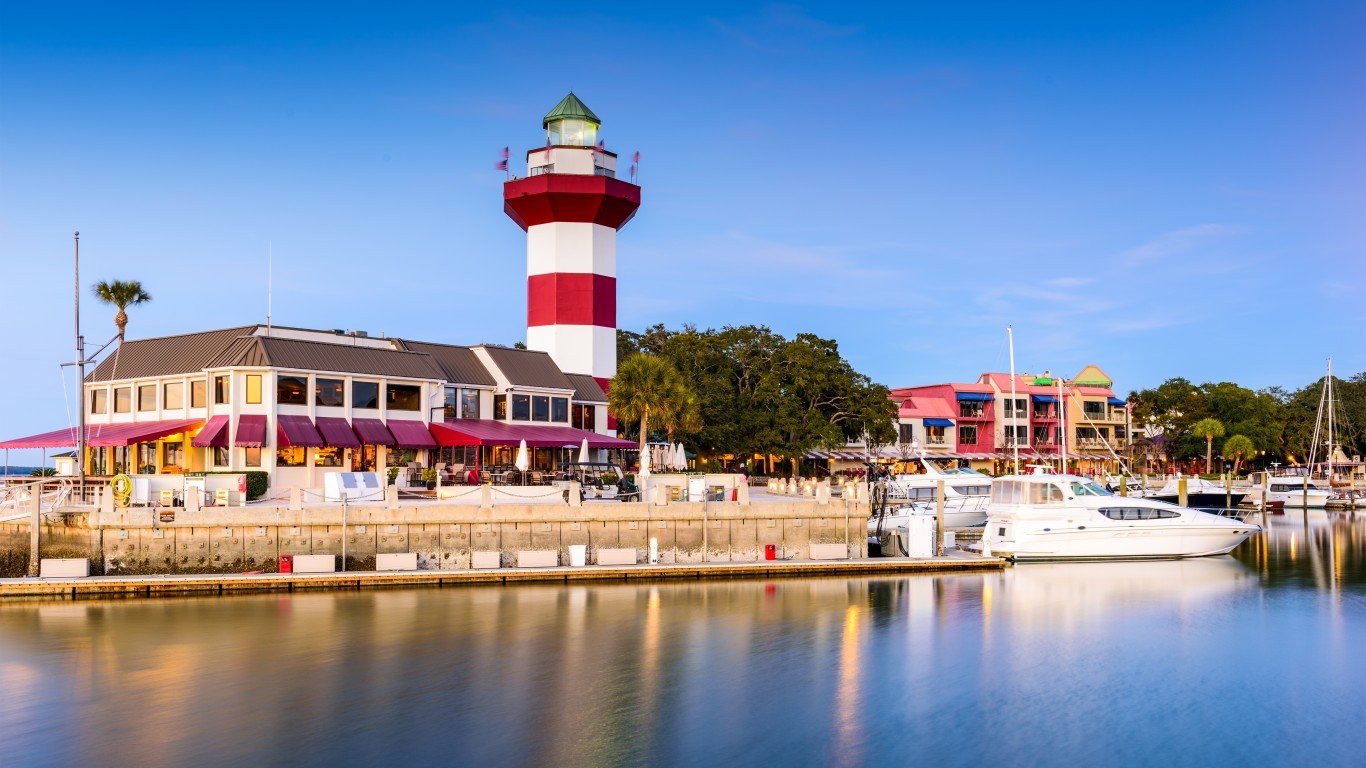
40. Charleston-North Charleston, South Carolina
> City cost of living: 95.7
> State cost of living: 90.7
> City median rent paid: $952
> City median household income: $51,771
Of the eight metropolitan areas in South Carolina, the Charleston area is the most expensive. The average cost of goods and services is 5.5% higher in Charleston than it is across the state. Renters in particular pay significantly more in South Carolina’s most expensive city than they do across the state. While the average renter in Charleston paid 94.6% of the average renter’s expenses across the country, the average renter in South Carolina paid just 76.3% of what the average renter paid nationwide.
41. Sioux Falls, South Dakota
> City cost of living: 93.2
> State cost of living: 88.2
> City median rent paid: $685
> City median household income: $55,952
Sioux Falls has a regional price parity slightly higher than Rapid City, the only other metropolitan area in South Dakota. While goods and services in Sioux Falls are more expensive than they are across the state by 5.7%. Per capita income for the city’s 240,000 residents was about $800 less than the average $48,626 residents across the state took home annually.
ALSO READ: The Happiest Countries In The World
42. Nashville-Davidson–Murfreesboro–Franklin, Tennessee
> City cost of living: 94.1
> State cost of living: 90.7
> City median rent paid: $849
> City median household income: $51,996
While Nashville residents face a higher cost of living than those living in the rest of the state, they also have higher incomes. At $45,582, the per capita income in the Nashville area is about $5,000 more than the income per capita statewide. Also, despite rent costing more than the average across the state, only 37.4% of renters in the Nashville area spend more than 35% of their salary on rent compared to the nearly 41% of state residents.
43. Dallas-Fort Worth-Arlington, Texas
> City cost of living: 101.0
> State cost of living: 96.5
> City median rent paid: $908
> City median household income: $57,398
The Dallas-Fort Worth area is the most expensive metropolitan area in Texas. With a price parity of 101, the area’s cost of living is nearly in line with the national average cost but about 4.7% higher than the statewide cost of living. Of the 25 metropolitan areas in Texas, the Dallas-Fort Worth area is one of only two with a higher cost of living than the national average. Cost of living varies widely in Texas as goods and services in the state’s least expensive metropolitan area, McAllen-Edinburg-Mission, cost 15% less than they do nationwide.
ALSO READ: The Worst States To Be Unemployed
44. Salt Lake City, Utah
> City cost of living: 99.1
> State cost of living: 96.8
> City median rent paid: $935
> City median household income: $61,520
On the whole, Utah is a relatively inexpensive state to live. Goods and services across the state cost more than 3% less on average than they do across the country. With a cost of living nearly in line with the national average, Salt Lake City is the most expensive metropolitan area in the Utah. The higher incomes in Salt Lake City somewhat offset the higher cost of living. The average Salt Lake City resident earns $38,705 annually, about $4,000 more than the average statewide income of about $34,580.
45. Burlington-South Burlington, Vermont
> City cost of living: 102.3
> State cost of living: 100.9
> City median rent paid: $996
> City median household income: $62,022
Home to nearly a third of the state’s total population, Burlington is the most expensive city in Vermont by default as it is technically the only metropolitan area in the state. However, the cost of living in Burlington is only about 1.4% higher than it is statewide. While both the median monthly rent and median monthly mortgage are higher in Burlington than the corresponding state average figures, higher incomes in the area help offset the additional burden. At $62,022, median household income in Burlington is nearly $10,000 more than it is statewide.
46. Virginia Beach-Norfolk-Newport News, Virginia
> City cost of living: 99.3
> State cost of living: 103.2
> City median rent paid: $1,052
> City median household income: $56,161
Virginia is one of the few states in which the most expensive city is actually cheaper than the state as a whole. While the cost of living in Virginia is 3.2% more expensive than the average cost nationwide, the cost of living in the Virginia Beach metro area is 0.7% less expensive than the nationwide cost. Despite its relative affordability, the Virginia Beach area is more expensive than the eight other metropolitan areas in the state, with a regional price parity nearly 12% higher than Blacksburg, the state’s least expensive city.
ALSO READ: America’s Least Valuable States
47. Seattle-Tacoma-Bellevue, Washington
> City cost of living: 107.0
> State cost of living: 103.2
> City median rent paid: $1,135
> City median household income: $67,479
Of the 11 metropolitan areas in Washington, Seattle has the highest regional price parity and is one of only three that are more expensive than the state as a whole. In the Seattle area, the higher cost of living comes with higher income. Per capita income in the metro area is over $5,000 more than the per capita income in Washington as a whole. Real estate in the city is also more expensive. The median home value in the Seattle area is $57,100 more than the statewide median home value.
48. Charleston, West Virginia
> City cost of living: 89.8
> State cost of living: 88.6
> City median rent paid: $644
> City median household income: $45,251
West Virginia has the sixth lowest cost of living in the country. While Charleston is the most expensive city in the state, its cost of living is not much higher than the statewide cost of living or most of the six other metropolitan areas in the state. In Beckley, the least expensive city in West Virginia, the cost of living is only 4.7% lower than in Charleston. With the regional price parity dropping to 89.8 from 91.1 the previous year, the dollar is going further for Charleston residents. Furthermore, per capita income in Charleston increased to $44,721 in 2012 from $43,453 the previous year.
ALSO READ: The 10 Most Expensive Places To Get Married
49. Madison, Wisconsin
> City cost of living: 97.9
> State cost of living: 92.9
> City median rent paid: $875
> City median household income: $59,466
While the regional price parity across Wisconsin declined slightly from the previous year, the cost of living in Madison, the state’s capital, increased over that time. Home to over half a million people, income per capita in Madison is $46,570, nearly $4,000 more than income per capita across the state. Costing 9.3% more than it does on average nationwide, rent was especially expensive. In Madison, 9.2% of renters paid more than $1,500, compared to the just 4.5% of renters across the state.
50. Casper, Wyoming
> City cost of living: 97.8
> State cost of living: 96.4
> City median rent paid: $804
> City median household income: $58,635
The cost of living is relatively level across Wyoming. Of the two metropolitan areas in the state, Casper’s regional price parity is only slightly higher than the price parity of 96.3 in Cheyenne.Similarly, the cost of living in Casper is only 1.5% higher than statewide expenses. However, Casper may become even more expensive in relation to the rest of the state. From the year before the most current available data, Wyoming’s relative cost of living declined 0.5% while Casper’s increased by 1%.
Contact [email protected] for any questions or corrections.