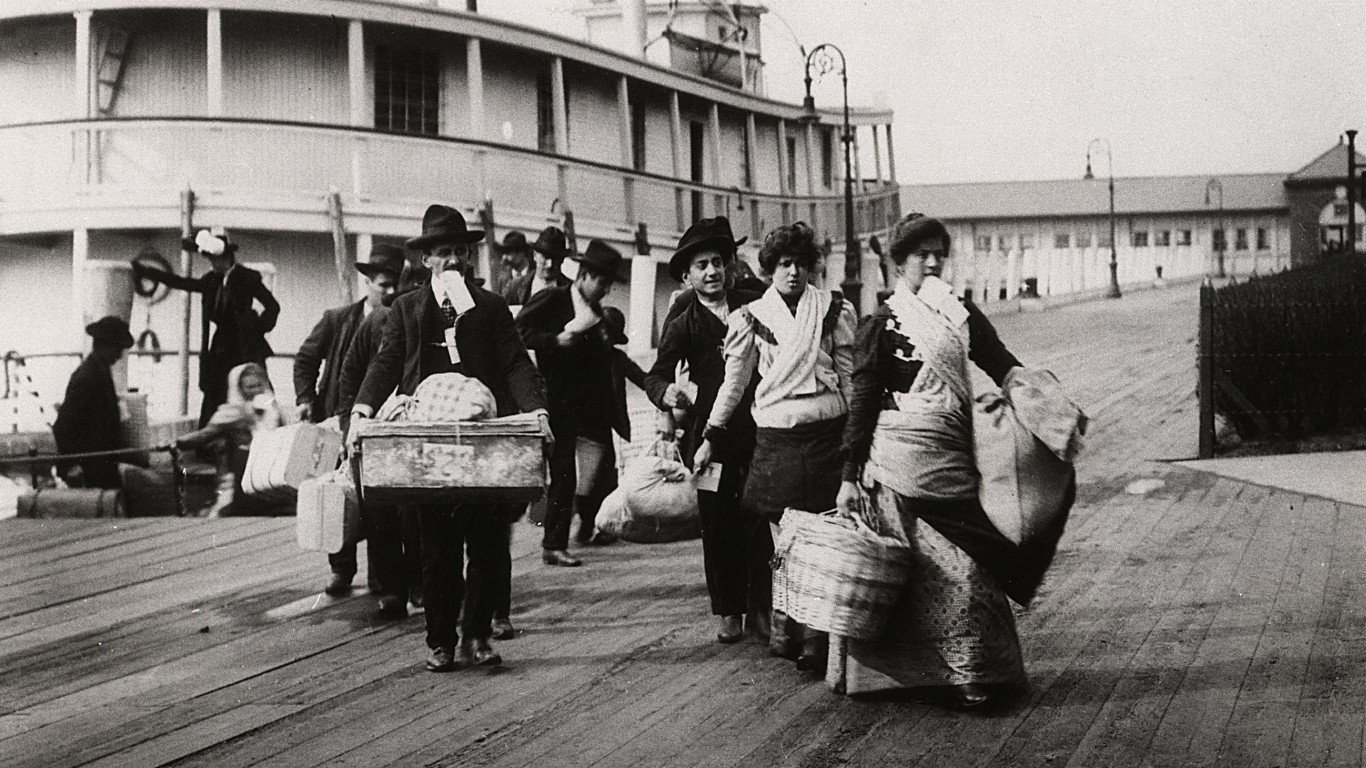
Perceived as a land of opportunity, the United States has always attracted migrants from around the world who settled together in a nation now commonly referred to as the Great Melting Pot. While social and political tensions often surround the topic of immigration, foreign-born citizens are an integral part of the American way of life. According to the latest Census, nearly 94% of the U.S. population identifies primarily with a demographic group other than “American.”
Not only is the U.S. population remarkably diverse, but also the level of diversity varies considerably between states. Based on Census data, 24/7 Wall St. reviewed the percentage of state residents who identify as one of 158 different ethnicities — the most common answers to the ancestry question. Survey respondents were not given a list of options. The largest percentage relative to the comparable national proportion is a state’s most unusual ancestry.
Click here to see the most unusual ancestry in every state.
A state’s most unusual ethnic group is not necessarily the state’s largest demographic. In fact, the most unique heritage group in only three states made up more than 10% of that state’s population. In every other case, members of the most unusually concentrated demography accounted for less than 1% of state residents. However, that demographic accounts for an even — and often much smaller — share of the U.S. population.
In Texas, for example, nearly a third of the population identifies as primarily Mexican in origin. While this percentage is more than three times the nationwide proportion of residents with Mexican ancestry, it is not the state’s most unusual ancestry. The most unique heritage in Texas is the group of people who identifies most strongly as Texan, who together make up nearly 79% of country residents who most closely identify as Texan, but less than 1% of the state’s population.
While many U.S. residents can trace their families back many generations in America, “almost all Americans owe their being here to immigration,” said Hasia Diner, professor of history at New York University. Diner added that while the origins of immigrants have changed over the years — from Europe for over a century to many other countries since the 1970s — relocating to the United States remains a similar phenomenon now as it was then. “Almost all migrations are economically driven,” she said.
Immigration patterns can be largely explained either by economic opportunities attracting people to a destination, or by economic hardships pushing people out from the country of origin. And often, both factors are at work. Many Chaldeans living in Michigan, for example, can trace their ancestry to Iraqi immigrants fleeing economic and political turmoil in the 1970s. At that time, Detroit had a vibrant economy and attracted much of that immigration wave. Today, it is home to the largest Chaldean population in the world outside of Iraq.
Personal history certainly contributes to one’s identity. However, as Diner observed, “Somebody’s whose grandparents migrated in 1890 has a different relationship to Italy than someone whose parents came in the 1960s.” Not only are the relationships often quite different for two people identifying with the same ancestry, but also the reasons for doing so may be quite diverse. Diner suggested there may be “a psychological need to have something distinctive and something they can call their own.”
Another driver behind a particularly high concentration of a given ancestry is simply how close a country is to the state. Quebec, home to much of the French-speaking Canadian population, borders Vermont, where the most unusually concentrated ancestry is French Canadian. Similarly, with the Bahamas just off the southern coast of Florida, it may not be surprising that Bahamians are the most unusually concentrated demographic in the state.
To identify the most unusual ancestry in every state, 24/7 Wall St. reviewed the underlying micro data from the ancestry question in the 2013 American Community Survey (ACS), the most recent ancestry-related ACS data available. The question is based on self-identification and answers represent ancestry groups with which people most closely identify. The 158 demographic groups for which data are available are the most frequently cited answers to the Census’ ancestry question. The most unusually concentrated ancestry in each state was determined by calculating the location quotient for each ancestry category and taking the largest ratio. For example, if 20% of a state’s population identifies as Canadian, and 10% of the U.S. population identifies as Canadian, then the location quotient for Canadians in that state is 2.0. And if this is the largest location quotient, then this ancestry is the most unusual one in that state.
These are the most unusually concentrated ancestries in every state.
1. Alabama
> Location quotient of ancestry: 2.6
> Most unique ancestry: Indian
> Percentage of state residents identifying as Indian: 0.8%
> Share of U.S. Indian population living in state: 3.6%
Of the roughly 846,000 U.S. citizens who claim Indian ancestry, nearly 31,000 live in Alabama. While Alabama is home to larger populations of several other ancestries, including American Indian, Scotch Irish, and English, the share of citizens claiming Indian heritage is higher than it is across the rest of the country. Apart from Alabama, the other states with relatively high concentrations of people with Indian ancestry are contiguous. West Virginia, Kentucky, Missouri, Arkansas, and Oklahoma all have high relatively high concentrations of Indian residents.
ALSO READ: States With the Widest Gap Between the Rich and Poor
2. Alaska
> Location quotient of ancestry: 351.3
> Most unique ancestry: Eskimo
> Percentage of state residents identifying as Eskimo: 7.8%
> Share of U.S. Eskimo population living in state: 84.0%
Of the 60,830 Americans who claim Eskimo heritage, 84% live in Alaska. Some 51,107 Alaskans claim Eskimo ancestry, or 7.8% of the state’s total population. The name “Eskimo” is believed to mean “to net snowshoes.” While people of similar heritage outside of the United States prefer the Inuit designation, Eskimo is still commonly used in Alaska.
3. Arizona
> Location quotient of ancestry: 6.4
> Most unique ancestry: Assyrian
> Percentage of state residents identifying as Assyrian: 0.1%
> Share of U.S. Assyrian population living in state: 13.5%
Although just 0.1% of Arizona residents identify as Assyrian, it is the most unique heritage in the state. America is home to just 38,626 Assyrians, and 13.5% of them live in Arizona. There were two large waves of Assyrian immigration to the United States from Turkey, Iran, and Iraq. The first occurred as World War I began and the second during the Middle East turmoil in the 1970s. Assyrian refugees relocated mostly to Chicago, Detroit, and Northern California, where some Assyrian American settlers had established communities before WWI. More recently, Assyrian American families — mostly those already living in the United States — have migrated to Arizona. Arizona is also home to relatively high concentrations of residents with Eritrean, Basque, and American Indian ancestry.
4. Arkansas
> Location quotient of ancestry: 5.1
> Most unique ancestry: Indian
> Percentage of state residents identifying as Indian: 1.6%
> Share of U.S. Indian population living in state: 4.3%
Roughly one-third of 1% of the American population identifies as Indian. In Arkansas, 1.6% of state residents claim Indian heritage, or about 4.3% of the roughly 846,000 Americans who identify as Indian. Arkansas is part of a chain of contiguous states that also have relatively high concentrations of residents identifying as Indian. Arkansas is also home to relatively highly concentrated populations of residents with Laotian ancestry and of American Indians.
ALSO READ: America’s Most (and Least) Expensive Cars
5. California
> Location quotient of ancestry: 6.2
> Most unique ancestry: Fijian
> Percentage of state residents identifying as Fijian: 0.1%
> Share of U.S. Fijian population living in state: 79.2%
Nearly 80% of the roughly 22,900 Americans who claim Fijian heritage live in California. Despite the state’s relatively high share of Fijian residents, only 0.05% of California’s total population is Fijian. While more than 10 million Californians claim Mexican heritage, with a location quotient of 2.8, the state’s Mexican population is more in line with the country’s Mexican population. The only other state with a relatively high concentration of people with Fijian ancestry is Oregon, California’s neighbor to the north.
6. Colorado
> Location quotient of ancestry: 3.4
> Most unique ancestry: Spanish
> Percentage of state residents identifying as Spanish: 3.1%
> Share of U.S. Spanish population living in state: 5.7%
Colorado is one of four states in the Southwest and Rocky Mountain regions with a relatively high concentration of residents who claim Spanish heritage. The 141,843 state residents identifying as Spanish make up 3.1% of Colorado’s total population. Meanwhile, the roughly 2.5 million Americans who claim Spanish heritage make up less than 1% of the total national population. Though a much larger population of people with German and English heritage live in Colorado, proportionally, their share of the state’s total population lines up closer with the national share.
7. Connecticut
> Location quotient of ancestry: 5.5
> Most unique ancestry: Albanian
> Percentage of state residents identifying as Albanian: 0.3%
> Share of U.S. Albanian population living in state: 6.4%
Nearly 6.5% of the U.S. population who claim Albanian heritage lives in Connecticut. While residents with Albanian ancestry make up only 0.3% of the state’s total population, that amount is 5.5 times greater than the percentage of Americans with Albanian ancestry. People who claim heritage from the Balkan nation are also concentrated in Massachusetts, New York, Michigan, and Illinois.
ALSO READ: 10 Teams With the Longest Championship Droughts
8. Delaware (Mike) done
> Location quotient of ancestry: 3.9
> Most unique ancestry: Pennsylvania German
> Percentage of state residents identifying as Pennsylvania German: 0.3%
> Share of U.S. Pennsylvania German population living in state: 1.1%
Delaware is located just to the south of Pennsylvania, which explains why it has such a high concentration of Pennsylvania Germans, also often referred to as Pennsylvania Dutch. This cultural group began immigrating to the United States from Germany in the late 17th century and settled mostly in Pennsylvania. Segments of the group would eventually resettle in other parts of the country, including neighboring Ohio and Delaware. Today, the share of Pennsylvania Germans in Delaware is four time the share of the group out of America’s total population.
9. Florida
> Location quotient of ancestry: 11.4
> Most unique ancestry: Bahamian
> Percentage of state residents identifying as Bahamian: 0.2%
> Share of U.S. Bahamian population living in state: 70.8%
Florida is home to nearly 71% of the 37,561 U.S. residents who identify as Bahamian. It is perhaps no surprise that the vast majority of residents with Bahamian ancestry end up in Florida as The Bahamas is located just off the southeastern coast of the state. Similarly, U.S. residents identifying as Cubans are particularly concentrated in Florida, which is the closest state to Cuba.
ALSO READ: Countries With the Best Jobs
10. Georgia
> Location quotient of ancestry: 4.3
> Most unique ancestry: Bhutanese
> Percentage of state residents identifying as Bhutanese: 0.1%
> Share of U.S. Bhutanese population living in state: 13.5%
The Kingdom of Bhutan is a small, landlocked country in South Asia. It is also the nation of origin for the ancestry of roughly 33,000 Americans. About 4,500 Americans who claim Bhutanese heritage live in Georgia, making it the most unique ancestry in the Peach State. While New York, Pennsylvania, Ohio, and Indiana all have relatively high concentrations of residents with Bhutanese ancestry, only in Georgia does the heritage has the highest share compared to its national share.
11. Hawaii
> Location quotient of ancestry: 128.6
> Most unique ancestry: Okinawan
> Percentage of state residents identifying as Okinawan: 0.6%
> Share of U.S. Okinawan population living in state: 60.7%
The U.S. Okinawan population, totalling just 13,184 individuals, is very small. Okinawans are native to a small island prefecture of Japan in the East China Sea — close to a 14-hour plane ride from Hawaii. While the group is the most concentrated compared with other ethnicities in Hawaii, Okinawans make up a relatively small share, less than 1%, of the state’s population. Still, nearly 61% of all Okinawans living in the United States reside in Hawaii.
12. Idaho
> Location quotient of ancestry: 34.0
> Most unique ancestry: Basque
> Percentage of state residents identifying as Basque: 0.6%
> Share of U.S. Basque population living in state: 16.7%
People claiming Basque heritage trace their roots to northern Spain and southern France, to regions around the Bay of Biscay and along the Pyrenees Mountains. The Basque people trace their roots as far back as 5,500 years ago to regions in northern Spain and southern France around the Bay of Biscay and along the Pyrenees Mountains. Today, roughly 44,600 American claim Basque ancestry. Of all the Americans with Basque ancestry, 16.7% live in Idaho, making Basque the most unique ancestral group in the state. All other states with relatively high concentrations of residents with Basque ancestry, including Arizona, California, and Oregon, are clustered in the western United States.
ALSO READ: The Most Educated City in Every State
13. Illinois
> Location quotient of ancestry: 6.7
> Most unique ancestry: Assyrian
> Percentage of state residents identifying as Assyrian: 0.1%
> Share of U.S. Assyrian population living in state: 27.8%
Although just 0.1% of Illinois residents identify as Assyrian, it is 10 times the 0.01% of Americans who do, making Assyrian the most unique heritage in the state. America is home to just 38,626 Assyrians, and 27.8% of them live in Illinois. Assyrian immigrants came to the United States in two large waves — the first concurrent with start of World War I and the second with turmoil in the Middle East during the 1970s. Assyrian refugees relocated mostly to Chicago, Detroit, and Northern California, where some Assyrian American settlers and sojourners had established communities before WWI. Today, Chicago is home to the largest Assyrian population in the country, and the second largest in the world after Iraq. Illinois is also home to high relative concentrations of residents with Luxemburger, Palestinian, and Jordanian ancestry.
14. Indiana
> Location quotient of ancestry: 5.9
> Most unique ancestry: Macedonian
> Percentage of state residents identifying as Macedonian: 0.1%
> Share of U.S. Macedonian population living in state: 11.3%
The most common origin of ancestry in Indiana is German — which accounts for 22.2% of the state’s population, about double the U.S. share of Germans out of the total population. However, German is not the most uniquely concentrated heritage group in the Hoosier State. Rather, that title goes to those of Macedonian descent. Macedonia, which is located just north of Greece, has a population of only about 2 million people, and Americans who claim Macedonian ancestry also make up a very small share of the U.S. population — barely 0.01%. However, in Indiana, there are nearly six times as many ethnic Macedonians per capita as there are nationwide.
ALSO READ: The Best Countries in which to Grow Old
15. Iowa
> Location quotient of ancestry: 18.7
> Most unique ancestry: Sudanese
> Percentage of state residents identifying as Sudanese: 0.3%
> Share of U.S. Sudanese population living in state: 17.4%
Although just 0.3% of Iowa residents identify as Sudanese, the state has the largest Sudanese population in the country. Of the 38,516 American citizens who identify as Sudanese, 6,698 live in Iowa. Sudanese refugees began to emigrate to Iowa in the 1990s because of the turmoil in the Darfur region of Sudan, and they continued to relocate there as the conflict escalated. Sudanese refugees have also emigrated to Iowa’s neighbors, Illinois and Nebraska. Iowa is also home to high concentrations of residents with Luxemburger, Bosnian and Herzegovinian, and Bohemian heritages.
16. Kansas
> Location quotient of ancestry: 4.8
> Most unique ancestry: Kenyan
> Percentage of state residents identifying as Kenyan: 0.1%
> Share of U.S. Kenyan population living in state: 4.3%
While neighboring states often have high concentrations of the same ancestries, this is not the case with states that have relatively high concentrations of residents with Kenyan ancestry. Kansas, Massachusetts, Minnesota, New Jersey, and Texas, which have the highest shares of people with Kenyan ancestry, are spread from New England to the Southwest. Kansas, however, is the only state where Kenyan is the most unique heritage. Of the roughly 65,000 Americans who claim Kenyan ancestry, about 2,800 live in Kansas.
ALSO READ: The Worst States for Women
17. Kentucky
> Location quotient of ancestry: 9.7
> Most unique ancestry: Appalachian
> Percentage of state residents identifying as Appalachian: 0.1%
> Share of U.S. Appalachian population living in state: 12.1%
Most Americans responded to the U.S. Census Bureau’s survey on ancestry with a specific country of origin. There were some notable exceptions, however, including a sizeable share of residents identifying simply as American. Another interesting exception is the roughly 18,500 who identify as Appalachian. Not surprisingly, the largest share — 12.1% — live in the Appalachian state of Kentucky. The state has roughly 10 times the per capita share of Appalachians than the U.S. as a whole.
18. Louisiana
> Location quotient of ancestry: 38.4
> Most unique ancestry: Cajun
> Percentage of state residents identifying as Cajun: 1.4%
> Share of U.S. Cajun population living in state: 56.3%
Just 1.4% of Louisiana residents identify as Cajun, but that percentage is 38.4 times greater than the proportion of Americans nationwide who identify as part of the ethnic group — reflecting a greater concentration than any other group in the state. Many Louisiana residents who identify as Cajun are likely descendants of French settlers who travelled to present-day Louisiana in the 17th century from Acadia, now known as Nova Scotia.
ALSO READ: 10 Cities Where You Don’t Want to Get Sick
19. Maine
> Location quotient of ancestry: 14.5
> Most unique ancestry: French Canadian
> Percentage of state residents identifying as French Canadian: 8.1%
> Share of U.S. French Canadian population living in state: 6.0%
All the states in the country where French Canadian is the most unique heritage are contiguous, located in New England, and border Quebec. One such state, Maine, is home to 6.0% of America’s 1.5 million residents who claim French Canadian ancestry. French is the official language of the Canadian province of Quebec, which was originally known as New France, .
20. Maryland
> Location quotient of ancestry: 10.8
> Most unique ancestry: Cameroonian
> Percentage of state residents identifying as Cameroonian: 0.1%
> Share of U.S. Cameroonian population living in state: 20.1%
The largest share of Maryland’s residents trace back their ancestry to German roots. Residents with Irish and English ancestry make up the next largest groups in the state. However, these are all common countries of origin nationwide. The most unique country of origin claimed by a high share state residents is Cameroon, a Central African nation. Maryland has more than 10 times the per capita share of residents who identify as Cameroonians than the country as a whole. Roughly one in five Americans of Cameroonian ancestry resides in the Mid-Atlantic state.
21. Massachusetts
> Location quotient of ancestry: 26.5
> Most unique ancestry: Cape Verdean
> Percentage of state residents identifying as Cape Verdean: 0.9%
> Share of U.S. Cape Verdean population living in state: 57.9%
Well over half of all Americans who claim Cape Verdean heritage call Massachusetts home. A small island nation a few hundred miles off the coast of Senegal, Cape Verde is home to roughly half a million people. Cape Verdeans have a long history in the United States, and in Massachusetts in particular. Whaling ships leaving from New Bedford and Nantucket often employed Cape Verdeans. It is estimated that between 1825 and 1875, roughly 100 whaling ships would stop at Cape Verde annually.
ALSO READ: Companies Paying Americans the Least
22. Michigan
> Location quotient of ancestry: 23.4
> Most unique ancestry: Chaldean
> Percentage of state residents identifying as Chaldean: 0.5%
> Share of U.S. Chaldean population living in state: 72.8%
Of the 0.02% of American citizens who identify as Chaldean, 72.8% reside in Michigan. The Chaldeans, who primarily hail from the town of Telkaif in Iraq, first came to America around 1910 and settled in Detroit. In the 1970s, the largest wave of Chaldeans immigrants came to Detroit due to political turmoil in the Middle East. The Chaldeans were originally attracted to Detroit for its automobile industry, and today they dominate the city’s grocery trade. Detroit is now home to the largest Chaldean population in the world outside of Iraq. Michigan also has relatively high concentrations of residents with Maltese, Macedonian, and Yemeni ancestry.
23. Minnesota
> Location quotient of ancestry: 21.8
> Most unique ancestry: Somali
> Percentage of state residents identifying as Somali: 0.9%
> Share of U.S. Somali population living in state: 38.1%
Minnesota is perhaps better known for its sizeable Norwegian population, of which it has roughly 10 times the national per capita share. However, those tracing their ancestry to Somalia are even more concentrated in the northern state. More than 38% of U.S. residents with Somali heritage live in Minnesota, and there are nearly 22 times the number of Somalis per capita in Minnesota than there are in the nation as a whole.
ALSO READ: The Healthiest City in Each State
24. Mississippi
> Location quotient of ancestry: 2.0
> Most unique ancestry: Indian
> Percentage of state residents identifying as Indian: 0.6%
> Share of U.S. Indian population living in state: 1.8%
Of the four states where Indian is the most unique ancestry, Mississippi has the smallest Indian population. Only 15,255 of the 846,177 Americans who identify as having Indian ancestry call Mississippi home. Still, the share of Mississippi residents who claim Indian ancestry is double the corresponding national share. Arkansas, one of Mississippi’s neighbors to the west, also has a higher than average share of residents who identify as Indian.
25. Missouri
> Location quotient of ancestry: 6.3
> Most unique ancestry: Bosnian and Herzegovinian
> Percentage of state residents identifying as Bosnian and Herzegovinian: 0.3%
> Share of U.S. Bosnian and Herzegovinian population living in state: 11.2%
Only 125,627 residents nationwide identify as Bosnian Herzegovinian, or 0.05% of the U.S. population. Of those, 11.2% reside in Missouri. Following the breakup of former Yugoslavia and the ensuing conflict, a significant wave of Bosnian Herzegovinians came in the 1990s as refugees to the United States. A majority of these refugees settled in St. Louis, which now has more residents of Bosnian Herzegovinian ancestry per capita than anywhere in the world outside of Bosnia and Herzegovina itself. Many of these residents live in the St. Louis neighborhood Little Bosnia.
26. Montana
> Location quotient of ancestry: 7.4
> Most unique ancestry: Norwegian
> Percentage of state residents identifying as Norwegian: 8.0%
> Share of U.S. Norwegian population living in state: 2.3%
There are around 3 million U.S. residents who identify as Norwegian. Of this group, nearly 70,000 live in Montana, making up 8% of the state’s population — 7.4 times greater than the national concentration of Norwegian Americans. North and South Dakota, Minnesota, and Wisconsin also have especially high concentrations of Americans with Norwegian ancestry. Together, these states account over one third of the nation’s population with Norwegian heritage. Norway’s ties to the midwest stem from religious persecution and economic concerns in 19th century Norway — between 1825 and 1925 roughly two-thirds of Norway’s population immigrated to North America.
ALSO READ: America’s Most Segregated Cities
27. Nebraska
> Location quotient of ancestry: 15.7
> Most unique ancestry: Sudanese
> Percentage of state residents identifying as Sudanese: 0.2%
> Share of U.S. Sudanese population living in state: 9.1%
Although just 0.2% of Nebraska residents identify as Sudanese, it is the most unique heritage in the state. Of the 38,516 American citizens who identify as Sudanese, 3,516 — the second largest Sudanese population in the country — reside in Nebraska. Sudanese refugees began to emigrate to Nebraska in the 1990s because of turmoil in the Darfur region of Sudan, and continued to relocate there as the conflict escalated. Sudanese also settled in Nebraska’s neighbor, Iowa. Nebraska also has relatively high concentrations of residents with Bohemian, Czech (and Czechoslovakian), and Nepali heritages.
28. Nevada
> Location quotient of ancestry: 5.3
> Most unique ancestry: Basque
> Percentage of state residents identifying as Basque: 0.1%
> Share of U.S. Basque population living in state: 4.9%
Only 44,626 residents nationwide identify as Basque, or 0.02% of the U.S. population. Of those, 4.9% reside in Nevada, making Basque the most unique heritage in the state. The first Basque immigrants arrived in Nevada in the mid-19th century as prospectors in the gold rush and eventually settled in the northern part of the state as sheepherders. Today, many Basques operate hotels originally used to house winter herders throughout the region. There are high concentrations of Basques throughout much of the western U.S., particularly in Arizona, California, Oregon, and Idaho. Nevada is also home to relatively high concentrations of residents with Bulgarian, Chamorro, and Samoan ancestry.
ALSO READ: 10 States Draining the Country’s Energy
29. New Hampshire
> Location quotient of ancestry: 13.1
> Most unique ancestry: French Canadian
> Percentage of state residents identifying as French Canadian: 7.3%
> Share of U.S. French Canadian population living in state: 5.7%
Together with Maine and Vermont, New Hampshire is part of a U.S. region that has a high concentration of residents who identify as French-Canadian. The tri-state region is home to New England French, a dialect of the French language unique to the United States. Just 0.6% of the U.S. population identifies as French Canadian — about 1.5 million citizens — and 5.7% of them live in New Hampshire, making French Canadian the most unique heritage in the state. There was a major wave of French-Canadian immigration in the 19th century, when many migrated from Quebec to work in factories in Manchester. By the turn of century, about 60% of textile workers in the state were French-Canadian.
30. New Jersey
> Location quotient of ancestry: 7.6
> Most unique ancestry: Uruguayan
> Percentage of state residents identifying as Uruguayan: 0.1%
> Share of U.S. Uruguayan population living in state: 22.4%
Very few New Jersey residents claim Uruguayan ancestry. However, while the 7,870 residents with Uruguayan heritage make up just 0.1% of the state’s population, this was more concentrated relative to the national proportion than any other ethnic group in New Jersey. More than 22% of all Americans claiming Uruguayan heritage live in New Jersey. Uruguayan immigration to the United States peaked in the 1960s and 1970s during an economic downturn in Uruguay. From the early 1970s through 1985, the Uruguayan constitution was suspended for a period of oppressive military rule, which also contributed to the immigration. New York City and Long Island were also popular destinations for Uruguayan immigrants.
31. New Mexico
> Location quotient of ancestry: 11.8
> Most unique ancestry: Spanish
> Percentage of state residents identifying as Spanish: 10.8%
> Share of U.S. Spanish population living in state: 8.0%
Unlike the most unique heritages of many states, those with Spanish ancestry in New Mexico are indigenous to the state, having settled in the region before it was annexed by the United States. The Spanish first colonized the area in the 16th century, after conquistadors declared the land habitable. Mexico ceded the land to the United States in the mid-19th century, and as part of the Treaty of Guadalupe Hidalgo, area residents received American citizenship and were assured civil rights to preserve Spanish culture. Today, more than one in 10 New Mexico residents identify as Spanish and make up 8% of the total U.S. Spanish population. Neighboring states, such as Arizona, Colorado, and Texas also have high concentrations of residents with Spanish ancestry.
32. New York
> Location quotient of ancestry: 11.0
> Most unique ancestry: Grenadian
> Percentage of state residents identifying as Grenadian: 0.1%
> Share of U.S. Grenadian population living in state: 70.2%
New York City, where close to half of New York state residents live, is one of the most diverse regions in the country. Over the last several centuries, the city has been a major destination for immigrants seeking economic opportunities in the United States. New York residents who identify as Italian are the largest group, making up 12.1% of survey respondents. However, residents of Caribbean origin — Grenada in particular — are the most concentrated compared to the nation.
ALSO READ: The Worst Cities for Black Americans
33. North Carolina
> Location quotient of ancestry: 6.9
> Most unique ancestry: Ugandan
> Percentage of state residents identifying as Ugandan: 0.0%
> Share of U.S. Ugandan population living in state: 20.9%
More than one in five residents nationwide who identify as Ugandan lives in North Carolina. Although this amounts to just 2,674 residents with Ugandan heritage and 0.03% of North Carolina’s population, it is the largest share of residents with Ugandan ancestry of any state and the most unique heritage in North Carolina. There was a significant wave of Ugandan immigration in the 1970s, when many came to the United States as refugees during Idi Amin’s military regime. North Carolina is also home to high concentrations of residents tracing their lineage to other African nations such as Sierra Leone and Senegal.
34. North Dakota
> Location quotient of ancestry: 35.4
> Most unique ancestry: Icelander
> Percentage of state residents identifying as Icelander: 0.4%
> Share of U.S. Icelander population living in state: 8.3%
While just 0.4% of North Dakota residents identify as Icelanders, they make up 2,594 of the 31,160 Americans who do nationwide. A significant wave of Icelanders came to North America between 1870 and 1900, settling in Wisconsin, Minnesota, the Dakotas, and Canada. Today, other states with relatively high concentrations of residents with Icelandic ancestry are Utah, Oregon, Washington, and California. North Dakota is also home to relatively high concentrations of residents with German and Norwegian ancestry.
ALSO READ: The Most Dangerous Cities in America
35. Ohio
> Location quotient of ancestry: 9.2
> Most unique ancestry: Slovene
> Percentage of state residents identifying as Slovene: 0.4%
> Share of U.S. Slovene population living in state: 32.5%
Nearly one-third of all Slovene Americans live in Ohio. The majority of Slovene immigrants came to America between 1870 and 1924 and settled across the country in industrial urban centers and rural farming towns. Cleveland was the most popular destination for Slovene settlers and had the largest Slovene population in the United States from 1900 to the 1990s. Today, many states with high concentrations of Slovene Americans are those where the first immigrants settled, such as Pennsylvania and Illinois. Ohio is also home to relatively high concentrations of residents with Appalachian and Slovak heritages.
36. Oklahoma
> Location quotient of ancestry: 7.3
> Most unique ancestry: American Indian
> Percentage of state residents identifying as American Indian: 14.1%
> Share of U.S. American Indian population living in state: 8.4%
Oklahoma has the largest share of American Indian residents in the country. More than 14% of Oklahoma residents identify as American Indian, or 8.4% of the total U.S. American Indian population. Unlike many of the most unique heritages in a state, the American Indian population is indigenous to Oklahoma. American Indian populations were forcibly relocated by European settlers as early as the 15th century, and their location today is largely dictated by state and federal policies. Unlike those in other parts of the country, most Oklahoman tribes were able to stay within the state, and others from east of the Mississippi were relocated there as well.
ALSO READ: The Best Economies in the World
37. Oregon
> Location quotient of ancestry: 8.4
> Most unique ancestry: Congolese
> Percentage of state residents identifying as Congolese: 0.1%
> Share of U.S. Congolese population living in state: 10.4%
Although just 2,249 Oregon residents identify as Congolese, this number represents more than 10% of the 21,668 nationwide residents who identify similarly, making it the most unique heritage in the state. Like many of those with African ancestry, the first Congolese came to the United States as slaves in the 17th century. More recently, Congolese have come to America as refugees from the region’s political turmoil.
38. Pennsylvania
> Location quotient of ancestry: 11.5
> Most unique ancestry: Pennsylvania German
> Percentage of state residents identifying as Pennsylvania German: 1.0%
> Share of U.S. Pennsylvania German population living in state: 46.4%
Of the 231,474 U.S. citizens who identify as Pennsylvania German, nearly half of them live in Pennsylvania. At one point, all Pennsylvania Germans lived in Pennsylvania, as the ancestral designation is the product of immigrants from southwest Germany who settled in the state in the late 17th and 18th centuries. Pennsylvania Germans have since migrated to other states, and they are highly concentrated in Delaware, Ohio, and Indiana today. Pennsylvania Germans speak a dialect of the German language, which is popular amongst Amish communities.
39. Rhode Island
> Location quotient of ancestry: 60.1
> Most unique ancestry: Cape Verdean
> Percentage of state residents identifying as Cape Verdean: 2.1%
> Share of U.S. Cape Verdean population living in state: 20.9%
Just 2.1% of Rhode Island residents identify as Cape Verdean, but nearly 21% of all individuals reporting such heritage nationwide live in the state. One of the only museums dedicated to Cape Verdean culture is in East Providence. According to the museum’s exhibit, most Cape Verdean-Americans owe their ancestry to whalers and seasonal cranberry farm workers migrating to New England.
ALSO READ: Cities Spending the Most per Student
40. South Carolina
> Location quotient of ancestry: 2.2
> Most unique ancestry: Scotch Irish
> Percentage of state residents identifying as Scotch Irish: 2.6%
> Share of U.S. Scotch Irish population living in state: 3.1%
Although just 2.6% of South Carolina residents identify as Scotch Irish, they comprise over 3% of the roughly 3.3 million residents reporting such heritage nationwide. The Scotch Irish originally came to South Carolina in the 18th century via the Great Wagon Road, a trail leading from Pennsylvania to Georgia that left settlers in states along the way. Today, other states with high concentrations of Scotch Irish communities are North Carolina, Tennessee, and West Virginia.
41. South Dakota
> Location quotient of ancestry: 10.6
> Most unique ancestry: Norwegian
> Percentage of state residents identifying as Norwegian: 11.5%
> Share of U.S. Norwegian population living in state: 2.9%
More than one in 10 South Dakota residents identify as Norwegian. Norwegians began to immigrate heavily to the state in the 1860s, after the Dakota War displaced the state’s American Indian population and opened the land to other settlers. Subsequent waves of Norwegians crossed the Atlantic into America during the 19th century and settled throughout the Great Plains states. Other states with large concentrations of Norwegian Americans today are North Dakota, Minnesota, Montana, and Wisconsin.
42. Tennessee
> Location quotient of ancestry: 12.2
> Most unique ancestry: Kurdish
> Percentage of state residents identifying as Kurdish: 0.1%
> Share of U.S. Kurdish population living in state: 23.3%
While just 0.1% of Tennessee’s population identifies as Kurdish, this percentage is more than 12 times greater than the national proportion. Kurdistani Americans, 23.3% of which live in the state, appear to be far more concentrated in the state’s capital. Nashville has earned the nickname Little Kurdistan.
ALSO READ: The Poorest School Districts
43. Texas
> Location quotient of ancestry: 9.2
> Most unique ancestry: Texas
> Percentage of state residents identifying as Texas: 0.1%
> Share of U.S. Texas population living in state: 78.8%
Around 42,500 identify as Texan. Of this demographic, nearly 79% live in Texas — the only state in the country where people so strongly identifying with the state they currently live outweigh every other claim to ancestry. Those in the state with Mexican ancestry made up the next most-unique group, with 32.1% of Texas residents identifying as Mexican Americans, more than three times the national concentration.
44. Utah
> Location quotient of ancestry: 37.0
> Most unique ancestry: Tongan
> Percentage of state residents identifying as Tongan: 0.5%
> Share of U.S. Tongan population living in state: 33.5%
While fewer than 40,000 U.S. citizens identify as Tongan, about 13,200 of them — more than one-third — live in Utah. Tongans first came to America from the Oceanian country of Tonga in the 1960s after converting to Mormonism. They settled in Utah due to the Latter Day Saints church’s strong presence in the state. In addition, many Tongans came to America first by way of California or Hawaii, ultimately settling in Utah because of its relatively low cost of living. Today, Utah is also home to high concentrations of residents with Danish, Icelandic, and Samoan ancestry.
ALSO READ: 10 Cities Where You Don’t Want to Get Sick
45. Vermont
> Location quotient of ancestry: 14.8
> Most unique ancestry: French Canadian
> Percentage of state residents identifying as French Canadian: 8.3%
> Share of U.S. French Canadian population living in state: 2.9%
The percentage of Vermonters who identify as French Canadian — 8.3% — is nearly 15 times greater than the proportion of Americans who claim such roots. To this day, a large portion of Canada, particularly the province of Quebec, which borders Vermont, is home to people who speak French as their first language. A separatist movement that has advocated for Quebecois independence over the past century may strengthen the nationalist ties between the French Canadian diaspora.
46. Virginia
> Location quotient of ancestry: 12.7
> Most unique ancestry: Bolivian
> Percentage of state residents identifying as Bolivian: 0.4%
> Share of U.S. Bolivian population living in state: 32.9%
About 92,200 U.S. citizens identify as Bolivian, and roughly 30,400 of them — close to one-third — live in Virginia. This is the largest share of Bolivian Americans in any U.S. state. However, this share may be larger, as many Bolivians are undocumented. Many Bolivians came to America through Miami, Florida both seeking opportunity and fleeing their home country’s poor economic conditions. Bolivians have settled heavily along the East Coast, and today Rhode Island, Maryland, Florida, and New Jersey also have high concentrations of residents with Bolivian heritage.
47. Washington
> Location quotient of ancestry: 10.7
> Most unique ancestry: Moldavian
> Percentage of state residents identifying as Moldavian: 0.1%
> Share of U.S. Moldavian population living in state: 23.6%
While just 0.1% of Washington residents identify as Moldavian, they constitute about one-fourth of the roughly 18,900 Americans who identify similarly, making it the most unique heritage in the state. Moldovan emigration is a relatively recent phenomenon as it was only permitted once the country gained independence following the dissolution of the Soviet Union. Washington has the largest Moldavian population of any state, more than double that of California or New York. The state is also home to relatively high concentrations of residents identifying as Marshallese, Chamorro, and Eritrean.
ALSO READ: The Net Worth of Each Presidential Candidate
48. West Virginia
> Location quotient of ancestry: 6.0
> Most unique ancestry: Indian
> Percentage of state residents identifying as Indian: 1.9%
> Share of U.S. Indian population living in state: 2.9%
Of the roughly 846,200 Americans who identify as Indian, about 24,800 of them live in West Virginia. Although this is just 1.9% of the West Virginian population, it is 2.9% of the national population of those with Indian ancestry. Indians began immigrating to America as early as 1820, but the bulk of migrants came after immigration quotas were lifted by the Immigration and Nationality Act of 1965. Many Indians came even more recently, as the majority of Indian Americans were born in India. Arkansas, Kentucky, Missouri, and Oklahoma also high concentrations of residents who identify as Indian.
49. Wisconsin
> Location quotient of ancestry: 9.7
> Most unique ancestry: Hmong
> Percentage of state residents identifying as Hmong: 0.8%
> Share of U.S. Hmong population living in state: 18.0%
Some 224,100 U.S. residents identify as Hmong — just 0.1% of the country’s population — and 40,259 of them live in Wisconsin. As compensation for the Hmong cooperation with the U.S. military during the Vietnam War, the federal government granted the Hmong asylum in America when the conflict ended. Their settlement patterns were largely dictated by federal policy, and in 1975 the first Hmong came to Wisconsin. Other states with high concentrations of Hmong residents today are Minnesota, Wisconsin, and California.
ALSO READ: The Healthiest City in Each State
50. Wyoming
> Location quotient of ancestry: 4.7
> Most unique ancestry: Finnish
> Percentage of state residents identifying as Finnish: 0.7%
> Share of U.S. Finnish population living in state: 0.8%
More than one in five Wyoming residents have German ancestry. Wyoming is also home to disproportionately high shares of Americans who trace their ancestry back to Nordic countries. There are roughly three times the number of Danes and Norwegians per capita in the state relative to the nation as a whole. The most uniquely concentrated ancestry in the state, however, is the Finnish ancestry, with a location quotient of 4.7 in the state.