Throughout 2020, Americans gained a new appreciation for many previously overlooked laborers, as those delivering food, stocking shelves, and working cash registers were deemed essential workers amid the COVID-19 outbreak.
Yet even before COVID-19, there were millions of Americans working very dangerous jobs that make daily life possible. In 2019, 5,333 American workers were killed on the job. Nearly 3,000 of these injuries were suffered by workers in just 25 different career fields. In these career fields, workers are more than twice as likely to die on the job as the typical worker, making them the most dangerous jobs in the country.
To determine the 25 most dangerous jobs in America, 24/7 Wall St. reviewed fatal injury rates for dozens of occupations from the Bureau of Labor Statistics’ Census of Fatal Occupational Injuries program. These occupations are ranked based on the number of fatal injuries in 2019 per 100,000 full-time equivalent workers. Full-time equivalent workers is calculated using the number of hours worked in a particular job divided by the hours that would be worked equivalent to working 40 hours a week, 50 weeks in a year. These occupations are ranked based on the number of fatal injuries in 2019 per 100,000 full-time equivalent workers.
The majority of the careers on this list fall into three Bureau of Labor Statistics categories — farming, fishing, and forestry; construction and extraction; and installation, maintenance, and repair. These fields often require workers to use heavy machinery as well as work with dangerous animals and potentially hazardous chemicals.
Though these jobs are perilous, many have some benefits. The majority have an annual median wage of over $48,000 — well beyond the U.S. median wage for all jobs in 2019 of $39,810. Most also do not generally require a college education for entry into the field. These are the highest paying jobs you can get without a college degree.
Click here to see the 25 most dangerous jobs in America.
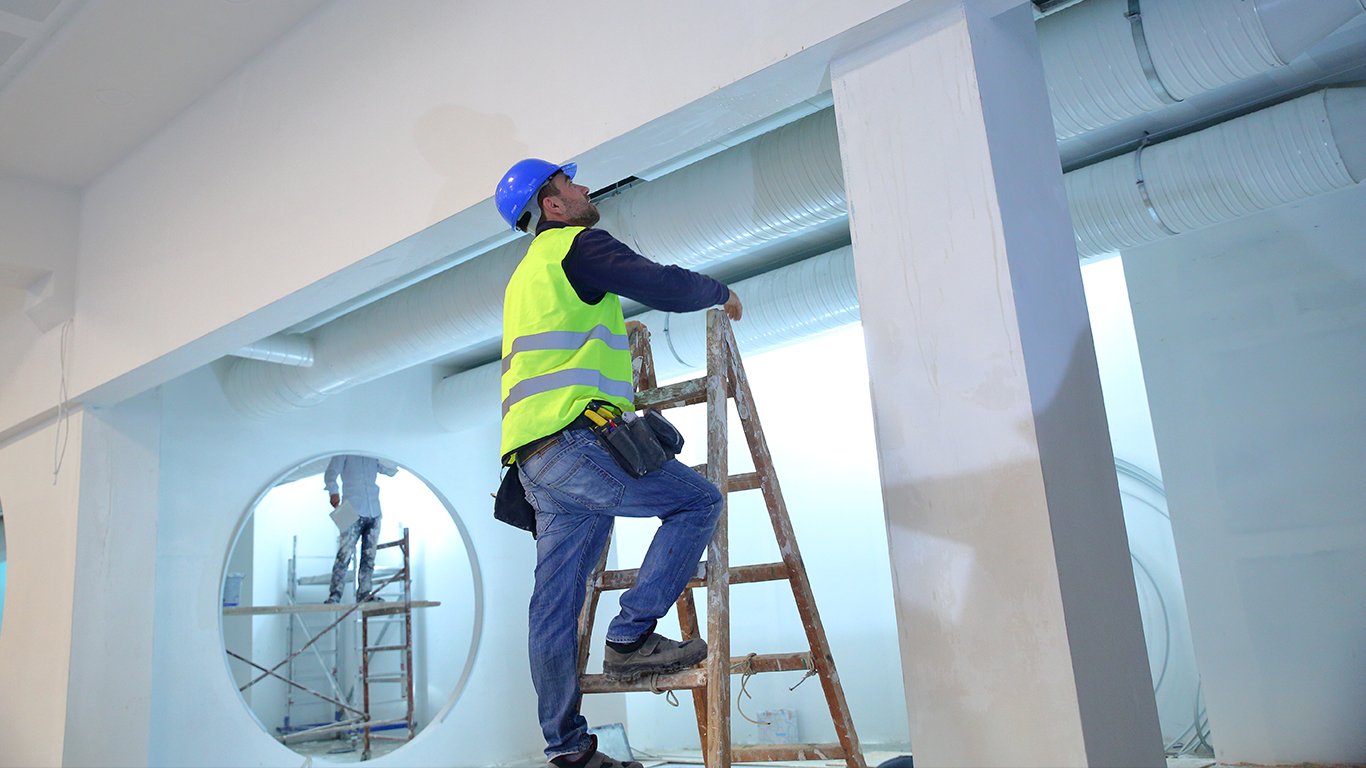
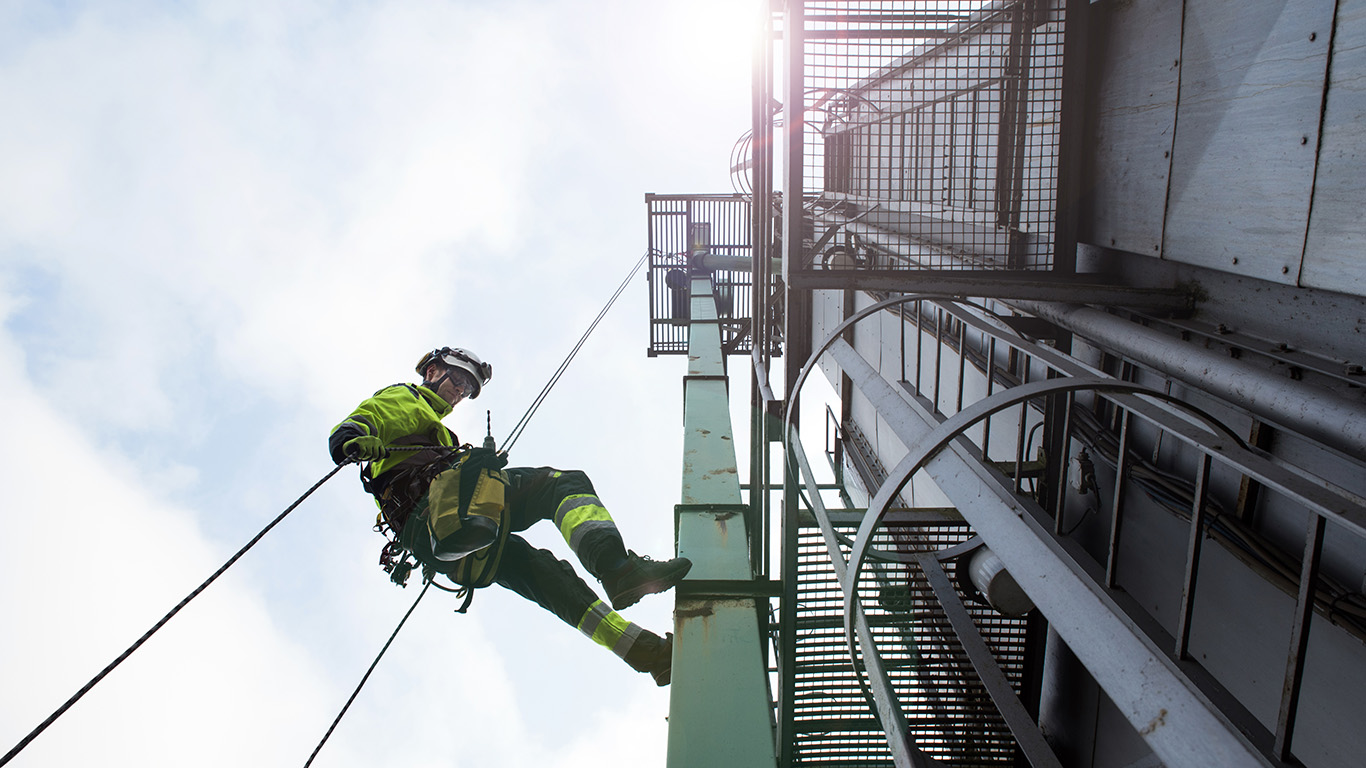
25. Painters, construction and maintenance
> 2019 fatal injury rate: 7.5 per 100,000 full-time equivalent workers
> Total injuries in 2019: 42 fatal injuries, 2,730 nonfatal injuries
> Most common cause of fatal injuries: Falls, slips, trips
> Median annual wage: $40,280
> Total employment: 232,760
Construction and maintenance painters paint large structures like buildings, bridges, equipment, and more. These painters often work in perilous situations, high up in the air. The occupation ranks as one of the 25 most dangerous jobs in America. There were 42 fatal injuries of construction painters in 2019, or 7.5 for every 100,000 full-time equivalent workers. Most of the fatalities were caused by falls.
[in-text-ad]
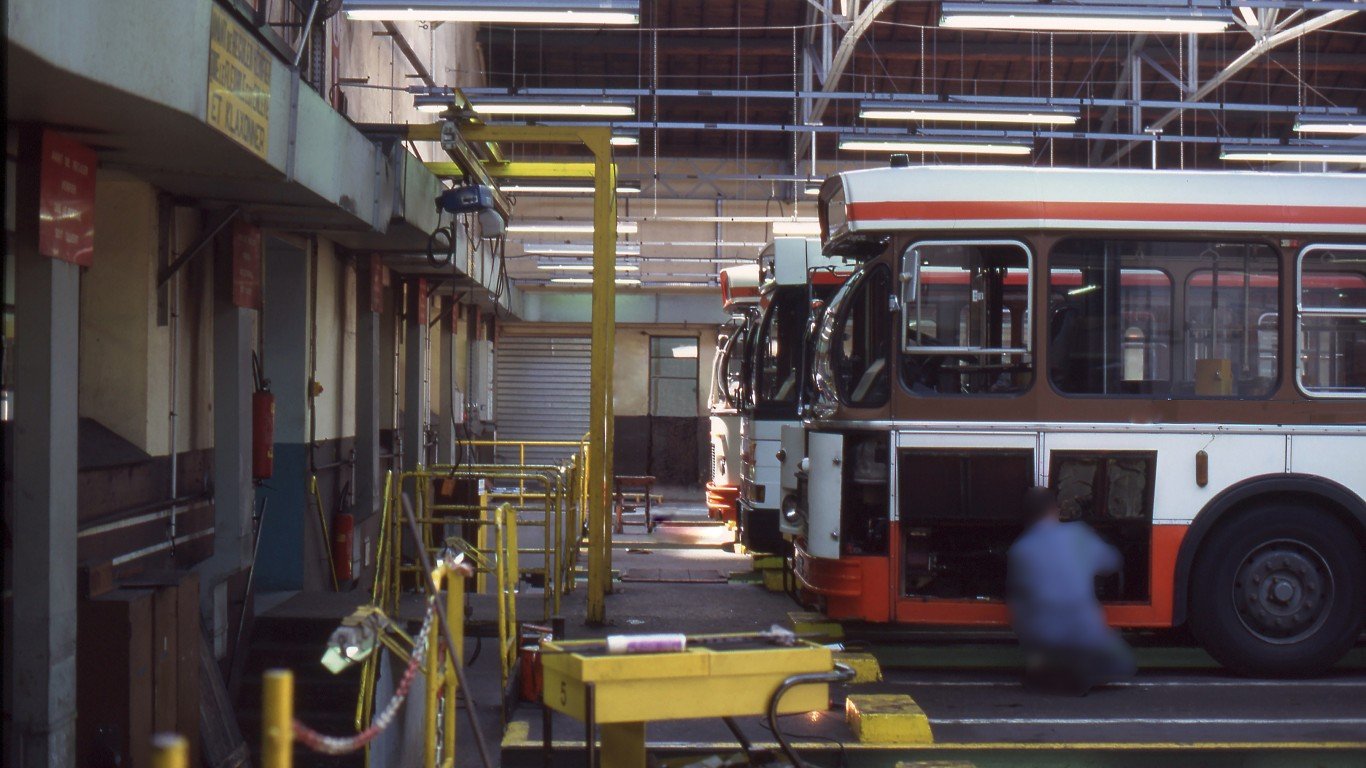
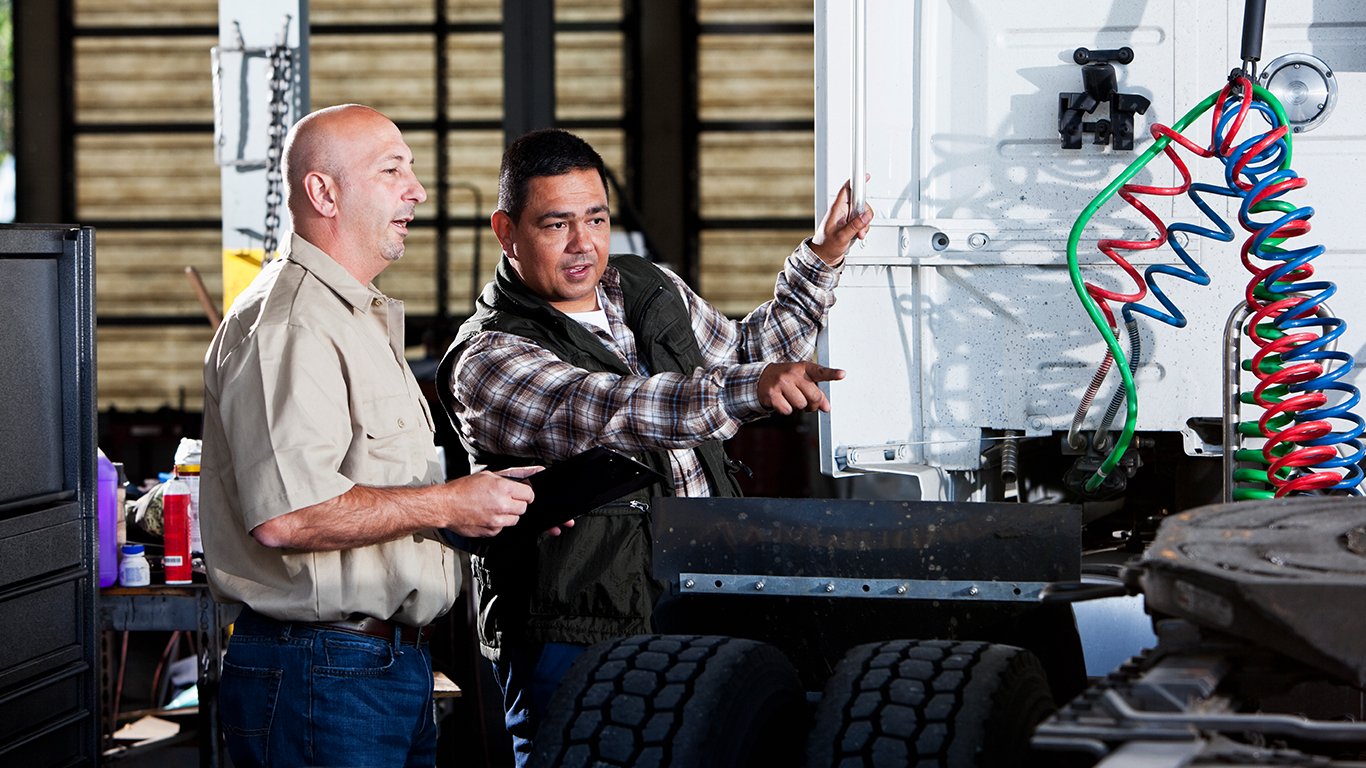
24. Bus and truck mechanics and diesel engine specialists
> 2019 fatal injury rate: 7.7 per 100,000 full-time equivalent workers
> Total injuries in 2019: 28 fatal injuries, 3,400 nonfatal injuries
> Most common cause of fatal injuries: Contact with objects and equipment
> Median annual wage: $48,500
> Total employment: 266,330
Diesel engine specialists identify and repair problems with buses, trucks, and other vehicles that use diesel engines. These vehicles are typically large and heavy, making them potentially dangerous to work around. A dozen of these workers were killed by contact with objects or equipment in 2019. In total, there were 7.7 fatal injuries for every 100,000 full-time equivalent diesel engine specialists in 2019.
[recirclink id=825111]
23. Telecommunications line installers and repairers
> 2019 fatal injury rate: 7.8 per 100,000 full-time equivalent workers
> Total injuries in 2019: 15 fatal injuries, 5,010 nonfatal injuries
> Most common cause of fatal injuries: Transportation incidents
> Median annual wage: $56,750
> Total employment: 120,900
These workers are most commonly killed in transportation accidents, like driving to or from job sites. Telecommunications line installers are also some of the most likely workers to miss time from work due to an injury. These workers suffered 442 occupational injuries that involved time away from work for every 10,000 full-time equivalent workers — more than five times the occupational injury rate of 86.9 per 10,000 for all jobs, and the second highest rate for any career field.

22. Carpenters
> 2019 fatal injury rate: 7.9 per 100,000 full-time equivalent workers
> Total injuries in 2019: 99 fatal injuries, 11,670 nonfatal injuries
> Most common cause of fatal injuries: Falls, slips, trips
> Median annual wage: $48,330
> Total employment: 734,170
For every 100,000 full-time equivalent carpenters, there were 7.9 fatal injuries on the job in 2019. Of the 99 total fatal incidents, 57 were due to falls, slips, and trips. There were also 11,670 nonfatal injuries among carpenters in 2019. This amounts to 189 occupational injuries that caused carpenters to miss time at work per 10,000 full-time equivalent workers — more than double the rate for all jobs.
[in-text-ad-2]

21. Shuttle drivers, chauffeurs, and taxi drivers
> 2019 fatal injury rate: 8.0 per 100,000 full-time equivalent workers
> Total injuries in 2019: est. 56 fatal injuries, 3,910 nonfatal injuries
> Most common cause of fatal injuries: N/A
> Median annual wage: N/A
> Total employment: N/A
Shuttle drivers, chauffeur, and taxi drivers work in one of just 21 jobs where at least 8 workers died per 100,000 full-time equivalent workers in 2019. Passenger vehicle drivers also sustained nearly 4,000 nonfatal injuries throughout the year. Though the most common cause of fatal injuries is not available for these workers, they often drive on highways and through congested traffic at all hours of the day, putting them at risk for traffic accidents.
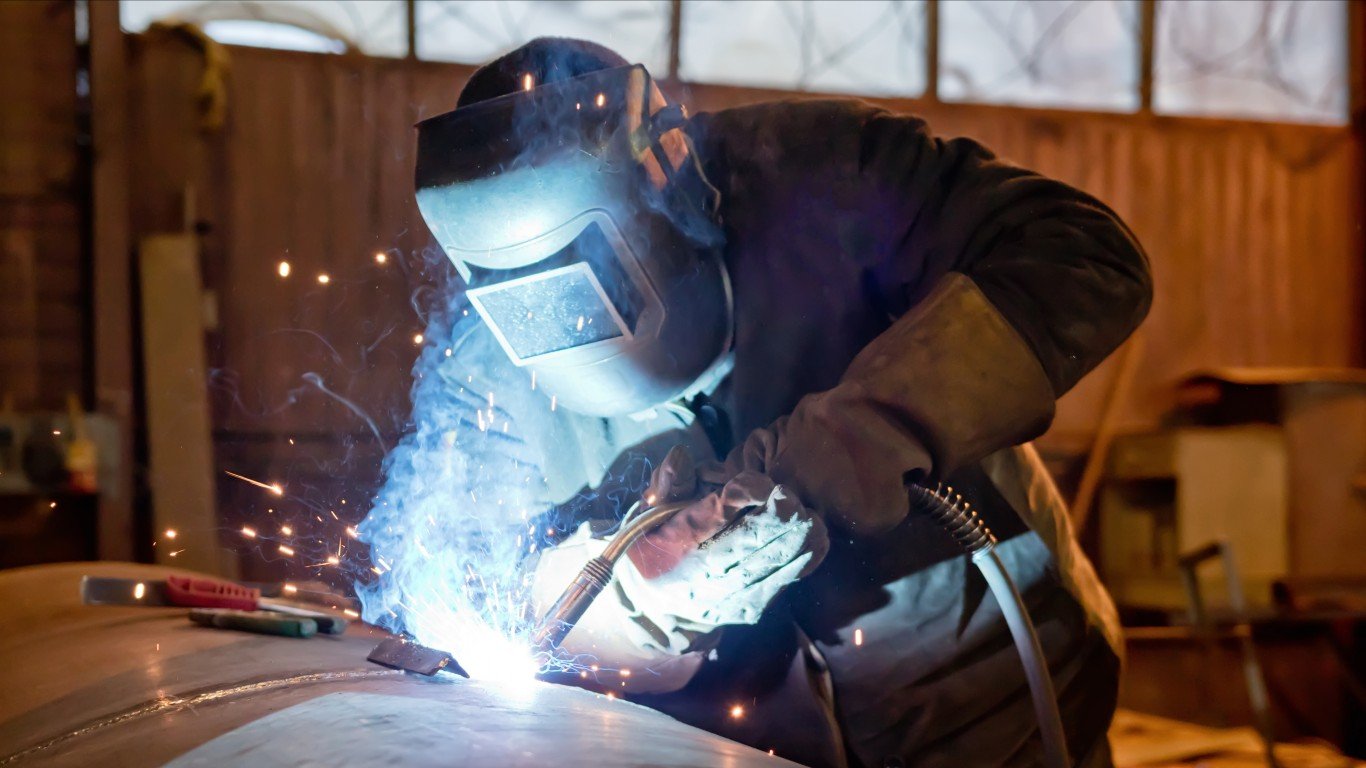
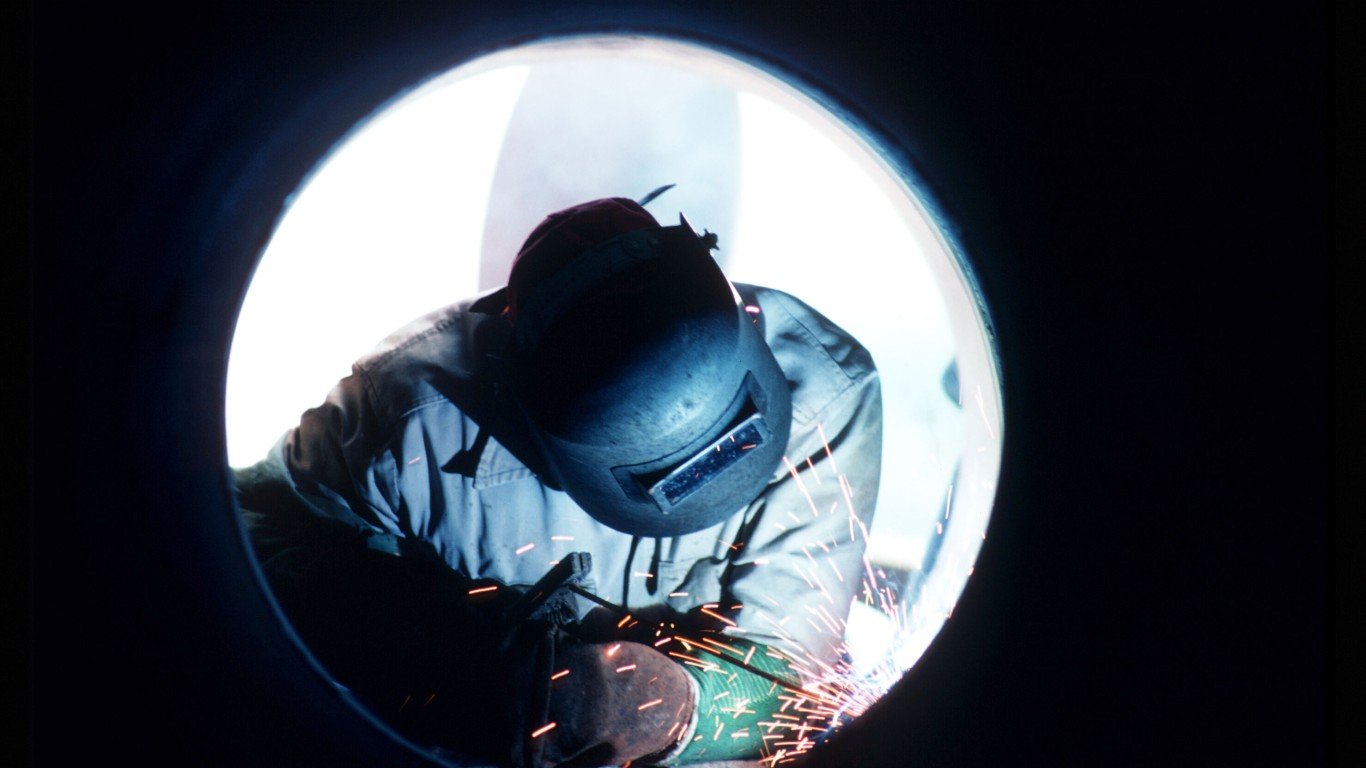
20. Welding, soldering, and brazing workers
> 2019 fatal injury rate: 8.1 per 100,000 full-time equivalent workers
> Total injuries in 2019: 50 fatal injuries, 6,030 nonfatal injuries
> Most common cause of fatal injuries: Contact with objects and equipment
> Median annual wage: $42,100
> Total employment: 445,850
Of the nearly 450,000 welding, soldering, and brazing workers, 50 suffered fatal injuries on the job in 2019. These incidents were most commonly due to contact with objects or equipment as these workers often use potentially-dangerous equipment like welding torches as well as working on large and heavy objects on occasion.
[in-text-ad]

19. Police and sheriff’s patrol officers
> 2019 fatal injury rate: 11.1 per 100,000 full-time equivalent workers
> Total injuries in 2019: 86 fatal injuries, 230 nonfatal injuries
> Most common cause of fatal injuries: Violence and other injuries by persons or animals
> Median annual wage: $63,150
> Total employment: 665,280
Police and sheriff’s patrol officers work one of just 19 jobs in which workers suffered more than 10 fatal injuries per 100,000 full-time equivalent workers. While most of the jobs on this list rank among the most dangerous because of accidents, patrol officers are most likely to die from violence from either people or animals as they frequently contend with armed and dangerous suspects. Half of the 86 total fatal injuries these officers suffered while on the job were due to violence. Patrol officers are also the most likely to suffer a nonfatal injury that forces them to miss work. For every 10,000 full-time equivalent patrol officers, 759 missed work due to occupational injuries or illnesses in 2019 — more than eight times the rate for all jobs of 86.9 per 10,000 workers.
[recirclink id=824405]
18. First-line supervisors of landscaping, lawn service, and groundskeeping workers
> 2019 fatal injury rate: 12.6 per 100,000 full-time equivalent workers
> Total injuries in 2019: 35 fatal injuries, 2,920 nonfatal injuries
> Most common cause of fatal injuries: Transportation incidents
> Median annual wage: $49,370
> Total employment: 103,580
First-line supervisors of landscaping, lawn service, and groundskeeping workers oversee those who are maintaining lawns, gardens, and other outdoor spaces. This job typically requires crews to travel between jobs throughout the day. With all this travel, these workers are most commonly fatally injured in transportation incidents, like car accidents. For every 100,000 full-time equivalent landscaping supervisors, 12.6 were fatally injured in 2019.

17. Operating engineers and other construction equipment operators
> 2019 fatal injury rate: 12.8 per 100,000 full-time equivalent workers
> Total injuries in 2019: 52 fatal injuries, 3,520 nonfatal injuries
> Most common cause of fatal injuries: Transportation incidents
> Median annual wage: $48,980
> Total employment: 405,750
These construction equipment operators use motor graders, bulldozers, scrapers, compressors, pumps, derricks, shovels, tractors, and other devices for construction purposes. These devices can often be dangerous. Of the 52 fatal injuries suffered by these workers, 25 were transportation incidents, and 19 were due to contact with objects and equipment. There were just over 400,000 Americans working this job in 2019. For every 100,000 full-time equivalent workers, 12.8 were fatally injured that year.
[in-text-ad-2]
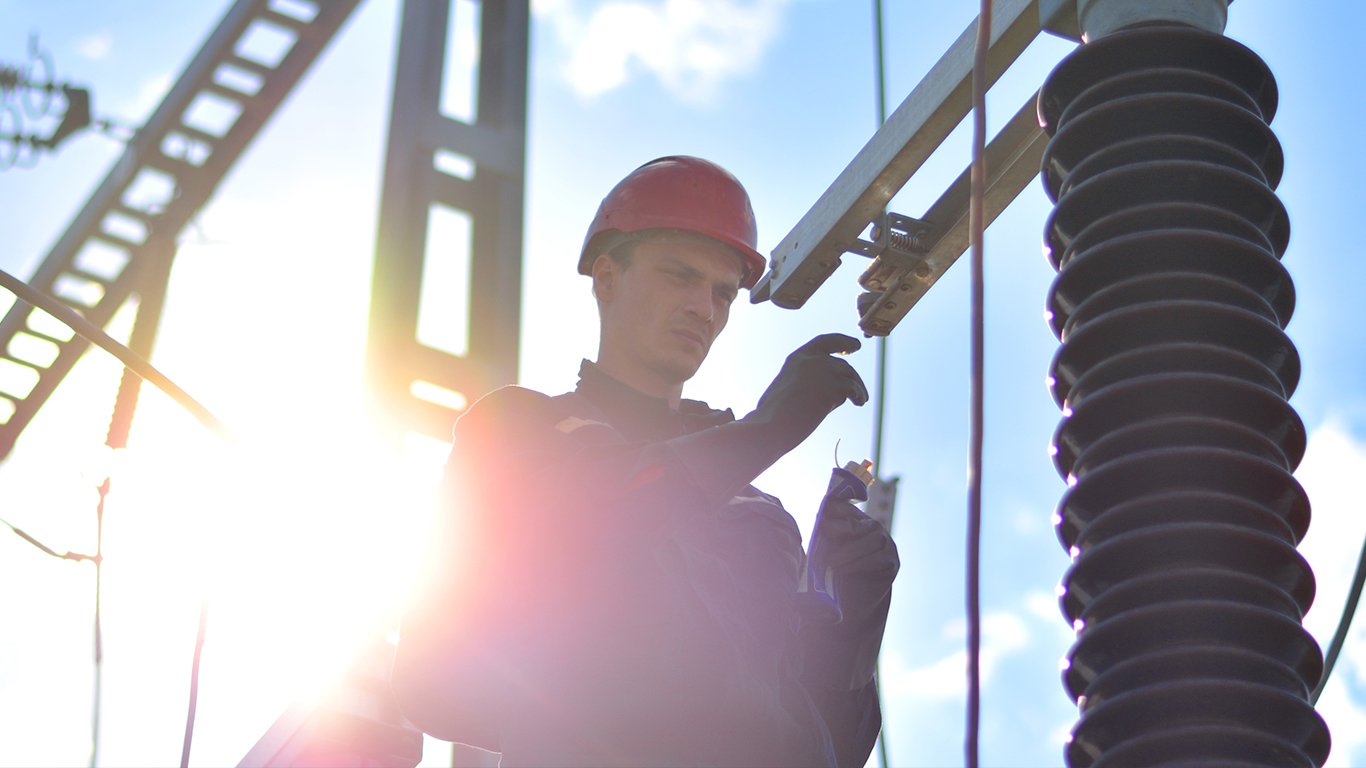
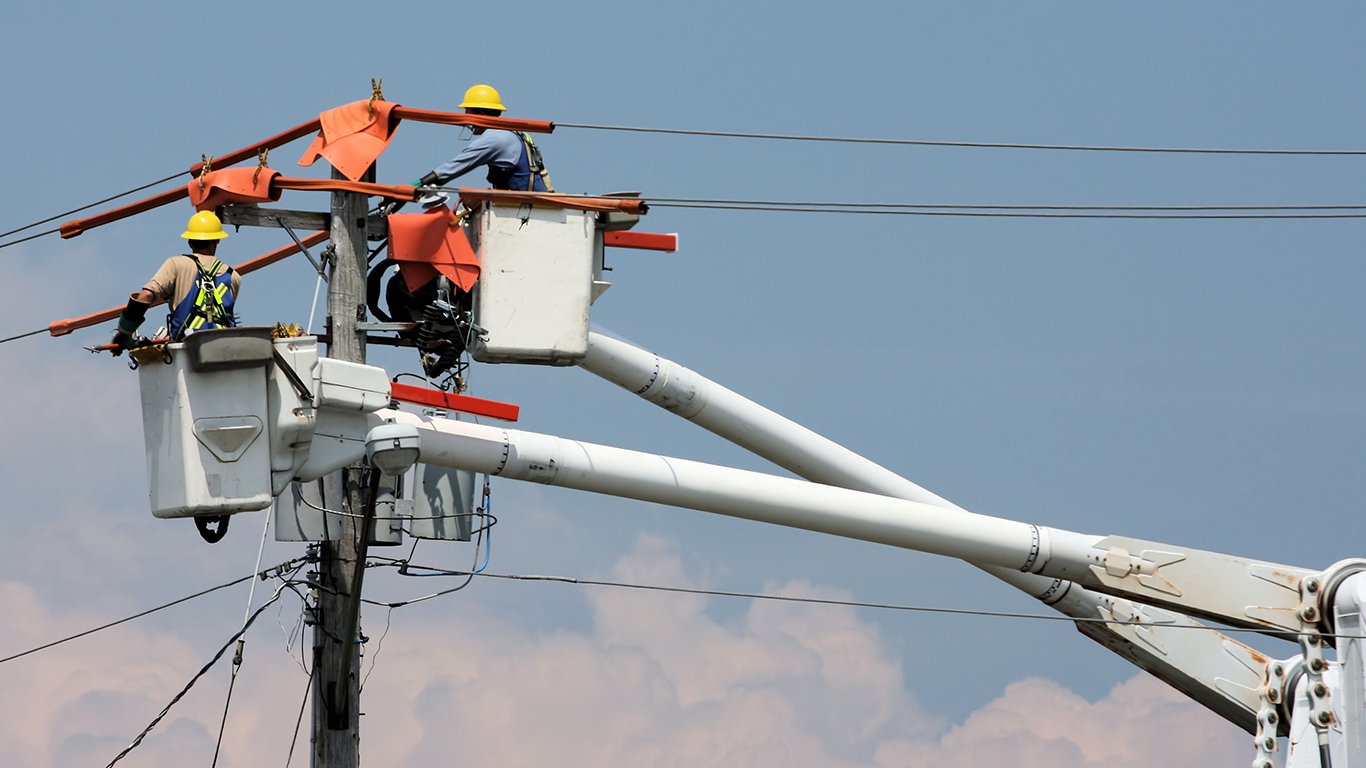
16. Electrical power-line installers and repairers
> 2019 fatal injury rate: 13.3 per 100,000 full-time equivalent workers
> Total injuries in 2019: 20 fatal injuries, 1,510 nonfatal injuries
> Most common cause of fatal injuries: Exposure to harmful substances or environments
> Median annual wage: $72,520
> Total employment: 111,660
Among America’s most dangerous jobs, electrical power-line installers and repairers are well compensated, with most earning over $72,000 per year. The U.S. median annual wage is $39,810, and most jobs on this list earn less than $50,000 a year. These workers are most commonly fatally injured by exposure to harmful substances or environments as they work with dangerous high voltage power lines.
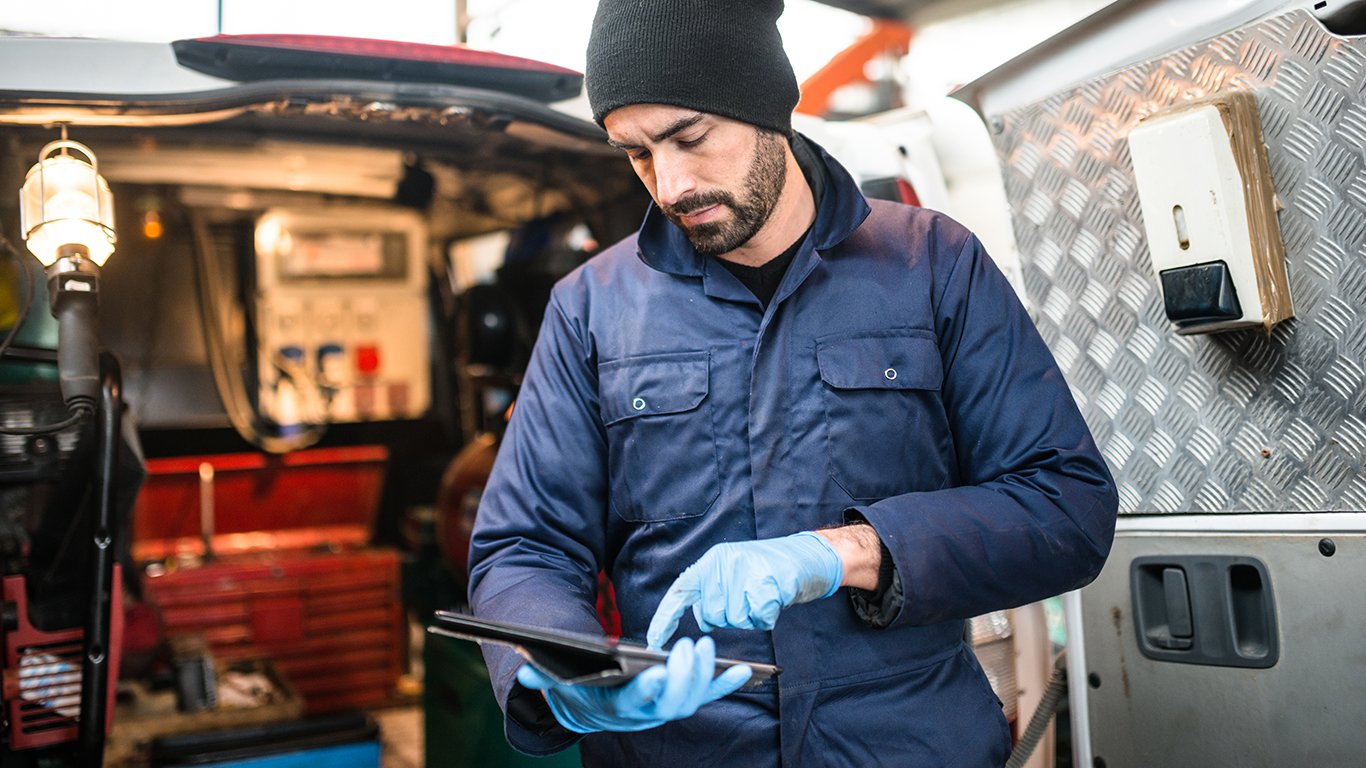
15. Maintenance and repair workers, general
> 2019 fatal injury rate: 13.4 per 100,000 full-time equivalent workers
> Total injuries in 2019: 78 fatal injuries, 21,490 nonfatal injuries
> Most common cause of fatal injuries: Falls, slips, trips
> Median annual wage: $39,080
> Total employment: 1,418,990
General maintenance and repair workers are jacks of all trades, and their duties may involve tasks like machining, carpentry, repairing electrical or mechanical equipment, installing, aligning, and balancing new equipment, and repair work, to name a few. These workers suffered 78 fatal injuries on the job in 2019, including by violence from people or animals, transportation incidents, falls, and exposure to harmful substances. Overall 13.4 of every 100,000 full-time equivalent maintenance and repair workers suffered a fatal injury working in 2019.
[in-text-ad]
14. First-line supervisors of mechanics, installers, and repairers
> 2019 fatal injury rate: 14.6 per 100,000 full-time equivalent workers
> Total injuries in 2019: 44 fatal injuries, 3,270 nonfatal injuries
> Most common cause of fatal injuries: Violence and other injuries by persons or animals
> Median annual wage: $67,460
> Total employment: 485,700
Among the nearly half a million people who worked as supervisors of mechanics, installers, and repairers in 2019, there were 14.6 fatal injuries on the job per 100,000 full-time equivalent workers, making it one of the most dangerous jobs in America. It is one of just two jobs on this list, along with patrol officers, in which violence was the top cause of fatal injuries.
[recirclink id=823370]

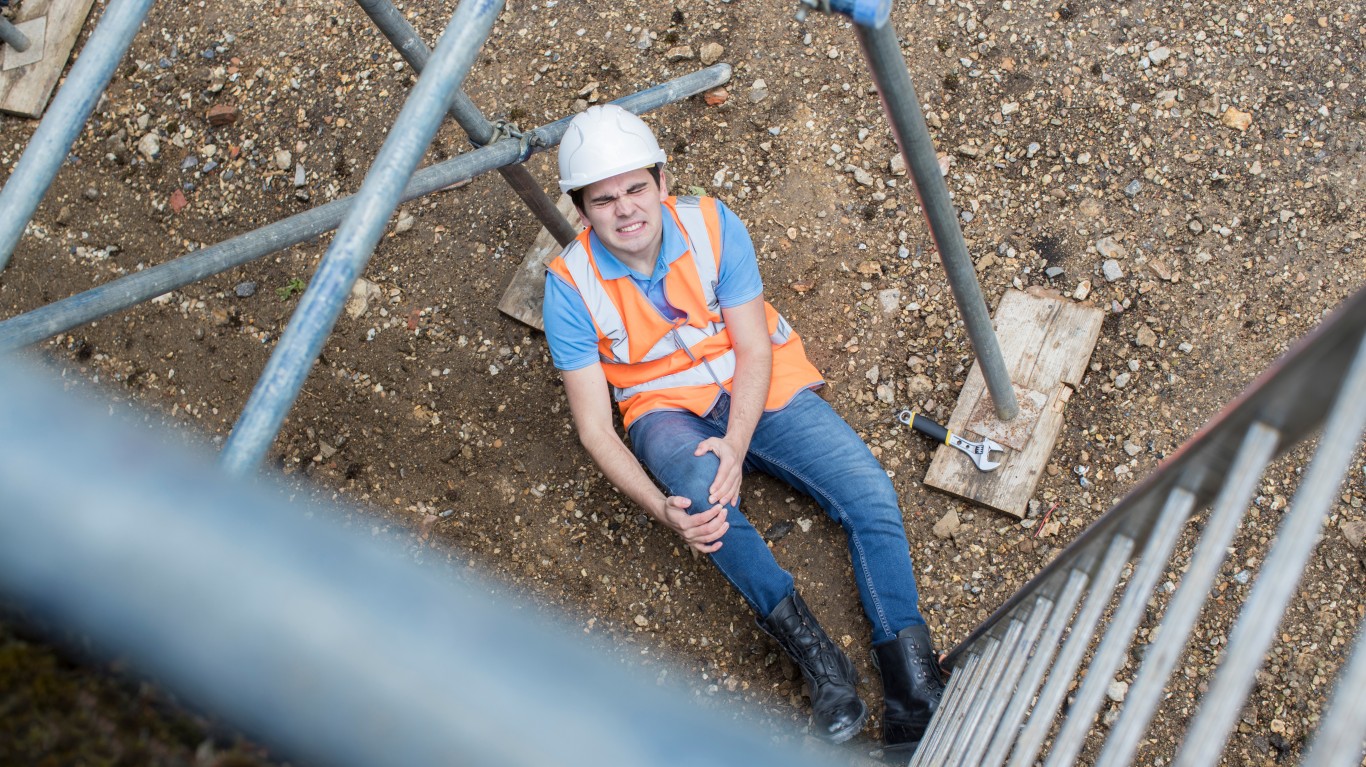
13. Construction laborers
> 2019 fatal injury rate: 15.0 per 100,000 full-time equivalent workers
> Total injuries in 2019: 293 fatal injuries, 19,790 nonfatal injuries
> Most common cause of fatal injuries: Falls, slips, trips
> Median annual wage: $36,860
> Total employment: 1,020,350
Construction laborers reported the second most total fatal injuries of any job in 2019, with 293, amounting to 15 fatal injuries per 100,000 full-time equivalent workers. For most of the jobs on this list, there is one particular hazard that claims the lives of the majority of workers who die on the job, but for construction laborers there are several causes. Because construction sites are often dangerous places, these workers suffered fatal injuries caused by transportation incidents, exposure to harmful substances or environments, and contact with objects and equipment in 2019.

12. First-line supervisors of construction trades and extraction workers
> 2019 fatal injury rate: 18.7 per 100,000 full-time equivalent workers
> Total injuries in 2019: 136 fatal injuries, 5,130 nonfatal injuries
> Most common cause of fatal injuries: Transportation incidents
> Median annual wage: $66,210
> Total employment: 626,180
Supervisors of construction workers and extraction workers, like coal miners, suffered 18.7 fatal injuries per 100,000 equivalent workers. In total, 136 such workers died on the job in 2019, the sixth most among all career fields. These supervisors tend to be relatively well compensated, with most earning over $66,000 per year.
[in-text-ad-2]
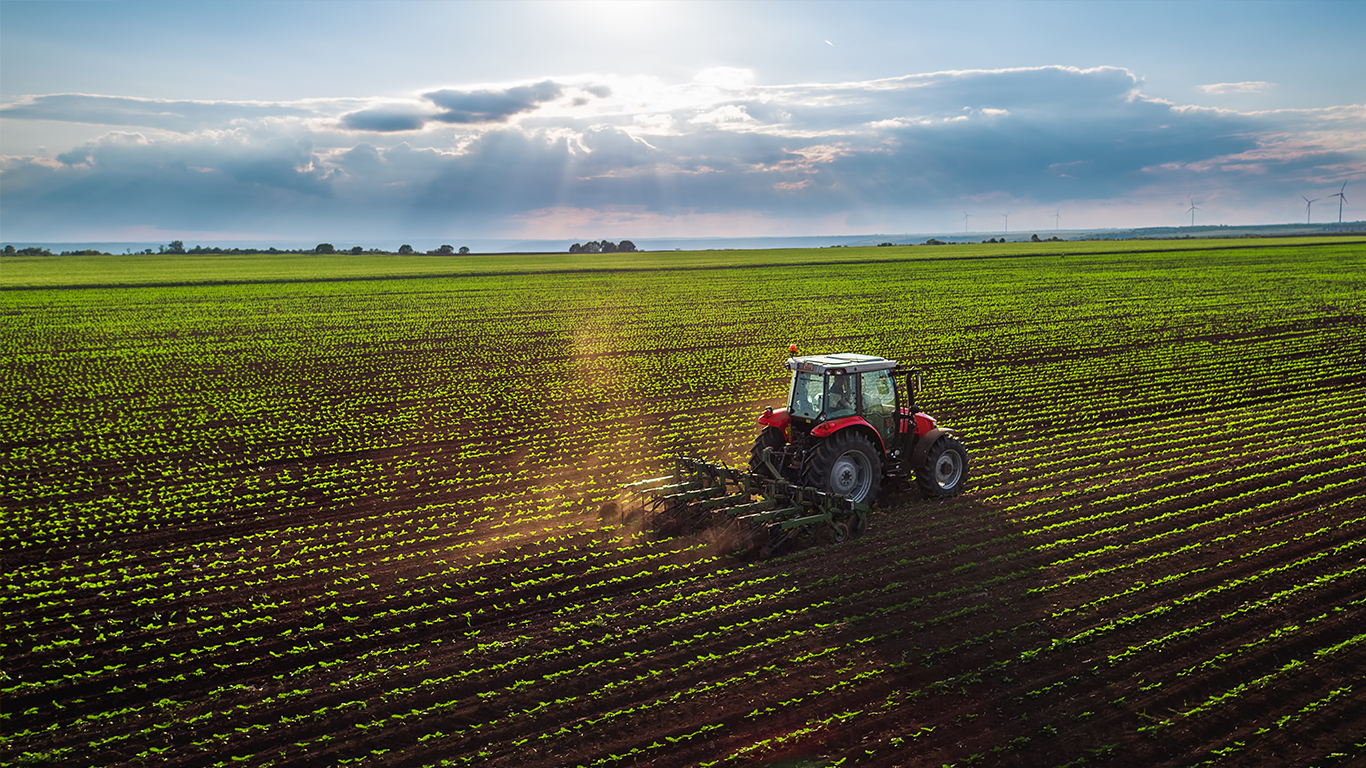
11. Miscellaneous agricultural workers
> 2019 fatal injury rate: 19.8 per 100,000 full-time equivalent workers
> Total injuries in 2019: 181 fatal injuries, 12,780 nonfatal injuries
> Most common cause of fatal injuries: Exposure to harmful substances or environments
> Median annual wage: $25,820
> Total employment: 365,680
The job field of miscellaneous agricultural workers includes equipment operators, farm and ranch hands, laborers, animal workers, and more. These workers often use large machinery and vehicles as well as potentially harmful chemicals like pesticides. Most jobs that rank among the most dangerous pay relatively well compared to the U.S. annual median wage of $39,810. Yet most of these agricultural workers earn less than $26,000 per year.

10. Grounds maintenance workers
> 2019 fatal injury rate: 19.8 per 100,000 full-time equivalent workers
> Total injuries in 2019: 229 fatal injuries, 13,770 nonfatal injuries
> Most common cause of fatal injuries: Transportation incidents
> Median annual wage: $30,890
> Total employment: 999,960
The job of groundskeeper ranks as one of the most dangerous jobs in America, as 19.8 workers per 100,000 full-time equivalent workers suffered a fatal accident on the job in 2019. In total, there were 229 fatal injuries among the nearly 1 million groundskeepers working in 2019. Fatal injuries of groundskeepers were most commonly caused by transportation incidents sustained while traveling or by being struck by vehicles.
[in-text-ad]

9. Farmers, ranchers, and other agricultural managers
> 2019 fatal injury rate: 23.2 per 100,000 full-time equivalent workers
> Total injuries in 2019: 238 fatal injuries, 400 nonfatal injuries
> Most common cause of fatal injuries: Transportation incidents
> Median annual wage: $71,160
> Total employment: 5,060
Farmers, ranchers, and other agricultural managers work in one of just nine fields in which workers suffered more than 20 fatal injuries per 100,000 full-time equivalent workers in 2019. In spite of this, these workers have a very low incidence of nonfatal accidents. There were just 12.8 injuries per 10,000 farmers, ranchers, and agricultural managers that caused them to miss time at work — a fraction of the 86.9 per 10,000 rate among all U.S. job fields.
[recirclink id=806668]

8. Structural iron and steel workers
> 2019 fatal injury rate: 26.3 per 100,000 full-time equivalent workers
> Total injuries in 2019: 18 fatal injuries, 1,070 nonfatal injuries
> Most common cause of fatal injuries: Falls, slips, trips
> Median annual wage: $55,040
> Total employment: 76,570
Structural iron and steel workers use metal to construct frameworks and buildings. This job often requires workers to be high off the ground, making falls potentially life threatening. In total, 18 structural workers died on the job in 2019 in one of the smallest total employments of any career field on this list, with 76,570.
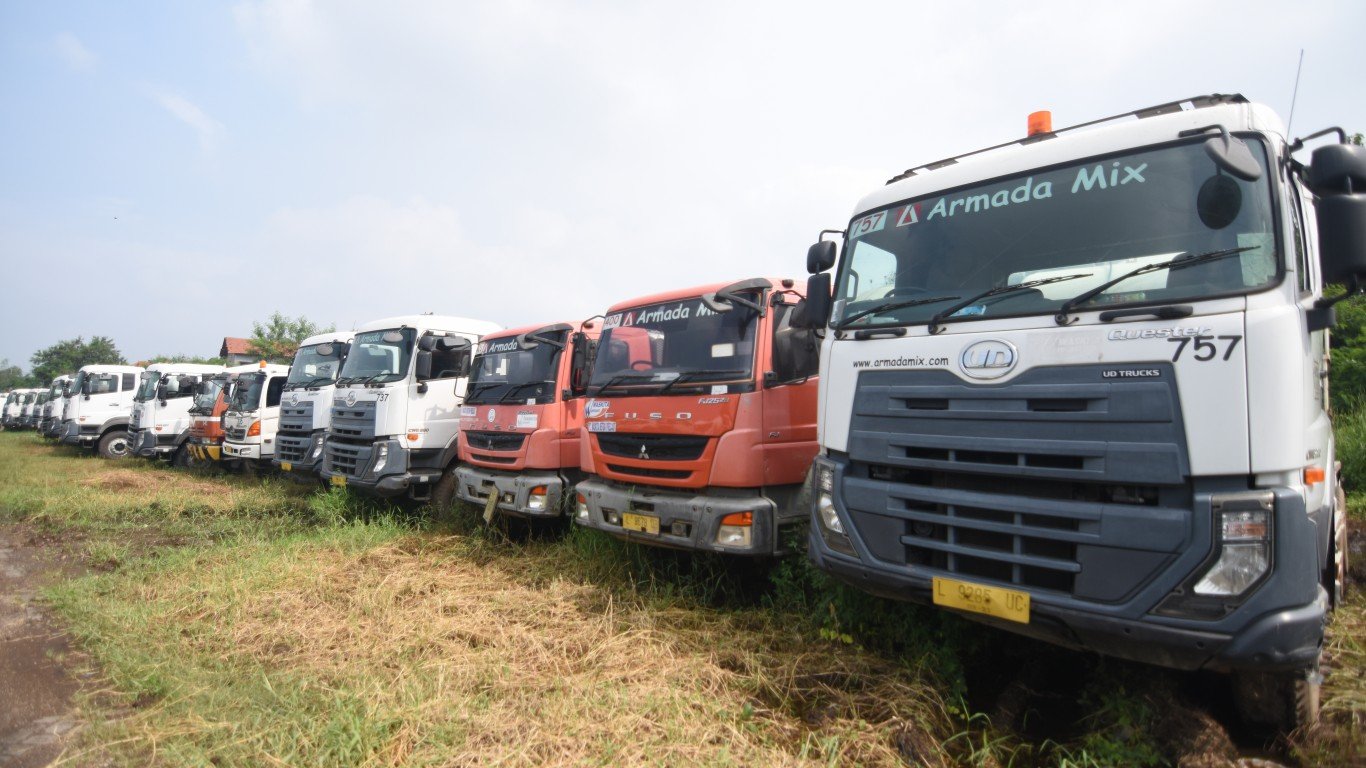
7. Driver/sales workers and truck drivers
> 2019 fatal injury rate: 26.8 per 100,000 full-time equivalent workers
> Total injuries in 2019: 1,005 fatal injuries, 79,040 nonfatal injuries
> Most common cause of fatal injuries: Transportation incidents
> Median annual wage: $40,310
> Total employment: 3,223,840
Truck drivers had by far the most total fatal injuries of any job in 2019, with 1,005 fatalities. No other job had even 300 fatal injuries that year. However, with over 3.2 million truck drivers working in 2019, the profession’s fatal injury rate ranks seventh, with 26.8 fatal incidents per 100,000 equivalent workers. The vast majority of fatal injuries were transportation incidents, like vehicle accidents. Truck drivers also reported over 79,000 nonfatal injuries
[in-text-ad-2]

6. Refuse and recyclable material collectors
> 2019 fatal injury rate: 35.2 per 100,000 full-time equivalent workers
> Total injuries in 2019: 31 fatal injuries, 1,840 nonfatal injuries
> Most common cause of fatal injuries: Transportation incidents
> Median annual wage: $37,840
> Total employment: 121,330
Refuse collectors suffered 35.2 fatal injuries per 100,000 full-time equivalent workers. The majority of these fatalities were caused by transportation incidents, such as being injured in an auto accident or being struck by a vehicle. These workers are traveling throughout the day going from house to house picking up garbage and recyclable materials. The career field also ranks sixth in the rate of nonfatal injuries that cause missed time at work among all jobs, with 282.6 incidents per 10,000 full-time workers.

5. Helpers, construction trades
> 2019 fatal injury rate: 40.0 per 100,000 full-time equivalent workers
> Total injuries in 2019: 20 fatal injuries, 2,770 nonfatal injuries
> Most common cause of fatal injuries: Falls, slips, trips
> Median annual wage: $32,720
> Total employment: 242,400
Construction helpers assist more skilled and experienced construction workers like masons, carpenters, roofers, and others. Though the job is one of the five most dangerous in the country, with 40 fatal injuries per 100,000 full-time equivalent workers, construction helpers are not well paid. Such workers typically earn less than $33,000 per year, while the median annual wage for all jobs is $39,810.
[in-text-ad]
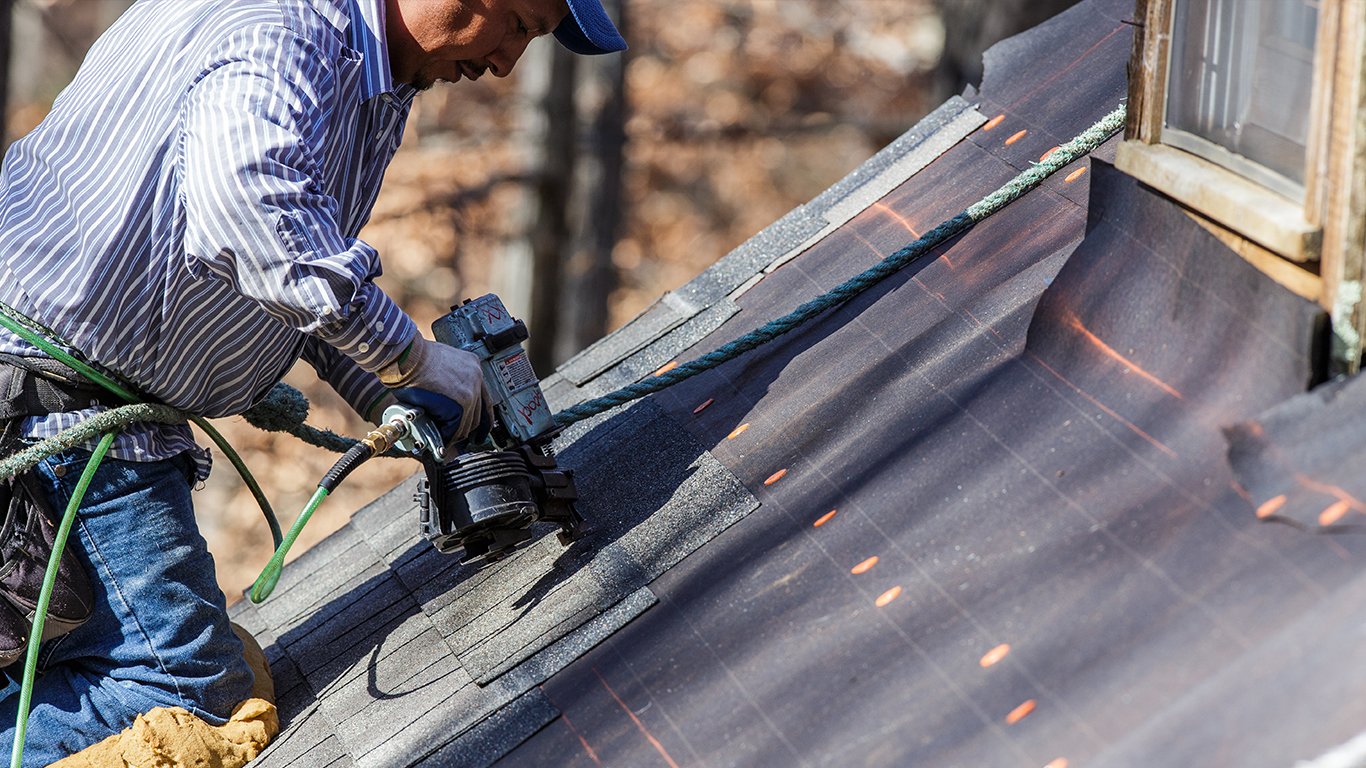
4. Roofers
> 2019 fatal injury rate: 54.0 per 100,000 full-time equivalent workers
> Total injuries in 2019: 111 fatal injuries, 3,850 nonfatal injuries
> Most common cause of fatal injuries: Falls, slips, trips
> Median annual wage: $42,100
> Total employment: 129,690
Roofers, who place and repair roofing tiles or other materials on top of houses, work in one of the most dangerous jobs in America. For every 100,000 full-time equivalent roofers, there were 54 fatal injuries on the job in 2019. Working high off the ground can be perilous, as 93 of the 111 reported fatal injuries among roofers in 2019 were attributed to falls. Roofers also have the third highest rate of nonfatal injuries that cause workers to miss time at work, at 360.6 incidents per 10,000 full-time equivalent workers.
[recirclink id=805851]

3. Aircraft pilots and flight engineers
> 2019 fatal injury rate: 61.8 per 100,000 full-time equivalent workers
> Total injuries in 2019: 85 fatal injuries, 440 nonfatal injuries
> Most common cause of fatal injuries: N/A
> Median annual wage: $121,430
> Total employment: 122,350
Aircraft pilot ranks as the third most dangerous job in the nation, with 61.8 fatal incidents per 100,000 full-time equivalent workers in 2019. Though the causes of these accidents were not made available, the Aviation Safety Network reported seven fatal plane crashes in the U.S. in 2019, with a total of 16 fatalities. Pilots are not just highest paid workers on this list, but also the best paid among the dozens of different careers considered for this list. Most pilots earn over $120,000 per year.
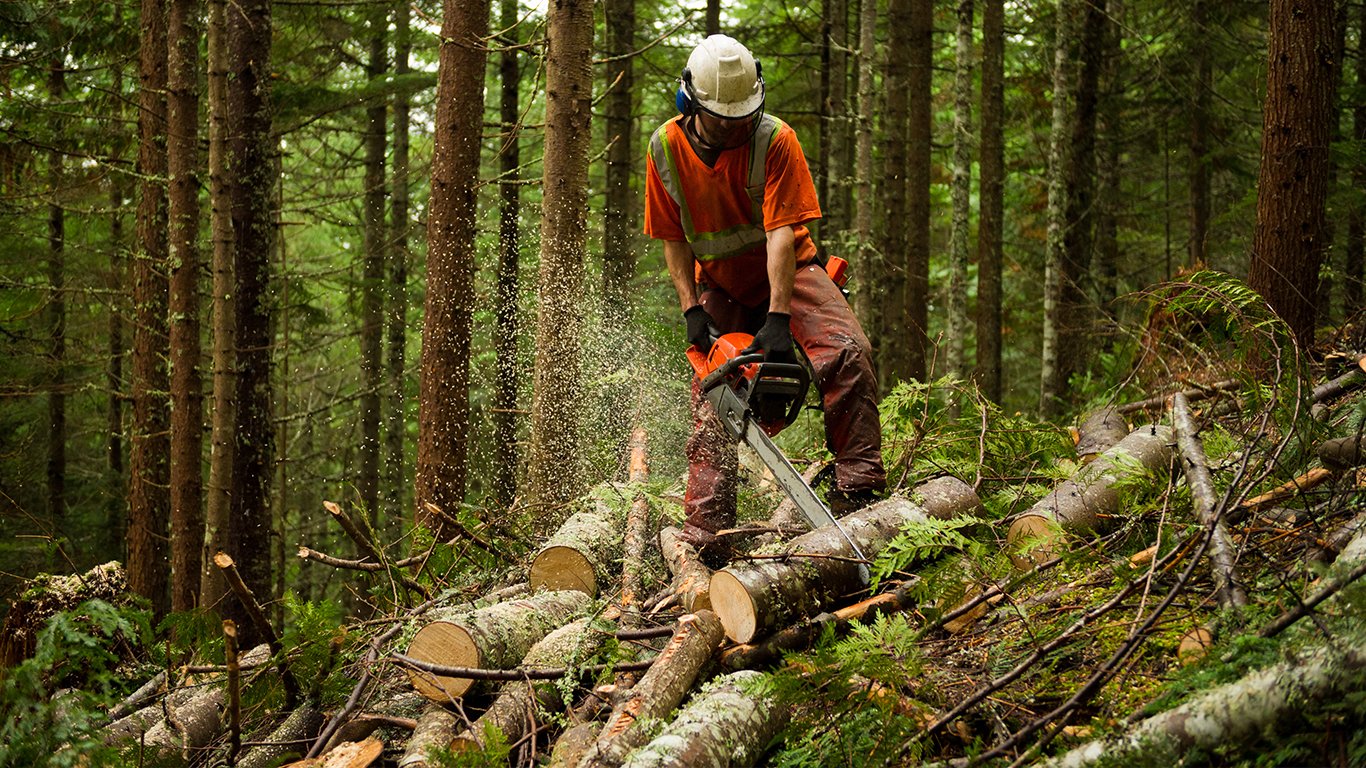
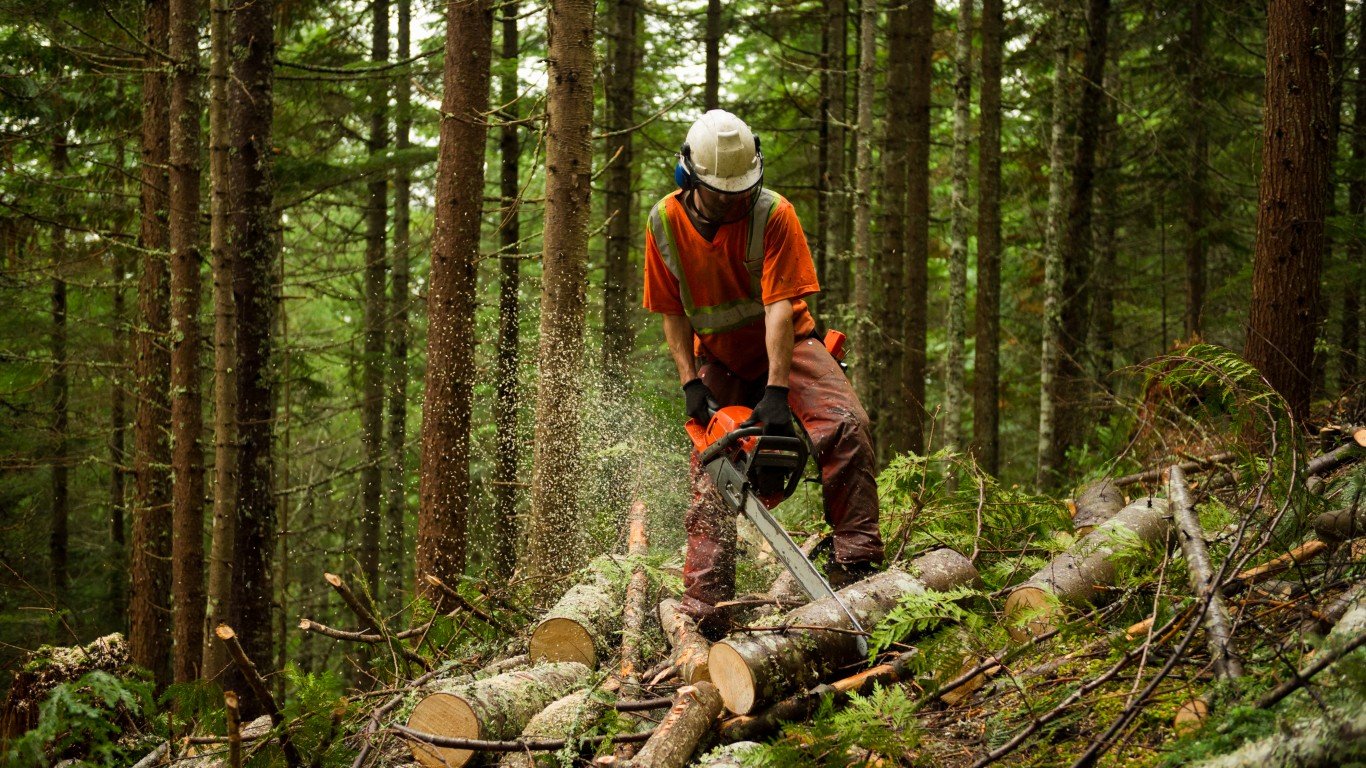
2. Logging workers
> 2019 fatal injury rate: 68.9 per 100,000 full-time equivalent workers
> Total injuries in 2019: 46 fatal injuries, 930 nonfatal injuries
> Most common cause of fatal injuries: Contact with objects and equipment
> Median annual wage: $41,230
> Total employment: 37,960
Logging work ranked as the most dangerous job of 2018, with 97.6 fatal injuries per 100,000 full-time equivalent workers. In 2019, the fatal injury rate declined significantly, to 68.9 per 100,000, dropping loggers to second place. Logging workers use dangerous machinery like chainsaws, and are at risk of having large trees fall on them. Adding to the peril, these workers are frequently in remote areas, far away from potential medical intervention that could help save their lives in the event of an accident.
[in-text-ad-2]

1. Fishing and hunting workers
> 2019 fatal injury rate: 145.0 per 100,000 full-time equivalent workers
> Total injuries in 2019: 44 fatal injuries, 50 nonfatal injuries
> Most common cause of fatal injuries: Transportation incidents
> Median annual wage: N/A
> Total employment: N/A
Fishing and hunting work ranked as the most dangerous job in America for 2019. This career field had 145 fatal injuries for every 100,000 full-time equivalent workers — more than double any other job. The majority of the 44 fatal injuries sustained by these workers in 2019 were transportation injuries. Fishing workers are sometimes thrown overboard or work on boats that capsize miles offshore.
Contact [email protected] for any questions or corrections.