The U.S. Census Bureau released in December the latest five-year estimates from the American Community Survey, an ongoing nationwide demographic snapshot that collects social, economic, and housing characteristics from millions of households every year.
Among many findings of the five-year ACS estimates are the U.S.national median household annual income from 2017 through 2021 reached $69,021, a 10.5% increase from $62,460 reported in the 2012-2016 period, adjusted for inflation. Similarly, the five-year poverty rate decreased to 12.6% from 15.1% in the previous nonoverlapping five-year period. However, those national figures do not reflect the large disparities between wealthy and poor communities.
Nearly three-fourths of U.S. counties in the 50 states and District of Columbia have median household incomes lower than the national median, while about 13% of counties have higher median household incomes, reflecting a significant geographic disparity in wealth. To identify the poorest towns in every state, 24/7 Wall St. reviewed five-year estimates of median household income from the recent five-year estimates of the ACS.
The poorest town nationwide is the one that ranks as poorest in Texas, Carrizo Hill. This community of 1,100 people is near the U.S.-Mexico Border 117 miles southwest of San Antonio and has a median household income of $9,111. (Also see states where the most people live below the poverty line.)
Nineteen of the poorest towns in every U.S. state have median household incomes under $20,000, while 35 of the 50 states have median incomes below $30,000. Median home values in these 50 poorest communities range from $44,600 in Alorton, Illinois, near St. Louis to $263,500 in Storrs, Connecticut, 32 miles east of Hartford.
People in most of these towns – defined as incorporated legal entities or census-designated statistical areas with between 1,000 to 25,000 population – are less likely to have a college diploma compared to statewide averages.
Still, residents in 10 of these towns are more likely to have a college degree compared to others in their state, but those areas tend to be located within or near college campuses where many low-income college students reside. These towns include Storrs; Livingston, Alabama; and University Park, New Mexico. (These are 50 cities with huge populations living on food stamps.)
These college-adjacent, low-income communities also tend to have fewer recipients of Supplemental Nutrition Assistance Program benefits ( previously known as food stamps) compared to their statewide averages. However, 40 of the 50 poorest communities in their state have at least double the share of SNAP recipients than their statewide averages. Eleven of these towns have more than four times the share of food-aid recipients, led by Jonesville, Virginia, where 48% of the 1,313 local residents collect government food assistance compared to the statewide average of 8%.
Here is America’s poorest town in every state.
Click here to see our detailed methodology.

Alabama: Livingston
> Median household income (2017-2021): $16,321 (Alabama: $54,943)
> Median home value (2017-2021): $132,500 (Alabama: $157,100)
> Adults with a bachelor’s degree or higher (2017-2021): 36.1% (Alabama: 26.7%)
> SNAP recipiency rate (2017-2021): 37.0% (Alabama: 13.3%)
> Total population (2017-2021): 3,227 (Alabama: 4,997,675)
> No. of cities considered in ranking: 298
[in-text-ad]

Alaska: Alakanuk
> Median household income (2017-2021): $36,429 (Alaska: $80,287)
> Median home value (2017-2021): $122,900 (Alaska: $282,800)
> Adults with a bachelor’s degree or higher (2017-2021): 1.8% (Alaska: 30.6%)
> SNAP recipiency rate (2017-2021): 39.5% (Alaska: 10.4%)
> Total population (2017-2021): 1,065 (Alaska: 735,951)
> No. of cities considered in ranking: 70
[recirclink id=1171562]

Arizona: Cibecue
> Median household income (2017-2021): $18,232 (Arizona: $65,913)
> Median home value (2017-2021): N/A (Arizona: $265,600)
> Adults with a bachelor’s degree or higher (2017-2021): 6.4% (Arizona: 31.2%)
> SNAP recipiency rate (2017-2021): 48.4% (Arizona: 10.2%)
> Total population (2017-2021): 1,417 (Arizona: 7,079,203)
> No. of cities considered in ranking: 168

Arkansas: Marianna
> Median household income (2017-2021): $17,932 (Arkansas: $52,123)
> Median home value (2017-2021): $75,700 (Arkansas: $142,100)
> Adults with a bachelor’s degree or higher (2017-2021): 8.4% (Arkansas: 24.3%)
> SNAP recipiency rate (2017-2021): 40.3% (Arkansas: 11.3%)
> Total population (2017-2021): 3,660 (Arkansas: 3,006,309)
> No. of cities considered in ranking: 190
[in-text-ad-2]

California: Thermal
> Median household income (2017-2021): $14,500 (California: $84,097)
> Median home value (2017-2021): $119,300 (California: $573,200)
> Adults with a bachelor’s degree or higher (2017-2021): 0.0% (California: 35.3%)
> SNAP recipiency rate (2017-2021): 20.6% (California: 9.5%)
> Total population (2017-2021): 1,198 (California: 39,455,353)
> No. of cities considered in ranking: 732
Colorado: Rocky Ford
> Median household income (2017-2021): $29,822 (Colorado: $80,184)
> Median home value (2017-2021): $81,900 (Colorado: $397,500)
> Adults with a bachelor’s degree or higher (2017-2021): 13.7% (Colorado: 42.8%)
> SNAP recipiency rate (2017-2021): 37.7% (Colorado: 7.4%)
> Total population (2017-2021): 3,876 (Colorado: 5,723,176)
> No. of cities considered in ranking: 182
[in-text-ad]

Connecticut: Storrs
> Median household income (2017-2021): $23,964 (Connecticut: $83,572)
> Median home value (2017-2021): $263,500 (Connecticut: $286,700)
> Adults with a bachelor’s degree or higher (2017-2021): 71.1% (Connecticut: 40.6%)
> SNAP recipiency rate (2017-2021): 5.1% (Connecticut: 11.5%)
> Total population (2017-2021): 16,784 (Connecticut: 3,605,330)
> No. of cities considered in ranking: 128
[recirclink id=1169643]

Delaware: Laurel
> Median household income (2017-2021): $34,615 (Delaware: $72,724)
> Median home value (2017-2021): $150,100 (Delaware: $269,700)
> Adults with a bachelor’s degree or higher (2017-2021): 11.3% (Delaware: 33.6%)
> SNAP recipiency rate (2017-2021): 47.2% (Delaware: 10.5%)
> Total population (2017-2021): 3,886 (Delaware: 981,892)
> No. of cities considered in ranking: 50

Florida: Gifford
> Median household income (2017-2021): $22,353 (Florida: $61,777)
> Median home value (2017-2021): $115,300 (Florida: $248,700)
> Adults with a bachelor’s degree or higher (2017-2021): 14.1% (Florida: 31.5%)
> SNAP recipiency rate (2017-2021): 46.1% (Florida: 13.2%)
> Total population (2017-2021): 4,477 (Florida: 21,339,762)
> No. of cities considered in ranking: 592
[in-text-ad-2]
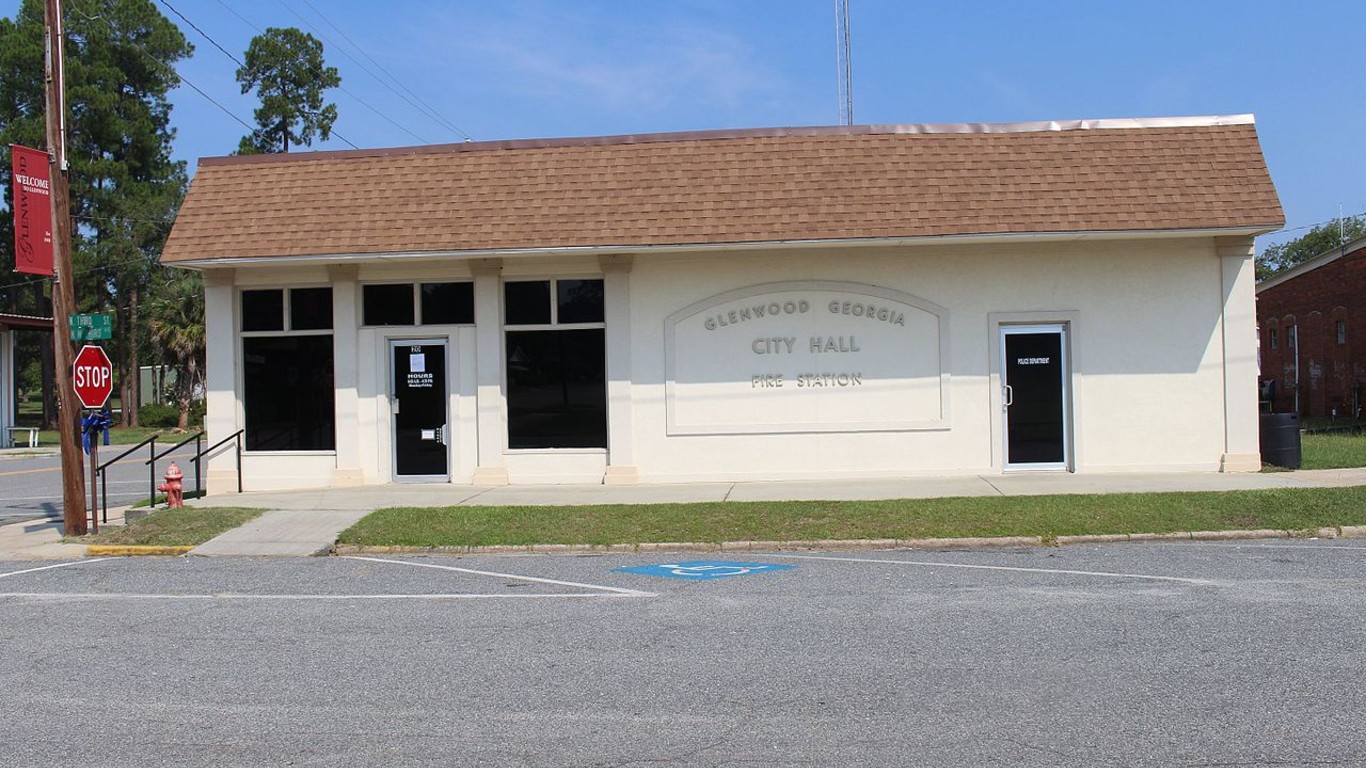
Georgia: Glenwood
> Median household income (2017-2021): $19,625 (Georgia: $65,030)
> Median home value (2017-2021): $82,500 (Georgia: $206,700)
> Adults with a bachelor’s degree or higher (2017-2021): 3.7% (Georgia: 33.0%)
> SNAP recipiency rate (2017-2021): 16.7% (Georgia: 11.9%)
> Total population (2017-2021): 1,116 (Georgia: 10,625,615)
> No. of cities considered in ranking: 326

Hawaii: Hawaiian Ocean View
> Median household income (2017-2021): $25,402 (Hawaii: $88,005)
> Median home value (2017-2021): $168,300 (Hawaii: $662,100)
> Adults with a bachelor’s degree or higher (2017-2021): 13.7% (Hawaii: 34.3%)
> SNAP recipiency rate (2017-2021): 41.3% (Hawaii: 10.7%)
> Total population (2017-2021): 3,851 (Hawaii: 1,453,498)
> No. of cities considered in ranking: 114
[in-text-ad]

Idaho: Glenns Ferry
> Median household income (2017-2021): $29,219 (Idaho: $63,377)
> Median home value (2017-2021): $104,200 (Idaho: $266,500)
> Adults with a bachelor’s degree or higher (2017-2021): 10.6% (Idaho: 29.1%)
> SNAP recipiency rate (2017-2021): 19.6% (Idaho: 8.7%)
> Total population (2017-2021): 1,197 (Idaho: 1,811,617)
> No. of cities considered in ranking: 87
[recirclink id=1061632]

Illinois: Alorton
> Median household income (2017-2021): $19,605 (Illinois: $72,563)
> Median home value (2017-2021): $44,600 (Illinois: $212,600)
> Adults with a bachelor’s degree or higher (2017-2021): 5.3% (Illinois: 36.2%)
> SNAP recipiency rate (2017-2021): 54.0% (Illinois: 12.6%)
> Total population (2017-2021): 1,864 (Illinois: 12,821,813)
> No. of cities considered in ranking: 621
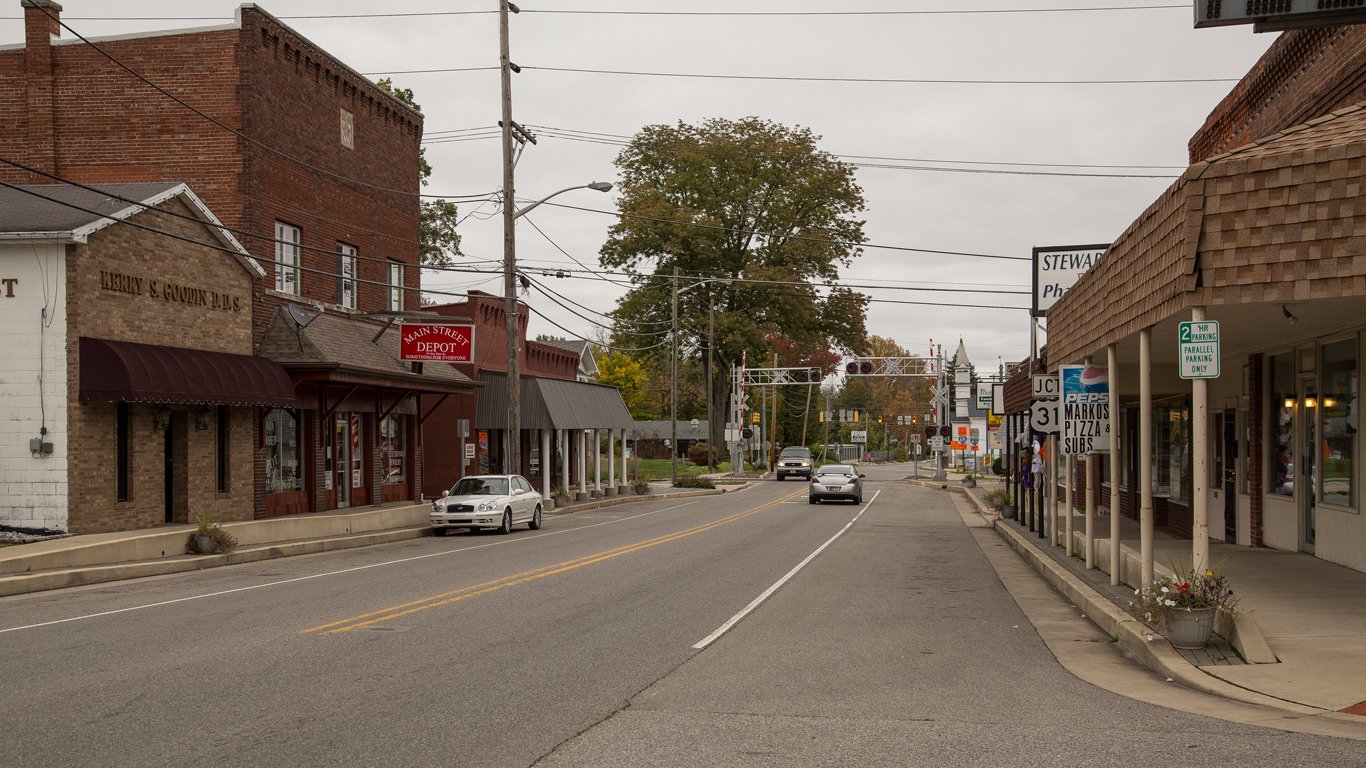
Indiana: Austin
> Median household income (2017-2021): $27,008 (Indiana: $61,944)
> Median home value (2017-2021): $74,200 (Indiana: $158,500)
> Adults with a bachelor’s degree or higher (2017-2021): 10.8% (Indiana: 27.8%)
> SNAP recipiency rate (2017-2021): 27.4% (Indiana: 9.0%)
> Total population (2017-2021): 3,921 (Indiana: 6,751,340)
> No. of cities considered in ranking: 309
[in-text-ad-2]

Iowa: Fayette
> Median household income (2017-2021): $35,682 (Iowa: $65,429)
> Median home value (2017-2021): $88,600 (Iowa: $160,700)
> Adults with a bachelor’s degree or higher (2017-2021): 27.1% (Iowa: 29.7%)
> SNAP recipiency rate (2017-2021): 11.1% (Iowa: 9.6%)
> Total population (2017-2021): 1,139 (Iowa: 3,179,090)
> No. of cities considered in ranking: 266

Kansas: Chetopa
> Median household income (2017-2021): $21,843 (Kansas: $64,521)
> Median home value (2017-2021): $54,200 (Kansas: $164,800)
> Adults with a bachelor’s degree or higher (2017-2021): 14.5% (Kansas: 34.4%)
> SNAP recipiency rate (2017-2021): 16.1% (Kansas: 7.1%)
> Total population (2017-2021): 1,113 (Kansas: 2,932,099)
> No. of cities considered in ranking: 188
[in-text-ad]
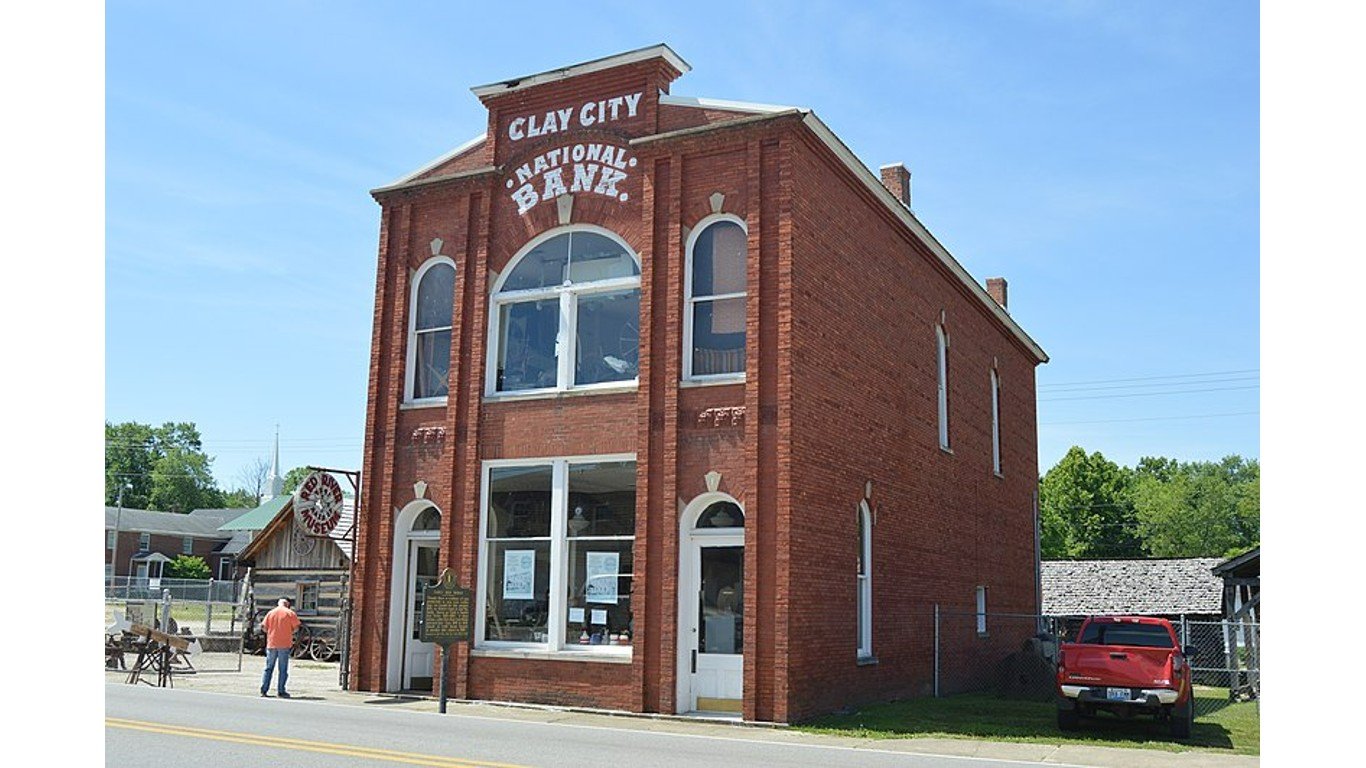
Kentucky: Clay City
> Median household income (2017-2021): $19,643 (Kentucky: $55,454)
> Median home value (2017-2021): $67,000 (Kentucky: $155,100)
> Adults with a bachelor’s degree or higher (2017-2021): 2.7% (Kentucky: 25.7%)
> SNAP recipiency rate (2017-2021): 32.2% (Kentucky: 12.7%)
> Total population (2017-2021): 1,097 (Kentucky: 4,494,141)
> No. of cities considered in ranking: 218
[recirclink id=1158926]
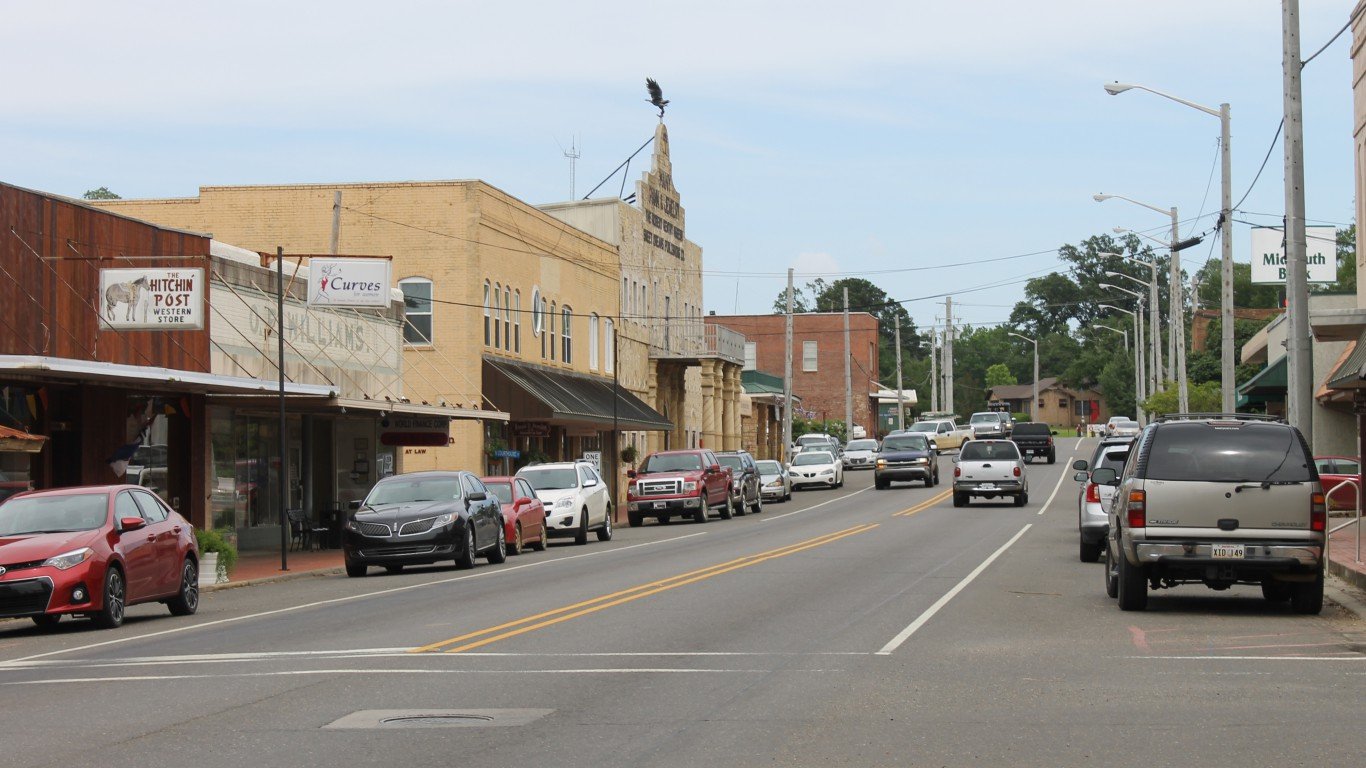
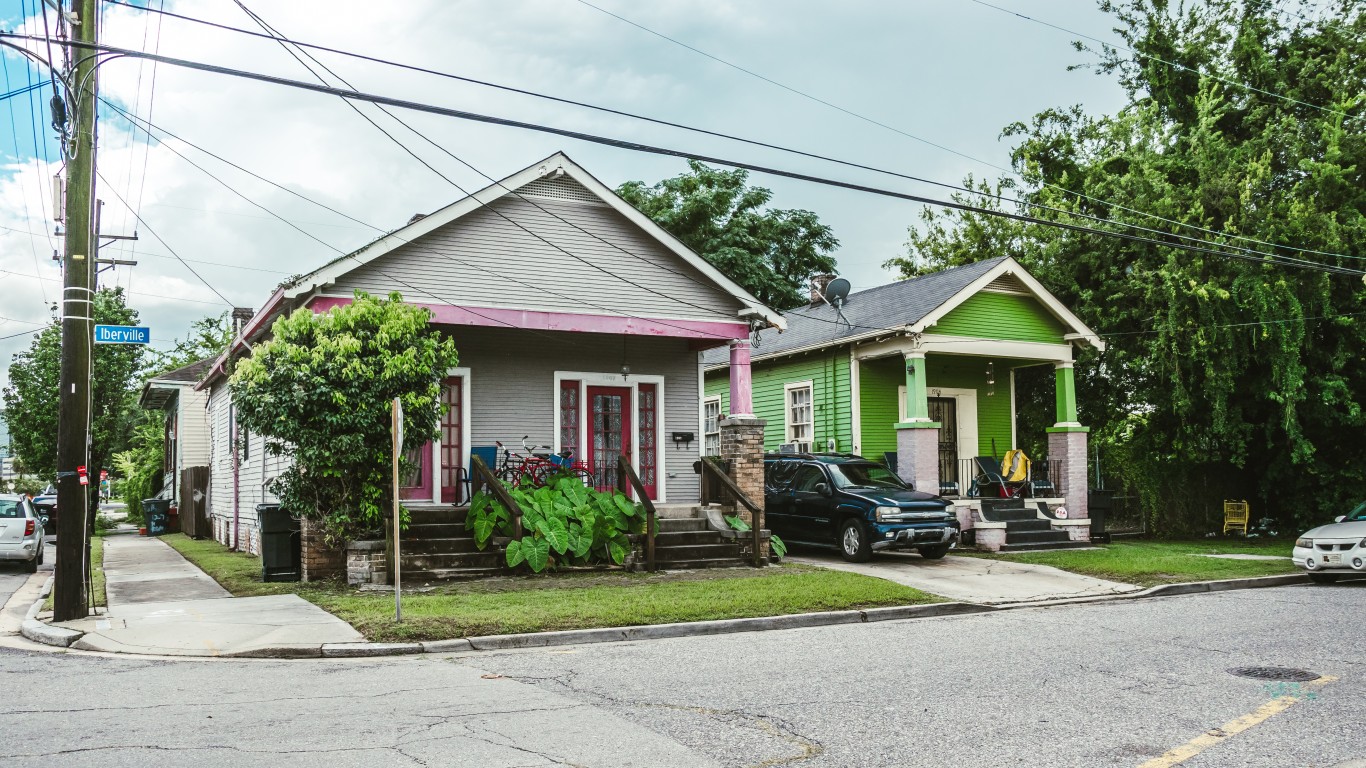
Louisiana: Many
> Median household income (2017-2021): $18,148 (Louisiana: $53,571)
> Median home value (2017-2021): $122,900 (Louisiana: $174,000)
> Adults with a bachelor’s degree or higher (2017-2021): 17.0% (Louisiana: 25.5%)
> SNAP recipiency rate (2017-2021): 33.5% (Louisiana: 15.7%)
> Total population (2017-2021): 2,337 (Louisiana: 4,657,305)
> No. of cities considered in ranking: 248
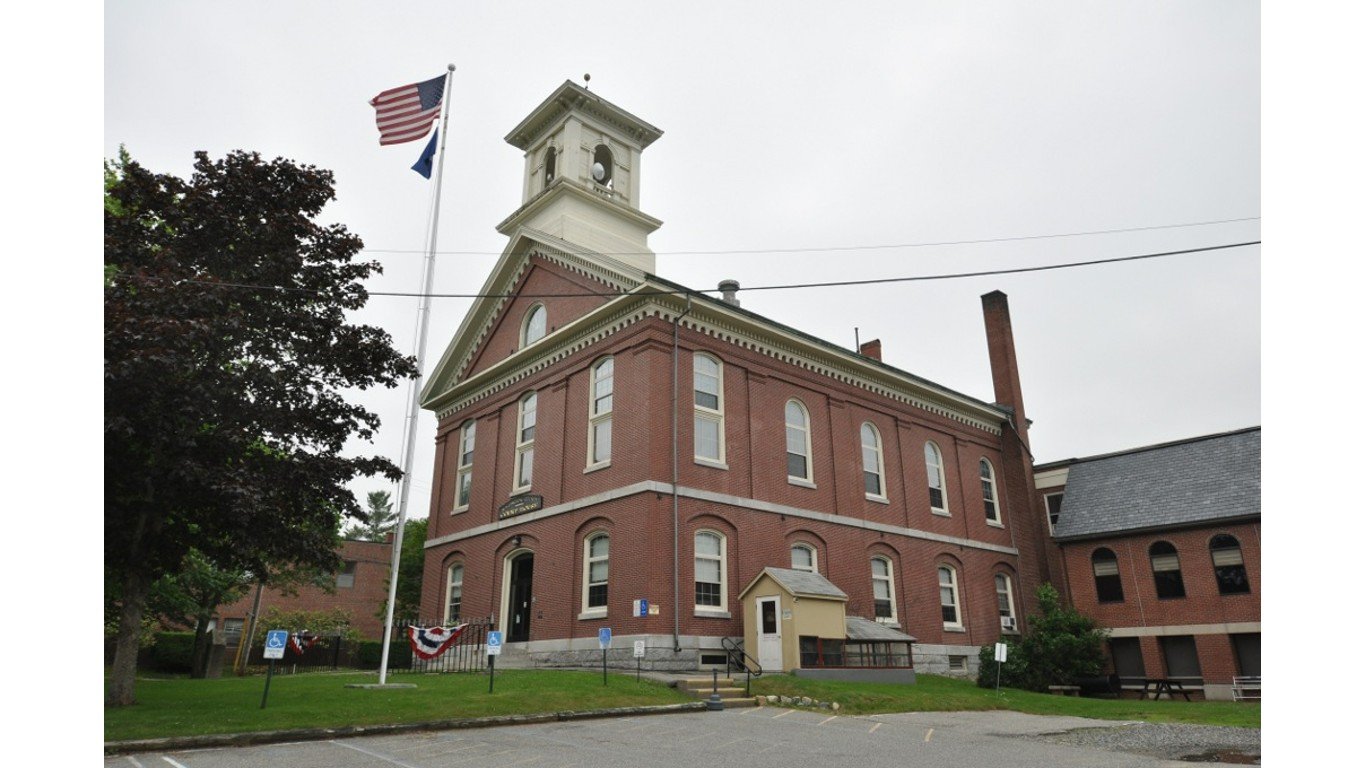
Maine: Machias
> Median household income (2017-2021): $20,333 (Maine: $63,182)
> Median home value (2017-2021): $105,000 (Maine: $212,100)
> Adults with a bachelor’s degree or higher (2017-2021): 18.9% (Maine: 33.6%)
> SNAP recipiency rate (2017-2021): 38.6% (Maine: 12.1%)
> Total population (2017-2021): 1,396 (Maine: 1,357,046)
> No. of cities considered in ranking: 101
[in-text-ad-2]

Maryland: Federalsburg
> Median household income (2017-2021): $31,532 (Maryland: $91,431)
> Median home value (2017-2021): $123,400 (Maryland: $338,500)
> Adults with a bachelor’s degree or higher (2017-2021): 8.3% (Maryland: 41.6%)
> SNAP recipiency rate (2017-2021): 46.0% (Maryland: 10.4%)
> Total population (2017-2021): 2,824 (Maryland: 6,148,545)
> No. of cities considered in ranking: 273

Massachusetts: Ware
> Median household income (2017-2021): $43,783 (Massachusetts: $89,026)
> Median home value (2017-2021): $183,900 (Massachusetts: $424,700)
> Adults with a bachelor’s degree or higher (2017-2021): 16.8% (Massachusetts: 45.2%)
> SNAP recipiency rate (2017-2021): 29.9% (Massachusetts: 12.2%)
> Total population (2017-2021): 6,339 (Massachusetts: 6,991,852)
> No. of cities considered in ranking: 154
[in-text-ad]

Michigan: Baldwin
> Median household income (2017-2021): $22,593 (Michigan: $63,202)
> Median home value (2017-2021): $79,100 (Michigan: $172,100)
> Adults with a bachelor’s degree or higher (2017-2021): 12.3% (Michigan: 30.6%)
> SNAP recipiency rate (2017-2021): 41.3% (Michigan: 12.6%)
> Total population (2017-2021): 1,036 (Michigan: 10,062,512)
> No. of cities considered in ranking: 382
[recirclink id=1169549]
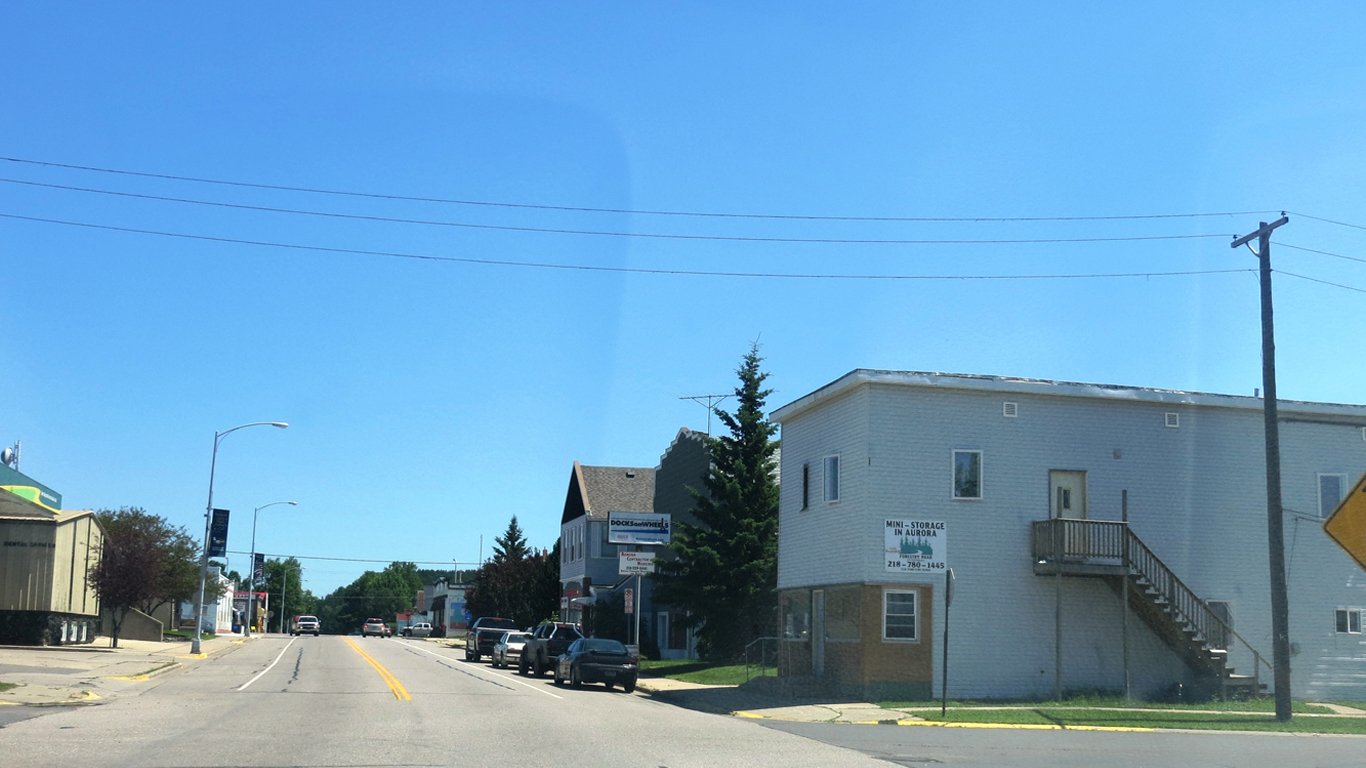
Minnesota: Aurora
> Median household income (2017-2021): $32,287 (Minnesota: $77,706)
> Median home value (2017-2021): $67,600 (Minnesota: $250,200)
> Adults with a bachelor’s degree or higher (2017-2021): 18.6% (Minnesota: 37.6%)
> SNAP recipiency rate (2017-2021): 28.4% (Minnesota: 7.5%)
> Total population (2017-2021): 1,709 (Minnesota: 5,670,472)
> No. of cities considered in ranking: 313
Mississippi: Rosedale
> Median household income (2017-2021): $15,955 (Mississippi: $49,111)
> Median home value (2017-2021): $75,800 (Mississippi: $133,000)
> Adults with a bachelor’s degree or higher (2017-2021): 11.3% (Mississippi: 23.2%)
> SNAP recipiency rate (2017-2021): 38.3% (Mississippi: 14.0%)
> Total population (2017-2021): 1,915 (Mississippi: 2,967,023)
> No. of cities considered in ranking: 173
[in-text-ad-2]
Missouri: Versailles
> Median household income (2017-2021): $22,786 (Missouri: $61,043)
> Median home value (2017-2021): $87,700 (Missouri: $171,800)
> Adults with a bachelor’s degree or higher (2017-2021): 10.1% (Missouri: 30.7%)
> SNAP recipiency rate (2017-2021): 26.7% (Missouri: 10.1%)
> Total population (2017-2021): 2,492 (Missouri: 6,141,534)
> No. of cities considered in ranking: 348
Montana: Plains
> Median household income (2017-2021): $24,844 (Montana: $60,560)
> Median home value (2017-2021): $153,400 (Montana: $263,700)
> Adults with a bachelor’s degree or higher (2017-2021): 11.8% (Montana: 33.7%)
> SNAP recipiency rate (2017-2021): 34.8% (Montana: 9.0%)
> Total population (2017-2021): 1,156 (Montana: 1,077,978)
> No. of cities considered in ranking: 87
[in-text-ad]
Nebraska: Falls City
> Median household income (2017-2021): $37,712 (Nebraska: $66,644)
> Median home value (2017-2021): $72,900 (Nebraska: $174,100)
> Adults with a bachelor’s degree or higher (2017-2021): 22.2% (Nebraska: 32.9%)
> SNAP recipiency rate (2017-2021): 10.3% (Nebraska: 8.0%)
> Total population (2017-2021): 4,130 (Nebraska: 1,951,480)
> No. of cities considered in ranking: 115
[recirclink id=1171562]

Nevada: Tonopah
> Median household income (2017-2021): $33,144 (Nevada: $65,686)
> Median home value (2017-2021): $154,000 (Nevada: $315,900)
> Adults with a bachelor’s degree or higher (2017-2021): 14.3% (Nevada: 26.1%)
> SNAP recipiency rate (2017-2021): 11.2% (Nevada: 11.8%)
> Total population (2017-2021): 1,895 (Nevada: 3,059,238)
> No. of cities considered in ranking: 43

New Hampshire: Ashland
> Median household income (2017-2021): $33,365 (New Hampshire: $83,449)
> Median home value (2017-2021): $160,600 (New Hampshire: $288,700)
> Adults with a bachelor’s degree or higher (2017-2021): 17.3% (New Hampshire: 38.2%)
> SNAP recipiency rate (2017-2021): 14.1% (New Hampshire: 6.1%)
> Total population (2017-2021): 1,778 (New Hampshire: 1,372,175)
> No. of cities considered in ranking: 57
[in-text-ad-2]
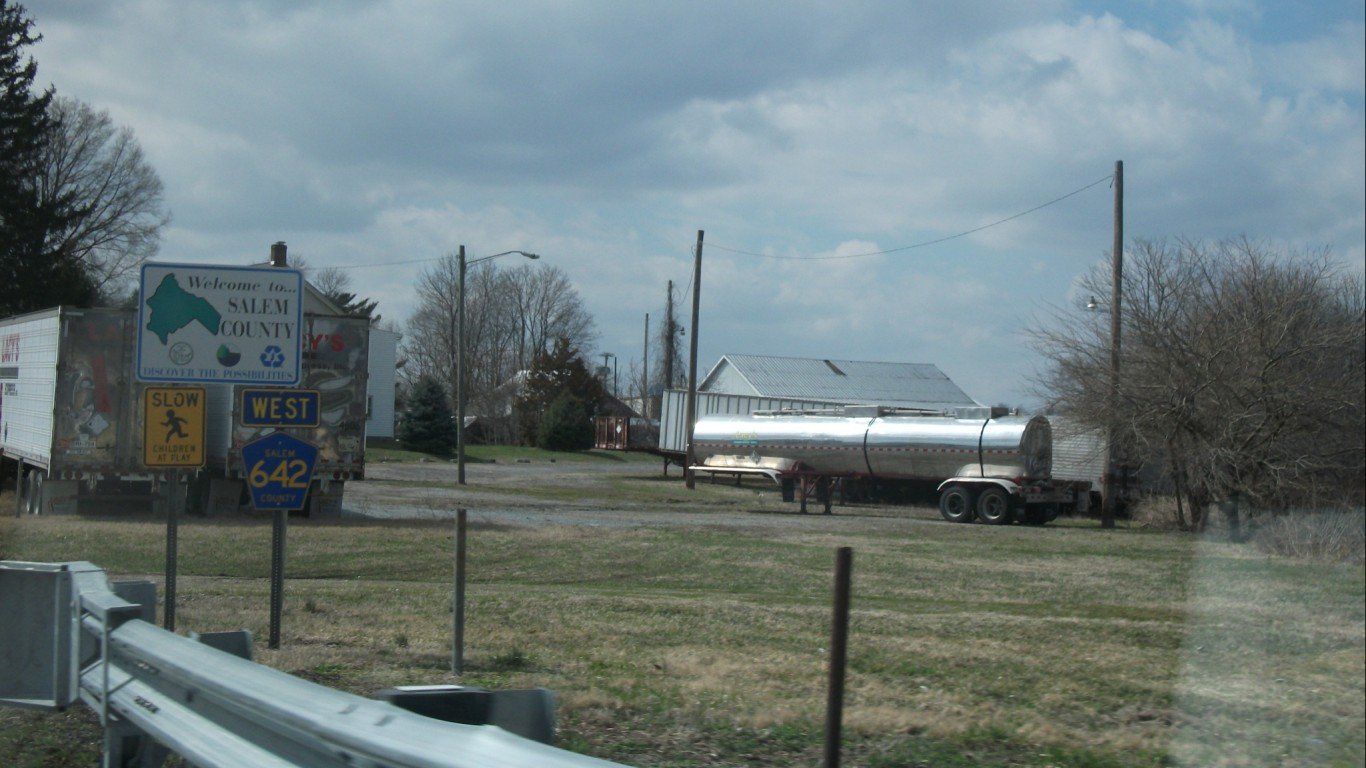
New Jersey: Salem
> Median household income (2017-2021): $26,667 (New Jersey: $89,703)
> Median home value (2017-2021): $59,100 (New Jersey: $355,700)
> Adults with a bachelor’s degree or higher (2017-2021): 10.7% (New Jersey: 41.5%)
> SNAP recipiency rate (2017-2021): 35.2% (New Jersey: 8.4%)
> Total population (2017-2021): 5,237 (New Jersey: 9,234,024)
> No. of cities considered in ranking: 498

New Mexico: University Park
> Median household income (2017-2021): $19,125 (New Mexico: $54,020)
> Median home value (2017-2021): N/A (New Mexico: $184,800)
> Adults with a bachelor’s degree or higher (2017-2021): 32.7% (New Mexico: 28.5%)
> SNAP recipiency rate (2017-2021): 47.5% (New Mexico: 17.5%)
> Total population (2017-2021): 2,608 (New Mexico: 2,109,366)
> No. of cities considered in ranking: 141
[in-text-ad]

New York: Rochester Institute of Technology (Census Designated Place)
> Median household income (2017-2021): $18,229 (New York: $75,157)
> Median home value (2017-2021): N/A (New York: $340,600)
> Adults with a bachelor’s degree or higher (2017-2021): 90.5% (New York: 38.1%)
> SNAP recipiency rate (2017-2021): 2.4% (New York: 14.3%)
> Total population (2017-2021): 5,733 (New York: 20,114,745)
> No. of cities considered in ranking: 750
[recirclink id=1169643]
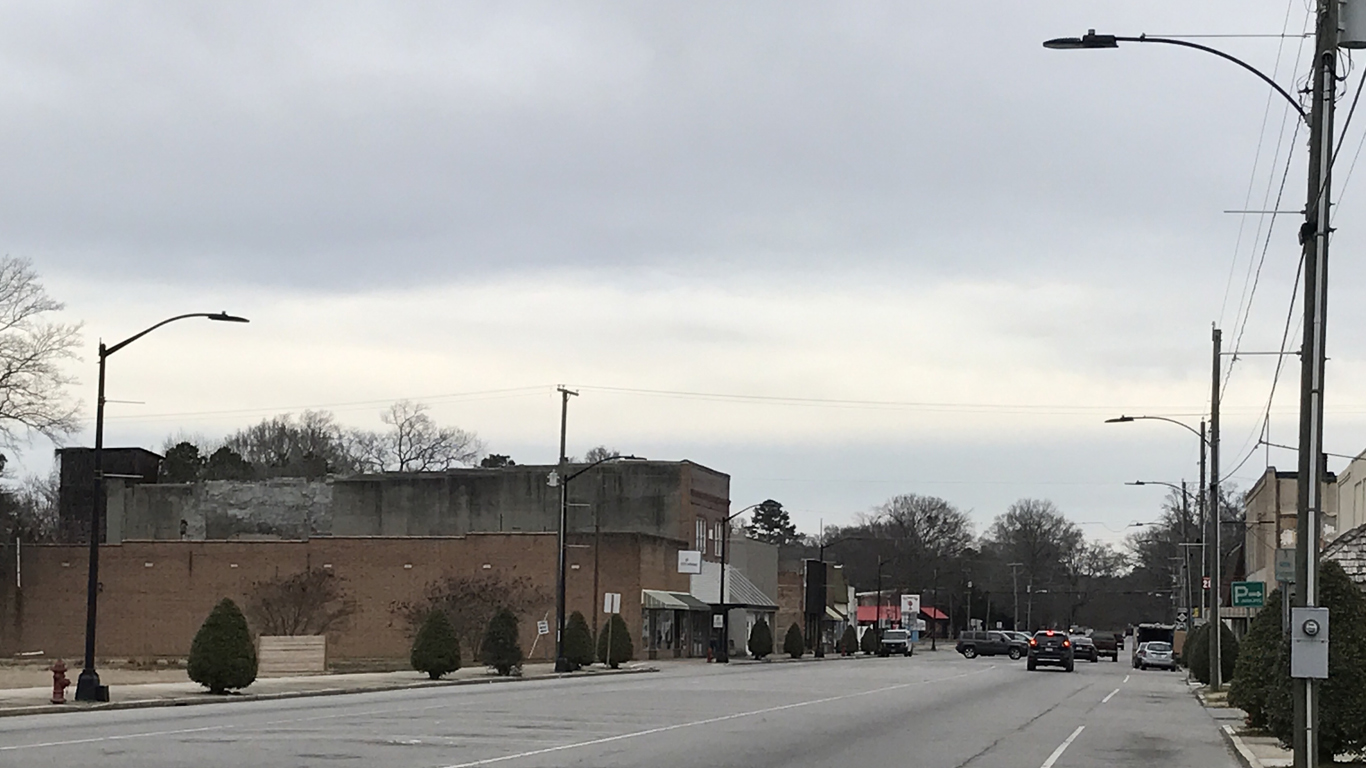
North Carolina: Scotland Neck
> Median household income (2017-2021): $15,985 (North Carolina: $60,516)
> Median home value (2017-2021): $63,300 (North Carolina: $197,500)
> Adults with a bachelor’s degree or higher (2017-2021): 9.4% (North Carolina: 33.0%)
> SNAP recipiency rate (2017-2021): 46.0% (North Carolina: 12.1%)
> Total population (2017-2021): 2,033 (North Carolina: 10,367,022)
> No. of cities considered in ranking: 405
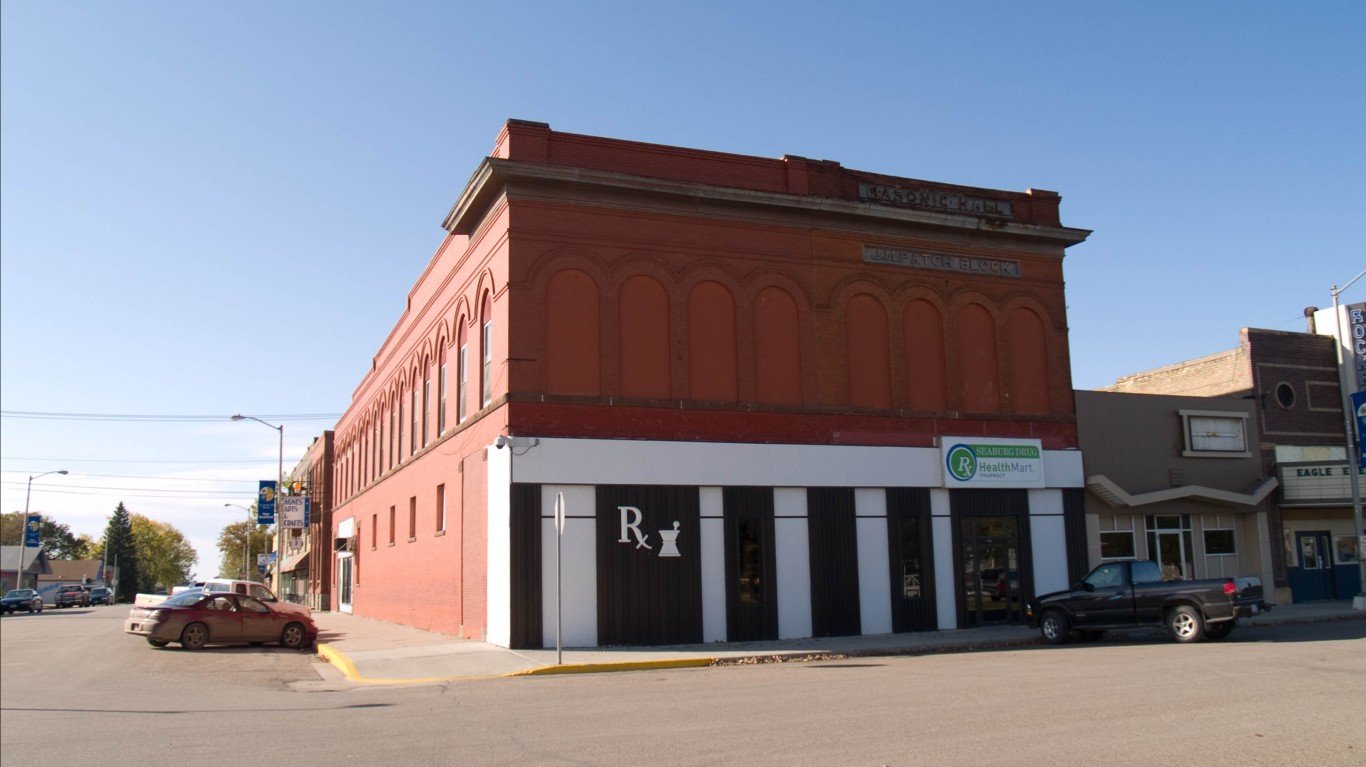
North Dakota: New Rockford
> Median household income (2017-2021): $35,595 (North Dakota: $68,131)
> Median home value (2017-2021): $88,400 (North Dakota: $209,900)
> Adults with a bachelor’s degree or higher (2017-2021): 22.8% (North Dakota: 31.1%)
> SNAP recipiency rate (2017-2021): 17.2% (North Dakota: 6.4%)
> Total population (2017-2021): 1,374 (North Dakota: 773,344)
> No. of cities considered in ranking: 50
[in-text-ad-2]
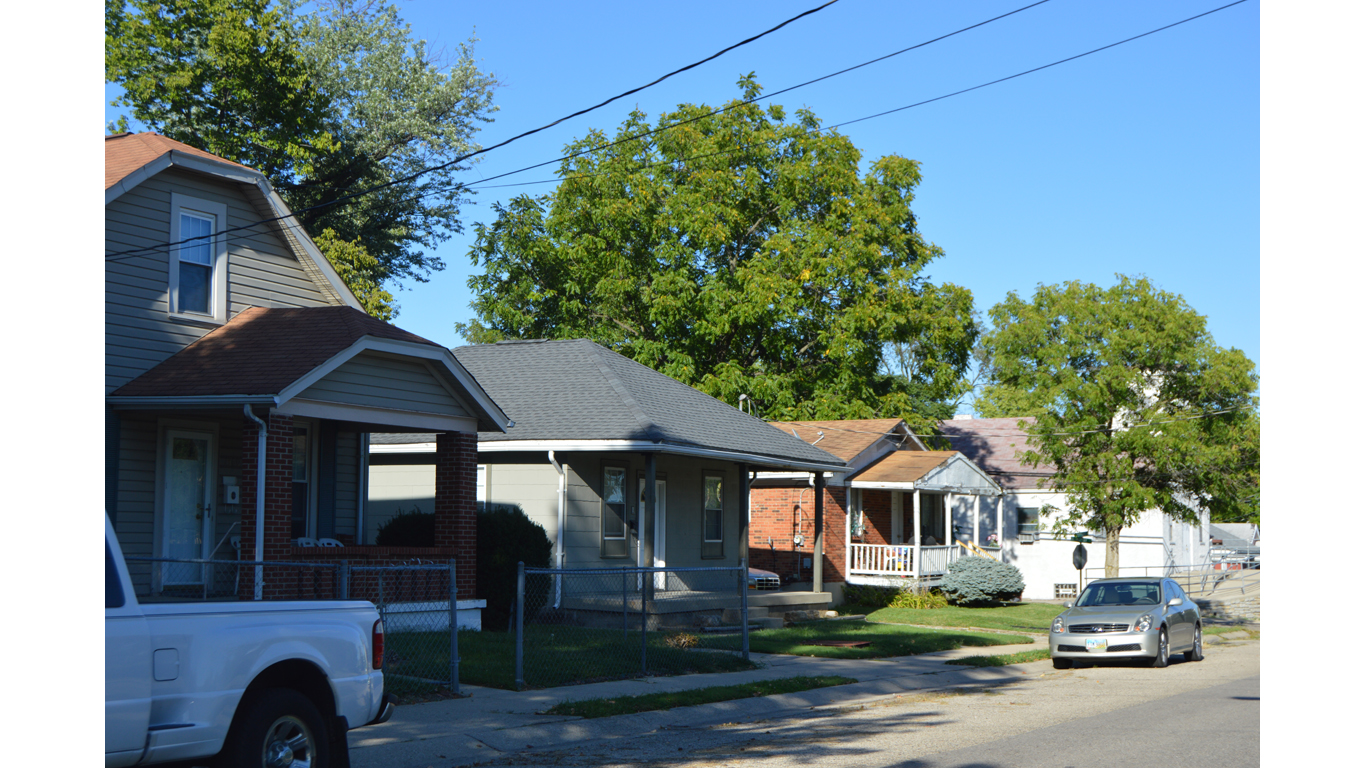
Ohio: Lincoln Heights
> Median household income (2017-2021): $12,183 (Ohio: $61,938)
> Median home value (2017-2021): $72,600 (Ohio: $159,900)
> Adults with a bachelor’s degree or higher (2017-2021): 12.0% (Ohio: 29.7%)
> SNAP recipiency rate (2017-2021): 63.1% (Ohio: 12.4%)
> Total population (2017-2021): 3,153 (Ohio: 11,769,923)
> No. of cities considered in ranking: 623

Oklahoma: Wetumka
> Median household income (2017-2021): $24,769 (Oklahoma: $56,956)
> Median home value (2017-2021): $61,900 (Oklahoma: $150,800)
> Adults with a bachelor’s degree or higher (2017-2021): 15.1% (Oklahoma: 26.8%)
> SNAP recipiency rate (2017-2021): 21.6% (Oklahoma: 12.6%)
> Total population (2017-2021): 1,294 (Oklahoma: 3,948,136)
> No. of cities considered in ranking: 225
[in-text-ad]
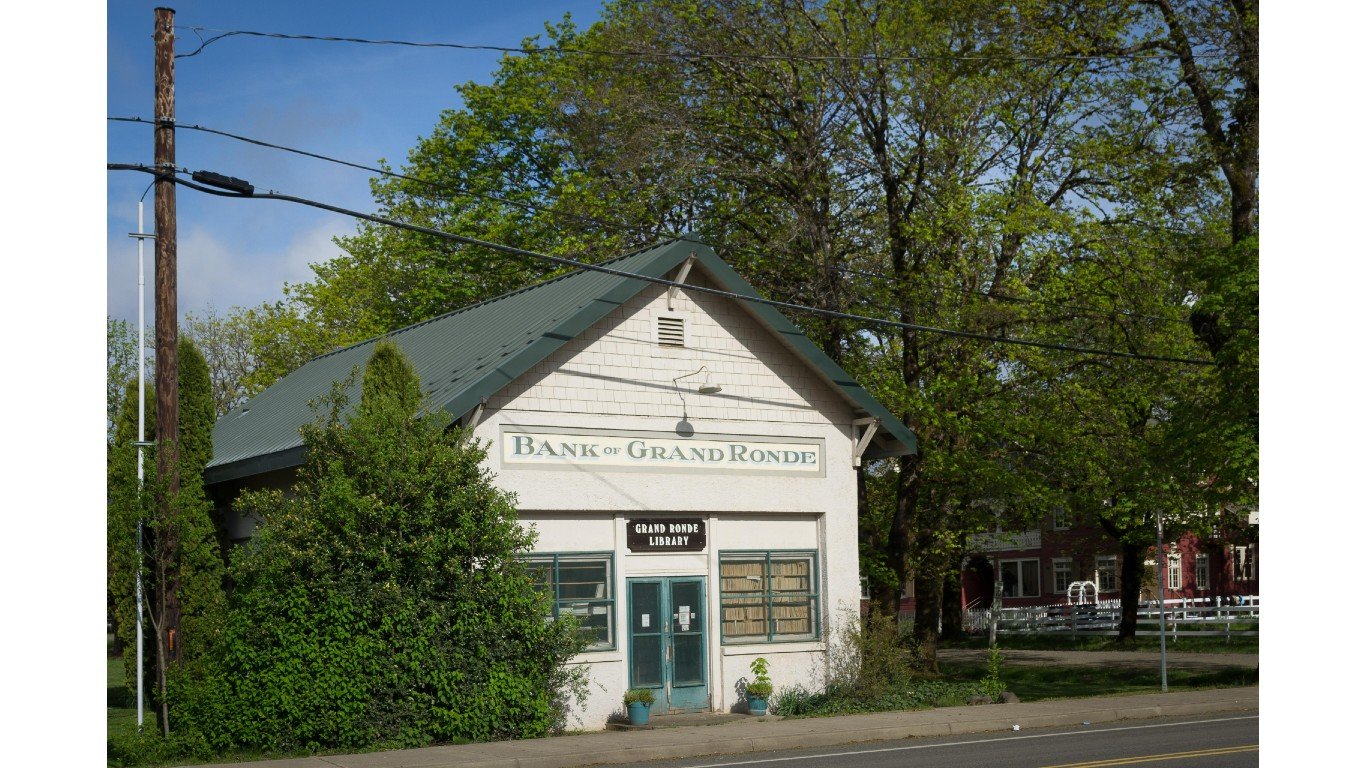
Oregon: Grand Ronde
> Median household income (2017-2021): $27,465 (Oregon: $70,084)
> Median home value (2017-2021): $183,900 (Oregon: $362,200)
> Adults with a bachelor’s degree or higher (2017-2021): 8.0% (Oregon: 35.0%)
> SNAP recipiency rate (2017-2021): 46.2% (Oregon: 14.7%)
> Total population (2017-2021): 1,334 (Oregon: 4,207,177)
> No. of cities considered in ranking: 200
[recirclink id=1061632]
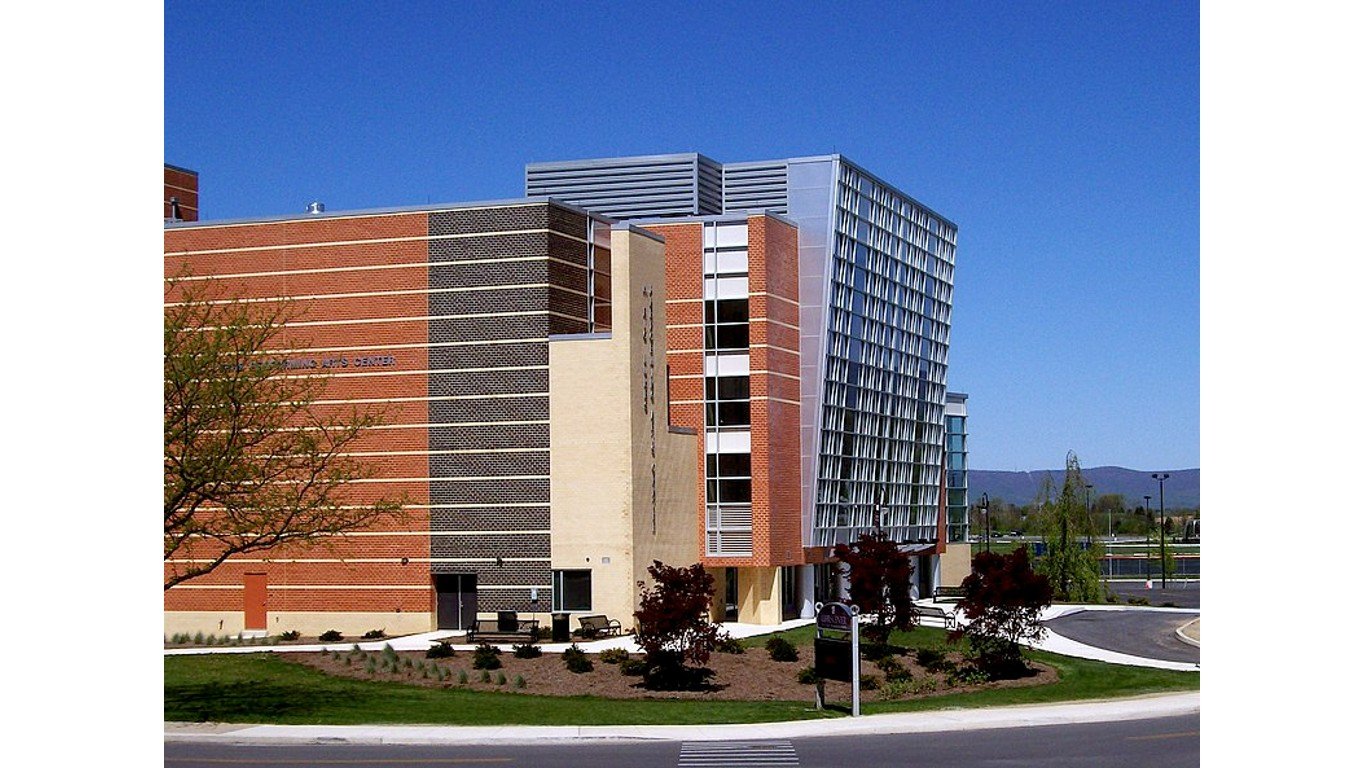
Pennsylvania: Shippensburg University
> Median household income (2017-2021): $18,125 (Pennsylvania: $67,587)
> Median home value (2017-2021): N/A (Pennsylvania: $197,300)
> Adults with a bachelor’s degree or higher (2017-2021): 77.8% (Pennsylvania: 33.1%)
> SNAP recipiency rate (2017-2021): 0.0% (Pennsylvania: 13.4%)
> Total population (2017-2021): 1,800 (Pennsylvania: 12,970,650)
> No. of cities considered in ranking: 942

Rhode Island: Central Falls
> Median household income (2017-2021): $40,235 (Rhode Island: $74,489)
> Median home value (2017-2021): $187,300 (Rhode Island: $292,600)
> Adults with a bachelor’s degree or higher (2017-2021): 9.2% (Rhode Island: 35.3%)
> SNAP recipiency rate (2017-2021): 33.7% (Rhode Island: 14.7%)
> Total population (2017-2021): 22,192 (Rhode Island: 1,091,949)
> No. of cities considered in ranking: 19
[in-text-ad-2]
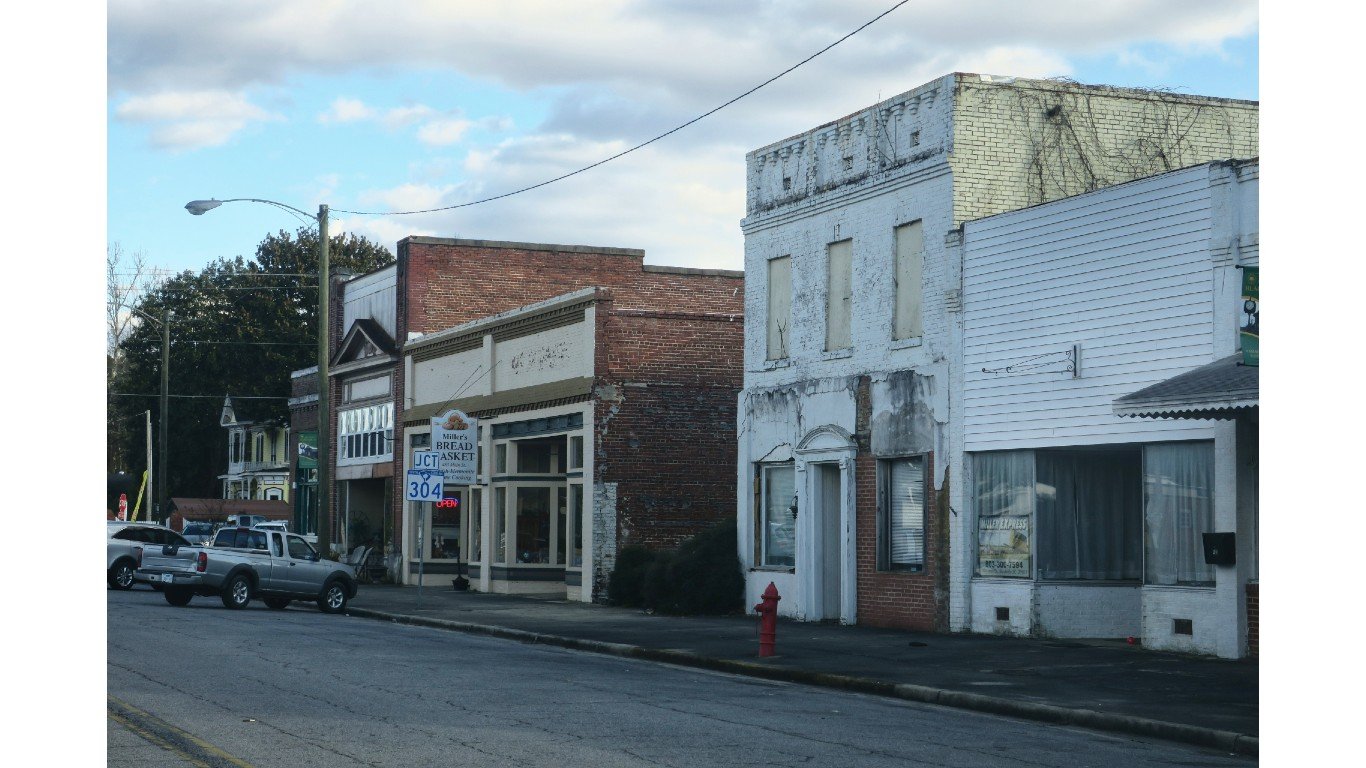
South Carolina: Blackville
> Median household income (2017-2021): $19,583 (South Carolina: $58,234)
> Median home value (2017-2021): $67,500 (South Carolina: $181,800)
> Adults with a bachelor’s degree or higher (2017-2021): 11.4% (South Carolina: 29.8%)
> SNAP recipiency rate (2017-2021): 45.8% (South Carolina: 10.7%)
> Total population (2017-2021): 2,135 (South Carolina: 5,078,903)
> No. of cities considered in ranking: 236

South Dakota: Fort Thompson
> Median household income (2017-2021): $24,125 (South Dakota: $63,920)
> Median home value (2017-2021): $96,900 (South Dakota: $187,800)
> Adults with a bachelor’s degree or higher (2017-2021): 5.8% (South Dakota: 30.0%)
> SNAP recipiency rate (2017-2021): 44.1% (South Dakota: 8.4%)
> Total population (2017-2021): 1,266 (South Dakota: 881,785)
> No. of cities considered in ranking: 74
[in-text-ad]
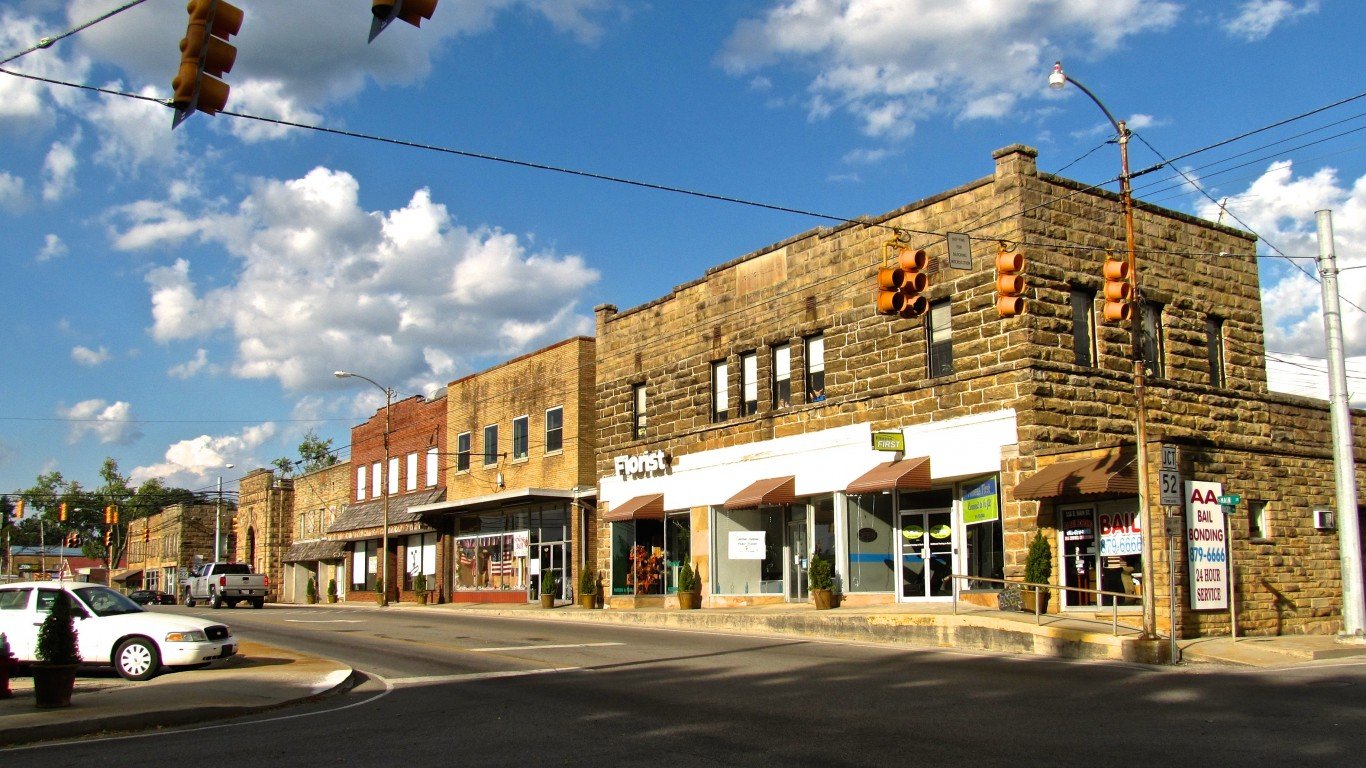
Tennessee: Jamestown
> Median household income (2017-2021): $18,000 (Tennessee: $58,516)
> Median home value (2017-2021): $68,100 (Tennessee: $193,700)
> Adults with a bachelor’s degree or higher (2017-2021): 2.3% (Tennessee: 29.0%)
> SNAP recipiency rate (2017-2021): 47.2% (Tennessee: 12.1%)
> Total population (2017-2021): 2,058 (Tennessee: 6,859,497)
> No. of cities considered in ranking: 272
[recirclink id=1158926]

Texas: Carrizo Hill
> Median household income (2017-2021): $9,110 (Texas: $67,321)
> Median home value (2017-2021): N/A (Texas: $202,600)
> Adults with a bachelor’s degree or higher (2017-2021): 0.0% (Texas: 31.5%)
> SNAP recipiency rate (2017-2021): 10.3% (Texas: 11.5%)
> Total population (2017-2021): 1,076 (Texas: 28,862,581)
> No. of cities considered in ranking: 877

Utah: East Carbon
> Median household income (2017-2021): $39,583 (Utah: $79,133)
> Median home value (2017-2021): $64,200 (Utah: $339,700)
> Adults with a bachelor’s degree or higher (2017-2021): 12.1% (Utah: 35.4%)
> SNAP recipiency rate (2017-2021): 25.9% (Utah: 5.9%)
> Total population (2017-2021): 1,524 (Utah: 3,231,370)
> No. of cities considered in ranking: 135
[in-text-ad-2]

Vermont: West Brattleboro
> Median household income (2017-2021): $36,618 (Vermont: $67,674)
> Median home value (2017-2021): $178,500 (Vermont: $240,600)
> Adults with a bachelor’s degree or higher (2017-2021): 31.9% (Vermont: 40.9%)
> SNAP recipiency rate (2017-2021): 26.8% (Vermont: 10.3%)
> Total population (2017-2021): 2,770 (Vermont: 641,637)
> No. of cities considered in ranking: 47

Virginia: Jonesville
> Median household income (2017-2021): $17,344 (Virginia: $80,615)
> Median home value (2017-2021): $117,200 (Virginia: $295,500)
> Adults with a bachelor’s degree or higher (2017-2021): 14.3% (Virginia: 40.3%)
> SNAP recipiency rate (2017-2021): 48.0% (Virginia: 8.0%)
> Total population (2017-2021): 1,313 (Virginia: 8,582,479)
> No. of cities considered in ranking: 328
[in-text-ad]

Washington: Oroville
> Median household income (2017-2021): $32,083 (Washington: $82,400)
> Median home value (2017-2021): $142,700 (Washington: $397,600)
> Adults with a bachelor’s degree or higher (2017-2021): 9.1% (Washington: 37.3%)
> SNAP recipiency rate (2017-2021): 30.3% (Washington: 11.2%)
> Total population (2017-2021): 1,694 (Washington: 7,617,364)
> No. of cities considered in ranking: 345
[recirclink id=1169549]
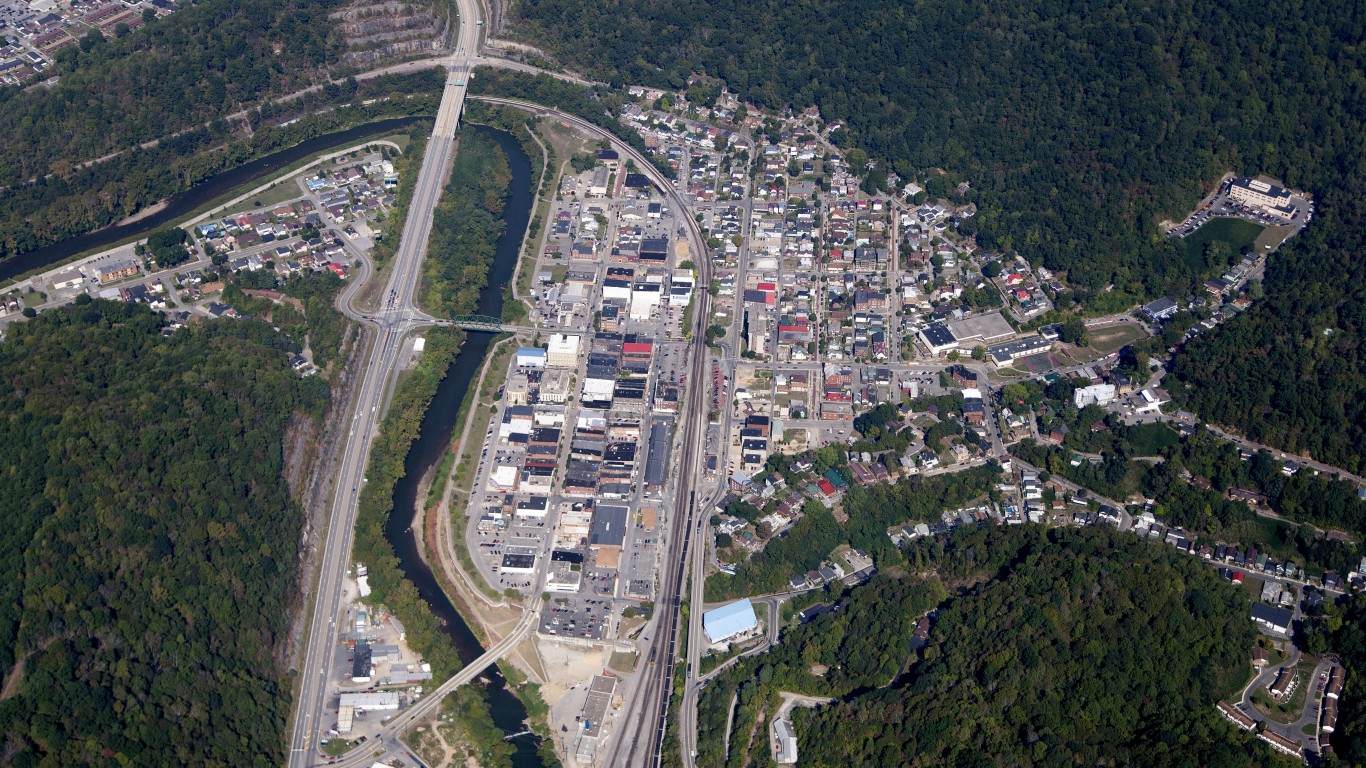
West Virginia: Williamson
> Median household income (2017-2021): $18,640 (West Virginia: $50,884)
> Median home value (2017-2021): $81,800 (West Virginia: $128,800)
> Adults with a bachelor’s degree or higher (2017-2021): 10.6% (West Virginia: 21.8%)
> SNAP recipiency rate (2017-2021): 37.9% (West Virginia: 16.4%)
> Total population (2017-2021): 3,054 (West Virginia: 1,801,049)
> No. of cities considered in ranking: 143

Wisconsin: Lac du Flambeau
> Median household income (2017-2021): $26,076 (Wisconsin: $67,080)
> Median home value (2017-2021): $77,500 (Wisconsin: $200,400)
> Adults with a bachelor’s degree or higher (2017-2021): 14.6% (Wisconsin: 31.5%)
> SNAP recipiency rate (2017-2021): 18.1% (Wisconsin: 10.2%)
> Total population (2017-2021): 1,776 (Wisconsin: 5,871,661)
> No. of cities considered in ranking: 357
[in-text-ad-2]

Wyoming: Fort Washakie
> Median household income (2017-2021): $41,944 (Wyoming: $68,002)
> Median home value (2017-2021): $116,100 (Wyoming: $237,900)
> Adults with a bachelor’s degree or higher (2017-2021): 8.8% (Wyoming: 28.5%)
> SNAP recipiency rate (2017-2021): 20.6% (Wyoming: 5.2%)
> Total population (2017-2021): 1,647 (Wyoming: 576,641)
> No. of cities considered in ranking: 52
Methodology
To identify America’s poorest towns, 24/7 Wall St. reviewed five-year estimates of median household income from the U.S. Census Bureau’s 2021 American Community Survey five-year estimates.
We used census “place” geographies — a category that includes incorporated legal entities and census-designated statistical entities. We defined towns based on population thresholds — having at least 1,000 people and less than 25,000 people.
Towns were excluded if median household income was not available in the 2021 ACS or if the sampling error associated with a town’s data was deemed too high.
Additional data on the median home values, educational attainment, SNAP recipiency rate, and population are also from the ACS five-year estimates.
Contact [email protected] for any questions or corrections.