
Planning for retirement should be a lifelong endeavor that begins the moment you start earning enough income to sock some of it away. The earlier you start the better as compound interest and capital gains investments give up more profit when they have a longer time to accrue.
Planning your life after 65 might include a new (and probably last) place to call home — one that offers important amenities like easy access to physical activities and doctors, ideally in a welcoming environment. (Affordability is important too, and Hawaii is the most expensive state to retire in.)
To determine the best places to retire in every state, 24/7 Wall St. developed an index of 11 different measures related to the health and well-being of the 65 years and over population using data from County Health Rankings and Roadmaps. The measure included air quality, access to and quality of local health care, population makeup and change, leisure activity options, and more. U.S. county or county equivalents were ranked based on the index, and the best in each state are listed here.
The populations of the best counties to retire in each state range from small rural townships to large urban or suburban areas. Thirteen have populations below 10,000 residents and are widely dispersed.
There is tiny Jeff Davis County in West Texas, where well over a third of its 2,021 residents are 65 years or older and life expectancy at birth is one of the highest at over 84 years. Another small county is Cook County in the northeastern tip of Minnesota, with a population of 5,574. Retirees there have among the highest concentration of primary care physicians, at 142 per 100,000 people, the same as in New York County (Manhattan), which has a population of 1.7 million.
Three other counties on the list have populations over half a million — Pennsylvania’s Montgomery County, adjacent to Philadelphia; St. Louis County, Missouri; and Morris County, New Jersey. (Find out if any of these are among the counties with the most affordable homes in America.)
If you prefer to be around fellow retirees, more than a third of the population is over the age of 65 in four of the counties listed, led by Sumter County, Florida. With a total population of more than 127,000 people, Sumter is home to The Villages, the country’s largest age-restricted planned community. Nearly six out of 10 people in Sumer County are 65 or over, the nation’s highest ratio by a long shot.
Retirees searching for a place to live out their years might also want to consider life expectancy at birth among these 50 counties.
Five of the counties on the list have average life lower expectancy than the national average of 76.1 years, led by Johnson County, Tennessee, whose retirees also live 1.3 years less than the statewide average of 75.3 years and have access to well under half of the number of primary care physicians than the state’s average of 70 per 100,000 people. However, most of the 50 counties that are best for retirees in their state have average life expectancies of more than 80 years, led by Pitkin County, Colorado, whose county seat is the small and affluent municipality of Aspen.
Here are the best places to retire in every state.
Click here to see our detailed methodology.
Source: peeterv / iStock via Getty Images
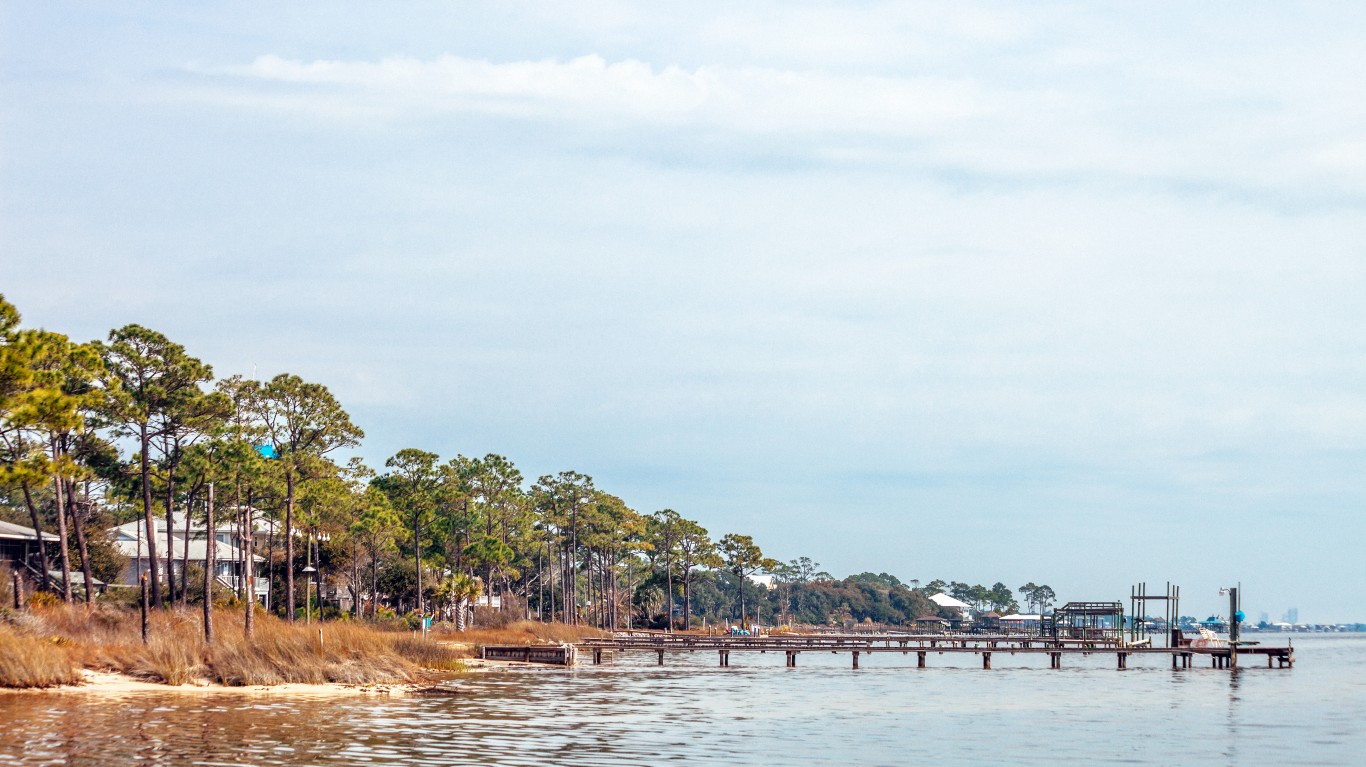
Alabama: Baldwin County
> 65+ population: 20.6% (state: 16.9%)
> Life expectancy: 77.7 years (state: 74.8 years)
> Pop. w/ access to physical activity locations: 65.7% (state: 60.9%)
> Primary care physicians: 62.7 per 100,000 (state: 64.2 per 100,000)
> County seat: Bay Minette
[in-text-ad]

Alaska: Haines Borough
> 65+ population: 20.9% (state: 12.3%)
> Life expectancy: 84.4 years (state: 78.6 years)
> Pop. w/ access to physical activity locations: 96.8% (state: 75.7%)
> Primary care physicians: 289.7 per 100,000 (state: 97.3 per 100,000)
> County seat: Haines
 24/7 Wall St.
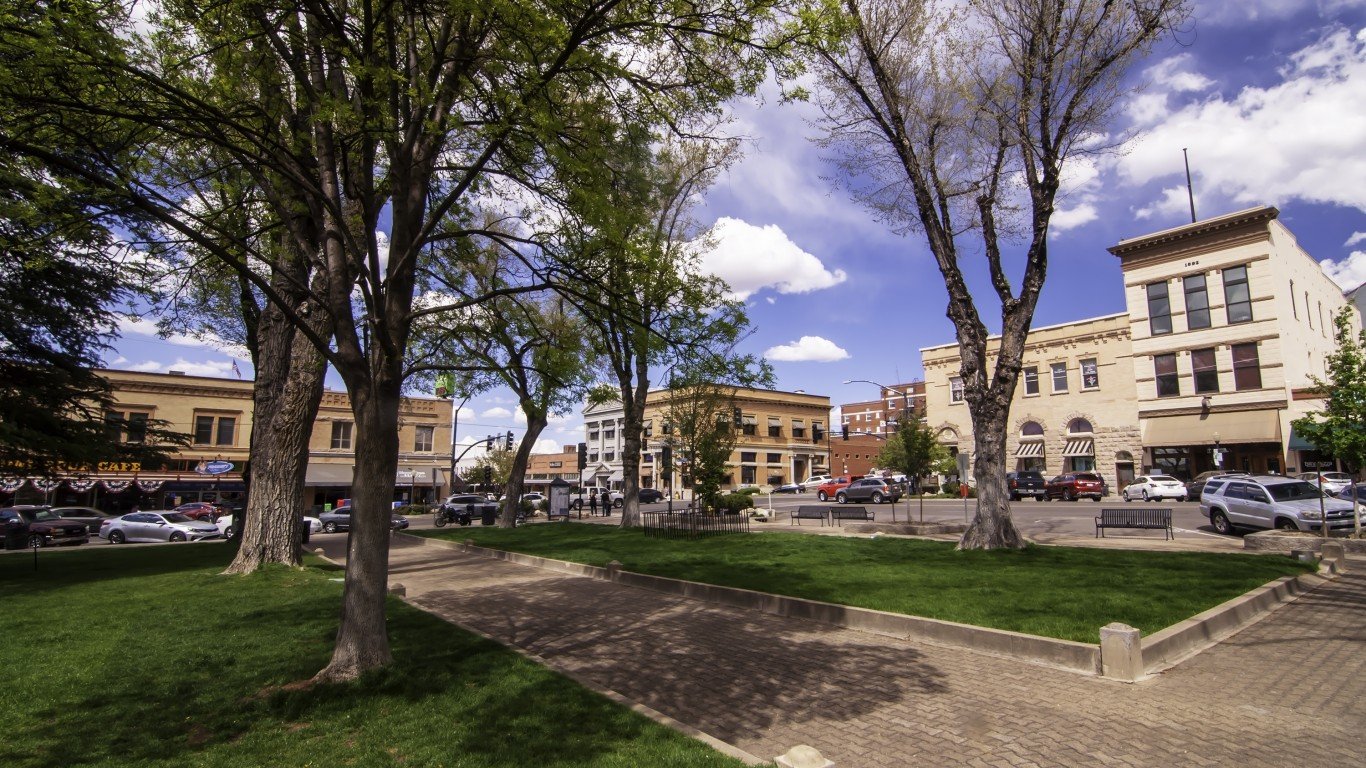
Source: Althom / iStock Editorial via Getty Images
Arizona: Yavapai County
> 65+ population: 31.9% (state: 17.6%)
> Life expectancy: 78.4 years (state: 79.1 years)
> Pop. w/ access to physical activity locations: 85.0% (state: 86.2%)
> Primary care physicians: 57.4 per 100,000 (state: 66.9 per 100,000)
> County seat: Prescott

Arkansas: Montgomery County
> 65+ population: 26.8% (state: 16.8%)
> Life expectancy: 75.1 years (state: 75.5 years)
> Pop. w/ access to physical activity locations: 97.2% (state: 63.0%)
> Primary care physicians: 23.2 per 100,000 (state: 68.1 per 100,000)
> County seat: Mount Ida
[in-text-ad-2]

Source: tiburonstudios / E+ via Getty Images
California: Marin County
> 65+ population: 22.4% (state: 14.4%)
> Life expectancy: 85.2 years (state: 81.0 years)
> Pop. w/ access to physical activity locations: 97.5% (state: 94.6%)
> Primary care physicians: 144.9 per 100,000 (state: 81.3 per 100,000)
> County seat: San Rafael

Source: Jonathan Ross / iStock via Getty Images
Colorado: Pitkin County
> 65+ population: 19.3% (state: 14.3%)
> Life expectancy: 92.5 years (state: 80.0 years)
> Pop. w/ access to physical activity locations: 94.6% (state: 90.4%)
> Primary care physicians: 86.5 per 100,000 (state: 83.0 per 100,000)
> County seat: Aspen
[in-text-ad]

Source: DenisTangneyJr / iStock via Getty Images
Connecticut: Middlesex County
> 65+ population: 20.5% (state: 17.2%)
> Life expectancy: 80.8 years (state: 80.1 years)
> Pop. w/ access to physical activity locations: 97.3% (state: 93.5%)
> Primary care physicians: 78.3 per 100,000 (state: 84.4 per 100,000)
> County seat: Middletown
 24/7 Wall St.
Source: Robert Kirk / iStock via Getty Images
Delaware: Sussex County
> 65+ population: 28.3% (state: 19.0%)
> Life expectancy: 78.4 years (state: 78.0 years)
> Pop. w/ access to physical activity locations: 65.0% (state: 81.3%)
> Primary care physicians: 57.8 per 100,000 (state: 73.9 per 100,000)
> County seat: Georgetown
Source: Ken Badgley / Getty Images
Florida: Sumter County
> 65+ population: 57.6% (state: 20.4%)
> Life expectancy: 80.2 years (state: 79.7 years)
> Pop. w/ access to physical activity locations: 88.8% (state: 88.2%)
> Primary care physicians: 39.8 per 100,000 (state: 72.5 per 100,000)
> County seat: Bushnell
[in-text-ad-2]

Georgia: Towns County
> 65+ population: 33.7% (state: 13.9%)
> Life expectancy: 79.0 years (state: 77.3 years)
> Pop. w/ access to physical activity locations: 100.0% (state: 74.6%)
> Primary care physicians: 54.4 per 100,000 (state: 66.5 per 100,000)
> County seat: Hiawassee

Source: Joshua Hicks / iStock via Getty Images
Hawaii: Kauai County
> 65+ population: 20.3% (state: 18.5%)
> Life expectancy: 82.3 years (state: 82.3 years)
> Pop. w/ access to physical activity locations: 91.8% (state: 93.7%)
> Primary care physicians: 81.7 per 100,000 (state: 90.5 per 100,000)
> County seat: Lihue
[in-text-ad]
Source: BOB WESTON / iStock via Getty Images
Idaho: Blaine County
> 65+ population: 19.1% (state: 15.8%)
> Life expectancy: 85.2 years (state: 79.2 years)
> Pop. w/ access to physical activity locations: 74.5% (state: 74.7%)
> Primary care physicians: 88.8 per 100,000 (state: 61.7 per 100,000)
> County seat: Hailey
Source: BOB WESTON / iStock via Getty Images
Illinois: Monroe County
> 65+ population: 17.7% (state: 15.7%)
> Life expectancy: 80.7 years (state: 78.6 years)
> Pop. w/ access to physical activity locations: 85.6% (state: 90.4%)
> Primary care physicians: 37.2 per 100,000 (state: 80.6 per 100,000)
> County seat: Waterloo

Source: Roberto Galan / iStock Editorial via Getty Images
Indiana: Dubois County
> 65+ population: 17.3% (state: 15.7%)
> Life expectancy: 79.2 years (state: 76.5 years)
> Pop. w/ access to physical activity locations: 75.5% (state: 76.8%)
> Primary care physicians: 78.1 per 100,000 (state: 66.1 per 100,000)
> County seat: Jasper
[in-text-ad-2]
Source: Public Domain / Wikimedia Commons
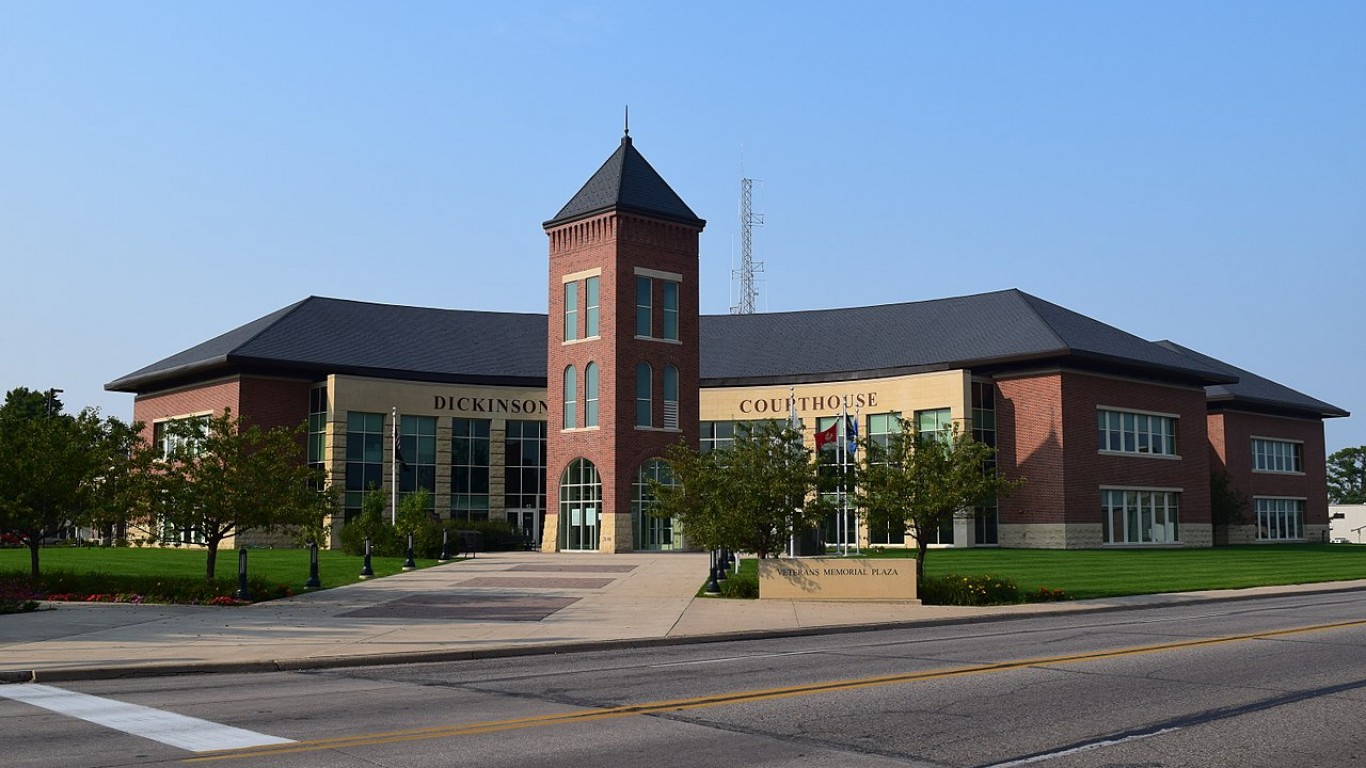
Iowa: Dickinson County
> 65+ population: 25.9% (state: 17.0%)
> Life expectancy: 80.7 years (state: 78.7 years)
> Pop. w/ access to physical activity locations: 84.2% (state: 79.3%)
> Primary care physicians: 72.8 per 100,000 (state: 73.0 per 100,000)
> County seat: Spirit Lake
Source: marekuliasz / iStock via Getty Images
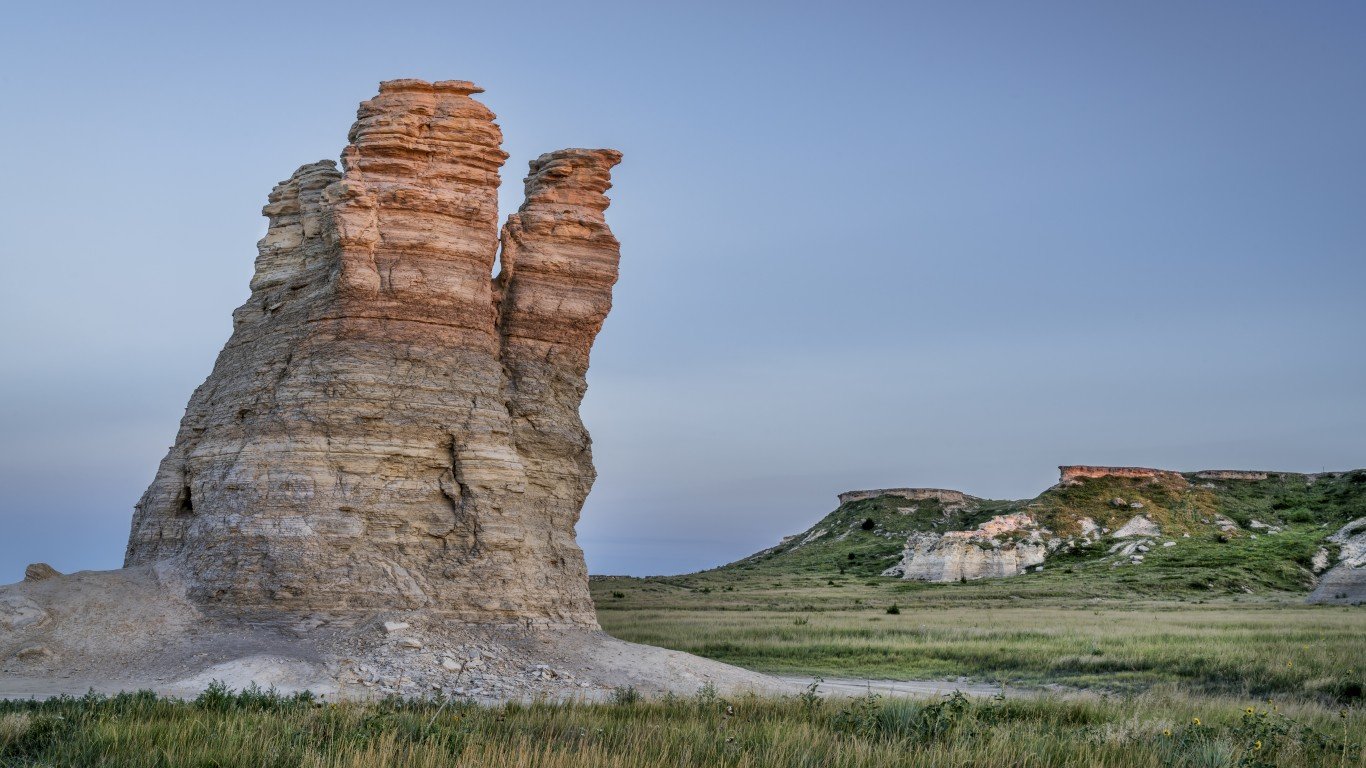
Kansas: Gove County
> 65+ population: 24.8% (state: 15.8%)
> Life expectancy: 80.2 years (state: 77.8 years)
> Pop. w/ access to physical activity locations: 42.9% (state: 79.7%)
> Primary care physicians: 217.8 per 100,000 (state: 78.8 per 100,000)
> County seat: Gove City
[in-text-ad]
Source: Ivelin Denev / iStock via Getty Images
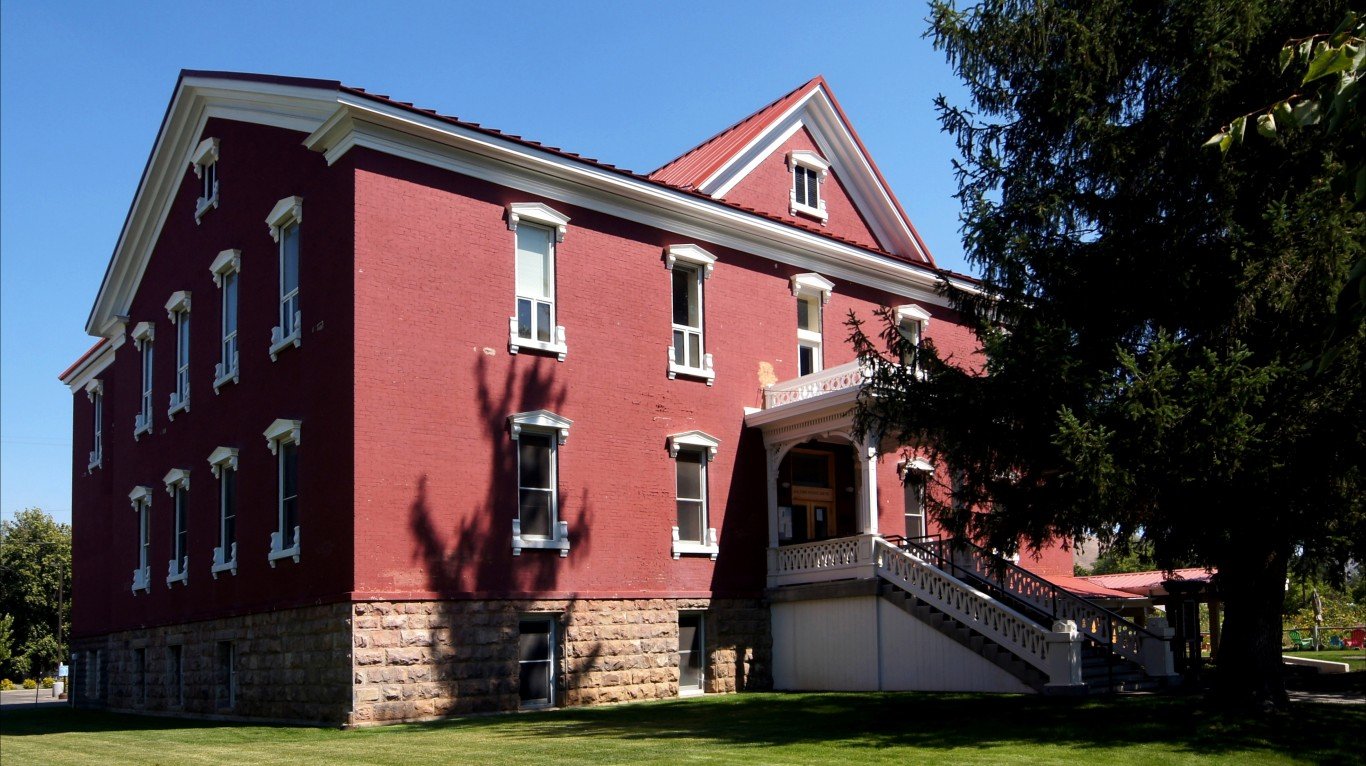
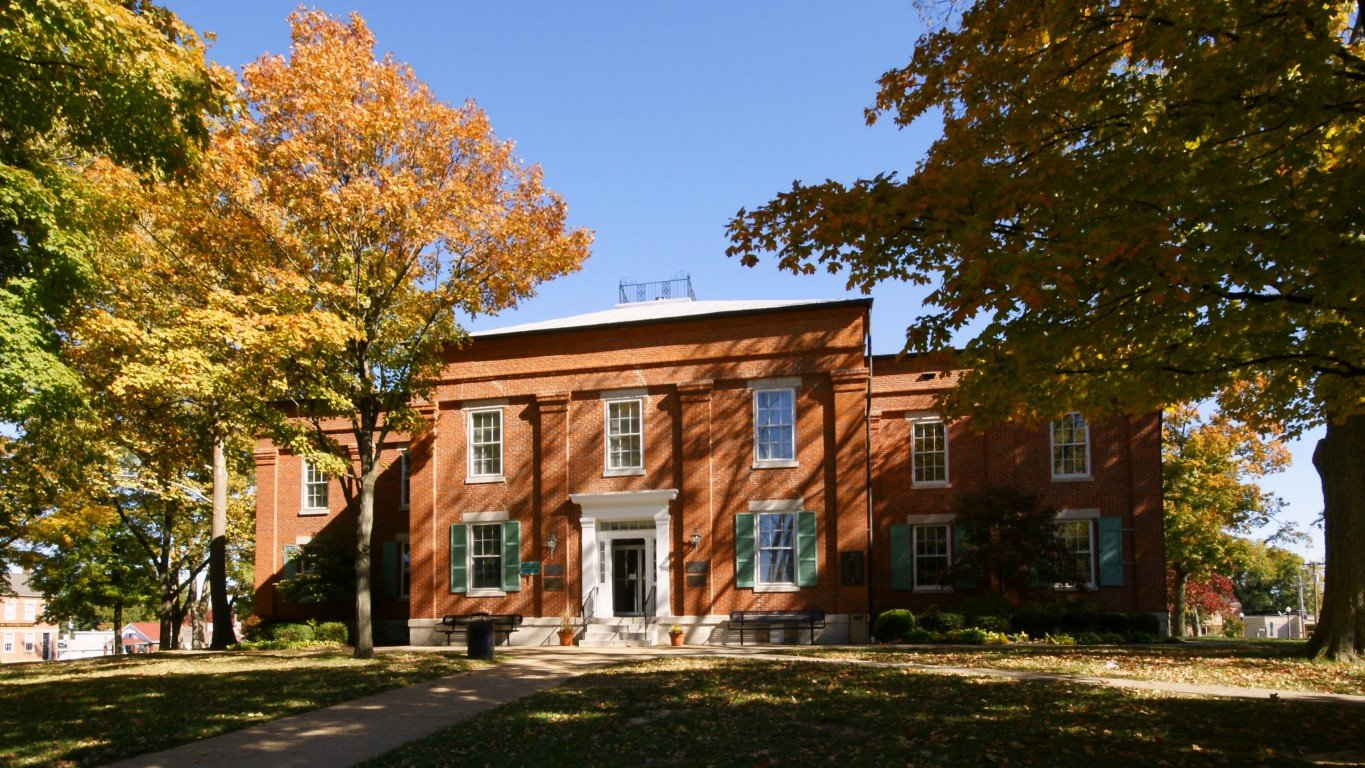
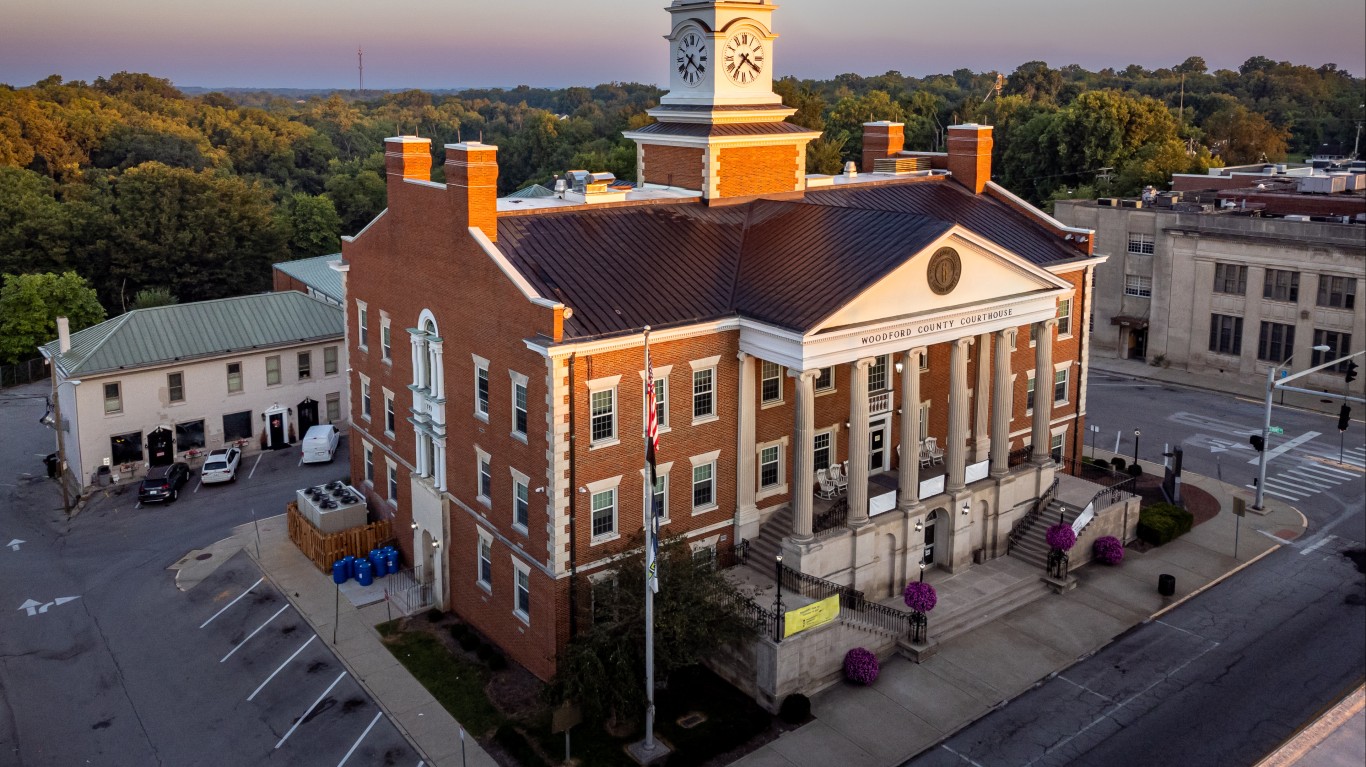
Kentucky: Woodford County
> 65+ population: 18.5% (state: 16.4%)
> Life expectancy: 77.6 years (state: 75.1 years)
> Pop. w/ access to physical activity locations: 83.0% (state: 69.9%)
> Primary care physicians: 66.5 per 100,000 (state: 64.0 per 100,000)
> County seat: Versailles
 24/7 Wall St.
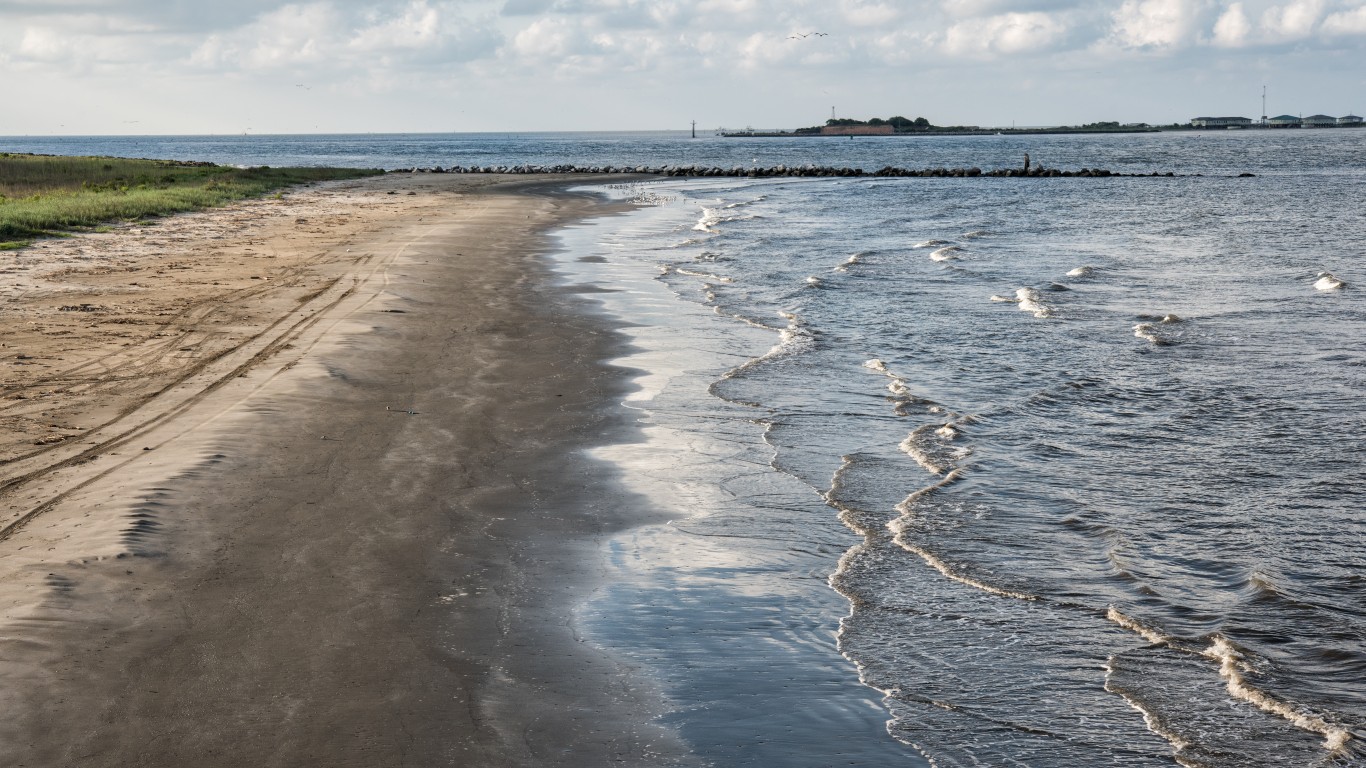
Source: Judy Darby / iStock via Getty Images
Louisiana: Jefferson Parish
> 65+ population: 17.3% (state: 15.5%)
> Life expectancy: 76.7 years (state: 75.2 years)
> Pop. w/ access to physical activity locations: 96.3% (state: 75.8%)
> Primary care physicians: 97.8 per 100,000 (state: 70.4 per 100,000)
> County seat: Gretna

Source: Ultima_Gaina / iStock via Getty Images
Maine: Hancock County
> 65+ population: 25.1% (state: 20.7%)
> Life expectancy: 79.5 years (state: 78.6 years)
> Pop. w/ access to physical activity locations: 66.4% (state: 65.7%)
> Primary care physicians: 115.7 per 100,000 (state: 109.3 per 100,000)
> County seat: Ellsworth
[in-text-ad-2]
Source: Joesboy / iStock via Getty Images
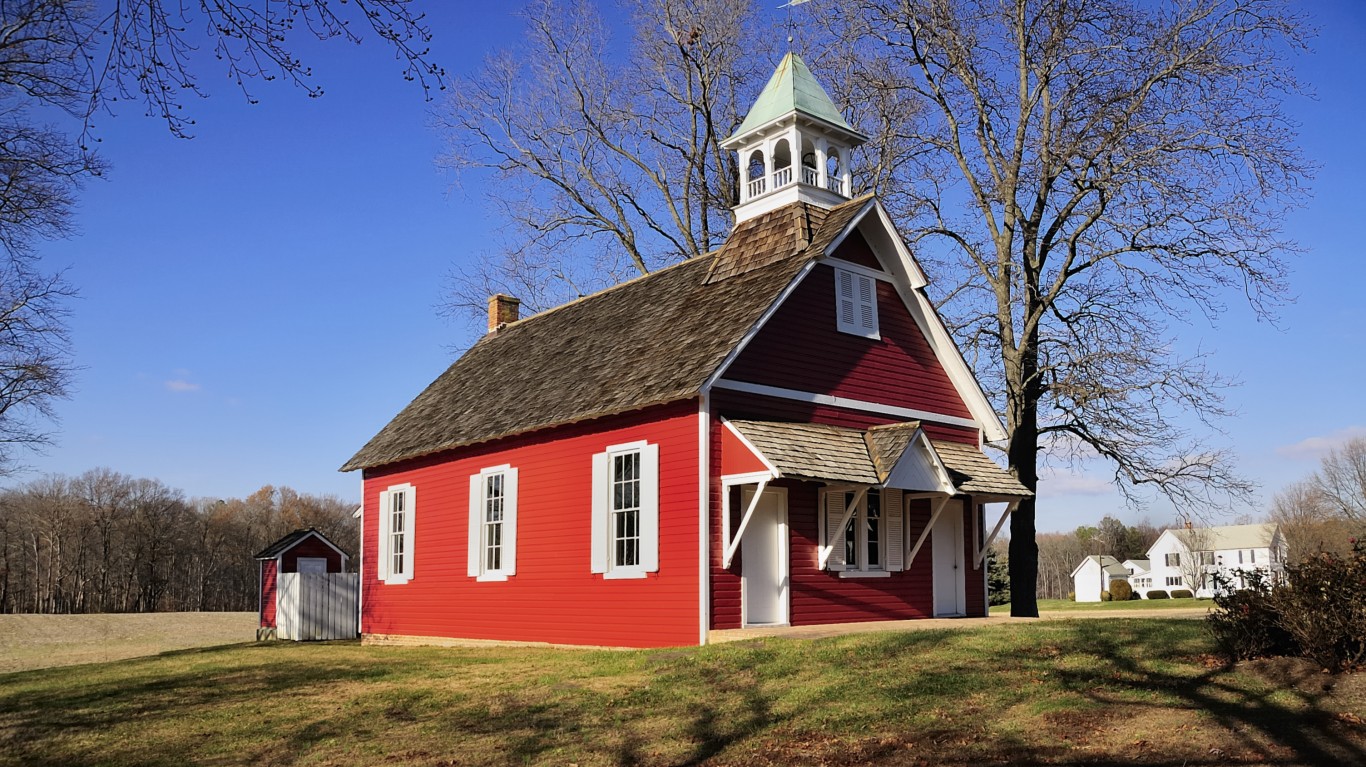
Maryland: Talbot County
> 65+ population: 29.1% (state: 15.4%)
> Life expectancy: 79.3 years (state: 78.6 years)
> Pop. w/ access to physical activity locations: 71.6% (state: 92.1%)
> Primary care physicians: 103.7 per 100,000 (state: 86.7 per 100,000)
> County seat: Easton
Source: DenisTangneyJr / iStock via Getty Images
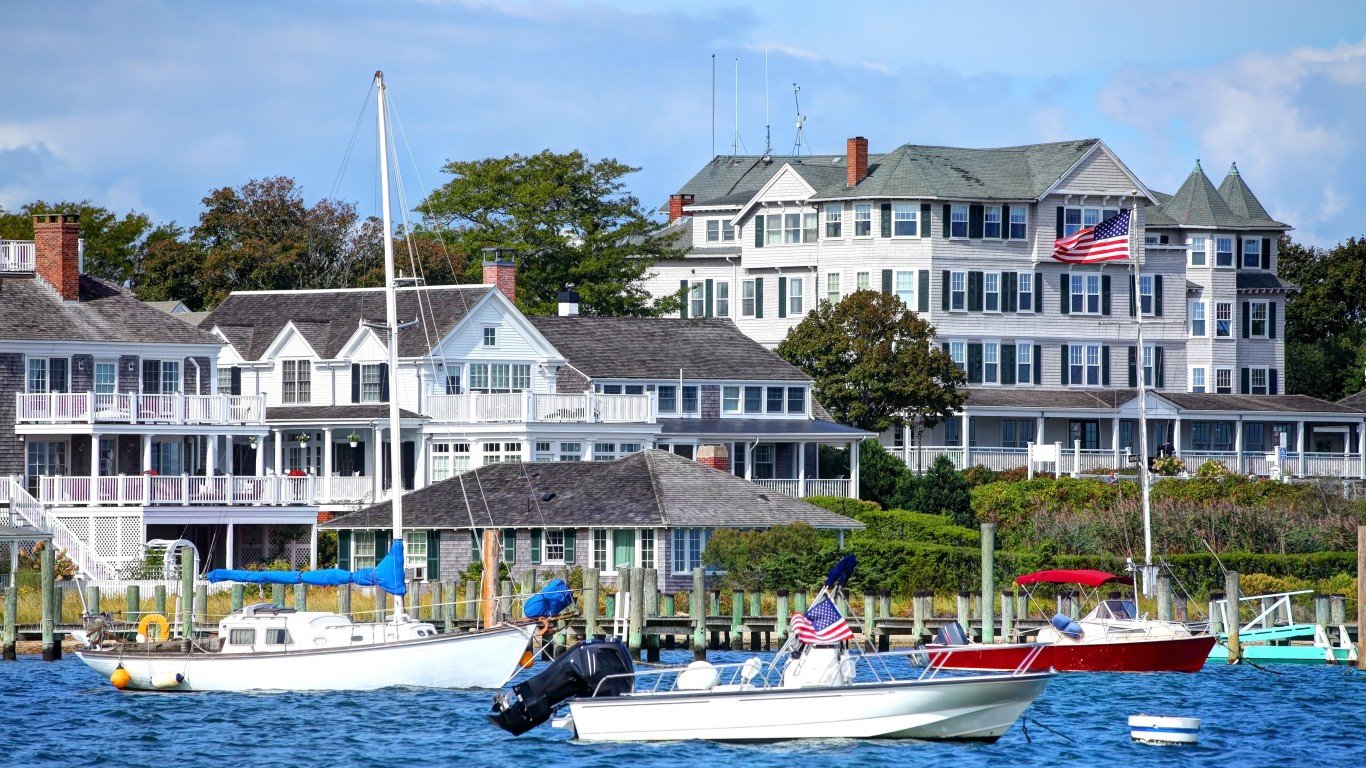
Massachusetts: Dukes County
> 65+ population: 24.0% (state: 16.5%)
> Life expectancy: 81.3 years (state: 80.2 years)
> Pop. w/ access to physical activity locations: 96.7% (state: 94.7%)
> Primary care physicians: 66.4 per 100,000 (state: 102.2 per 100,000)
> County seat: Edgartown
[in-text-ad]
Source: Roberto Galan / iStock Editorial via Getty Images
Michigan: Emmet County
> 65+ population: 22.5% (state: 17.2%)
> Life expectancy: 79.3 years (state: 77.5 years)
> Pop. w/ access to physical activity locations: 82.4% (state: 85.2%)
> Primary care physicians: 119.8 per 100,000 (state: 80.3 per 100,000)
> County seat: Petoskey

Minnesota: Cook County
> 65+ population: 28.5% (state: 15.9%)
> Life expectancy: 82.5 years (state: 80.4 years)
> Pop. w/ access to physical activity locations: 83.8% (state: 86.0%)
> Primary care physicians: 142.4 per 100,000 (state: 89.3 per 100,000)
> County seat: Grand Marais
Source: BOB WESTON / iStock via Getty Images
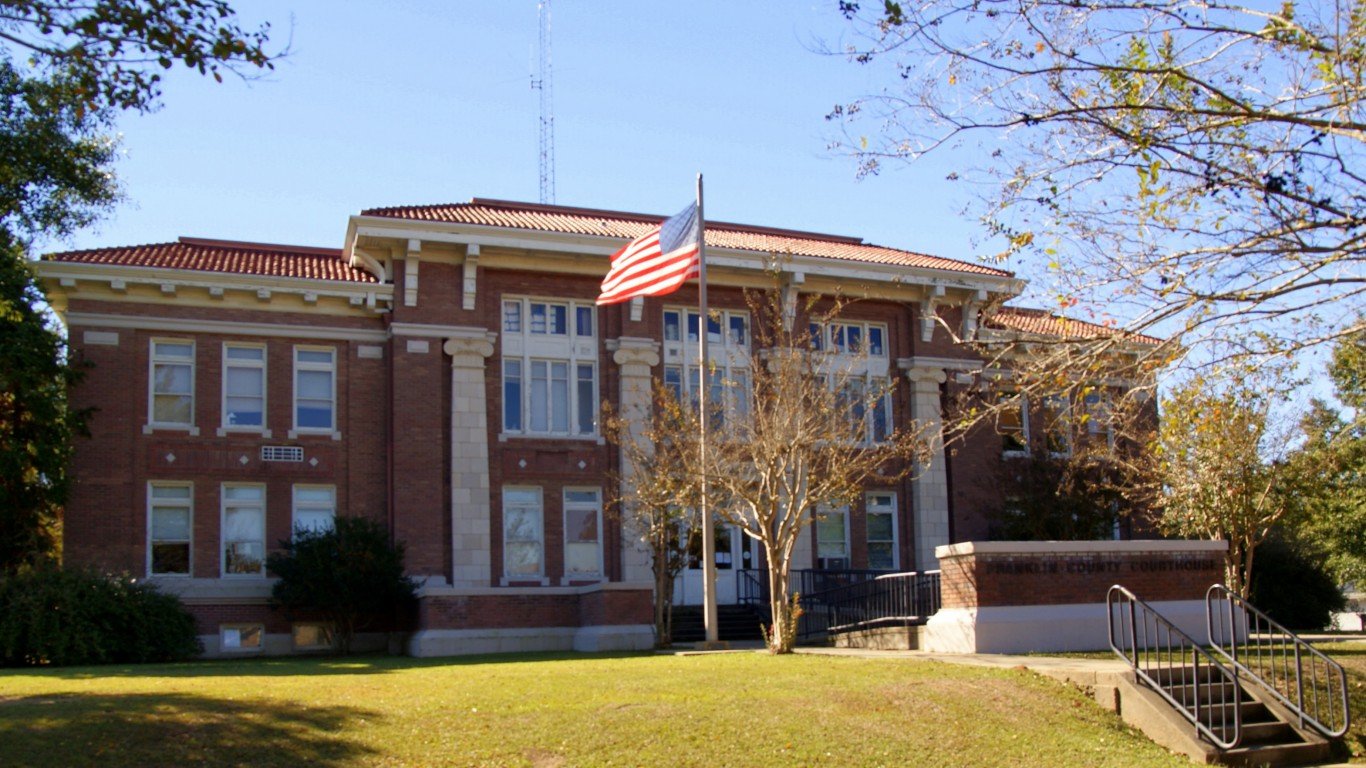
Mississippi: Franklin County
> 65+ population: 20.1% (state: 15.9%)
> Life expectancy: 74.4 years (state: 73.9 years)
> Pop. w/ access to physical activity locations: 70.1% (state: 57.5%)
> Primary care physicians: 26.1 per 100,000 (state: 54.1 per 100,000)
> County seat: Meadville
[in-text-ad-2]

Source: Art Wager / E+ via Getty Images
Missouri: St. Louis County
> 65+ population: 18.0% (state: 16.8%)
> Life expectancy: 77.2 years (state: 76.6 years)
> Pop. w/ access to physical activity locations: 95.4% (state: 75.8%)
> Primary care physicians: 126.5 per 100,000 (state: 70.8 per 100,000)
> County seat: Clayton

Montana: Park County
> 65+ population: 23.0% (state: 18.8%)
> Life expectancy: 79.9 years (state: 78.4 years)
> Pop. w/ access to physical activity locations: 75.4% (state: 72.8%)
> Primary care physicians: 114.5 per 100,000 (state: 80.9 per 100,000)
> County seat: Livingston
[in-text-ad]
Source: BOB WESTON / iStock via Getty Images
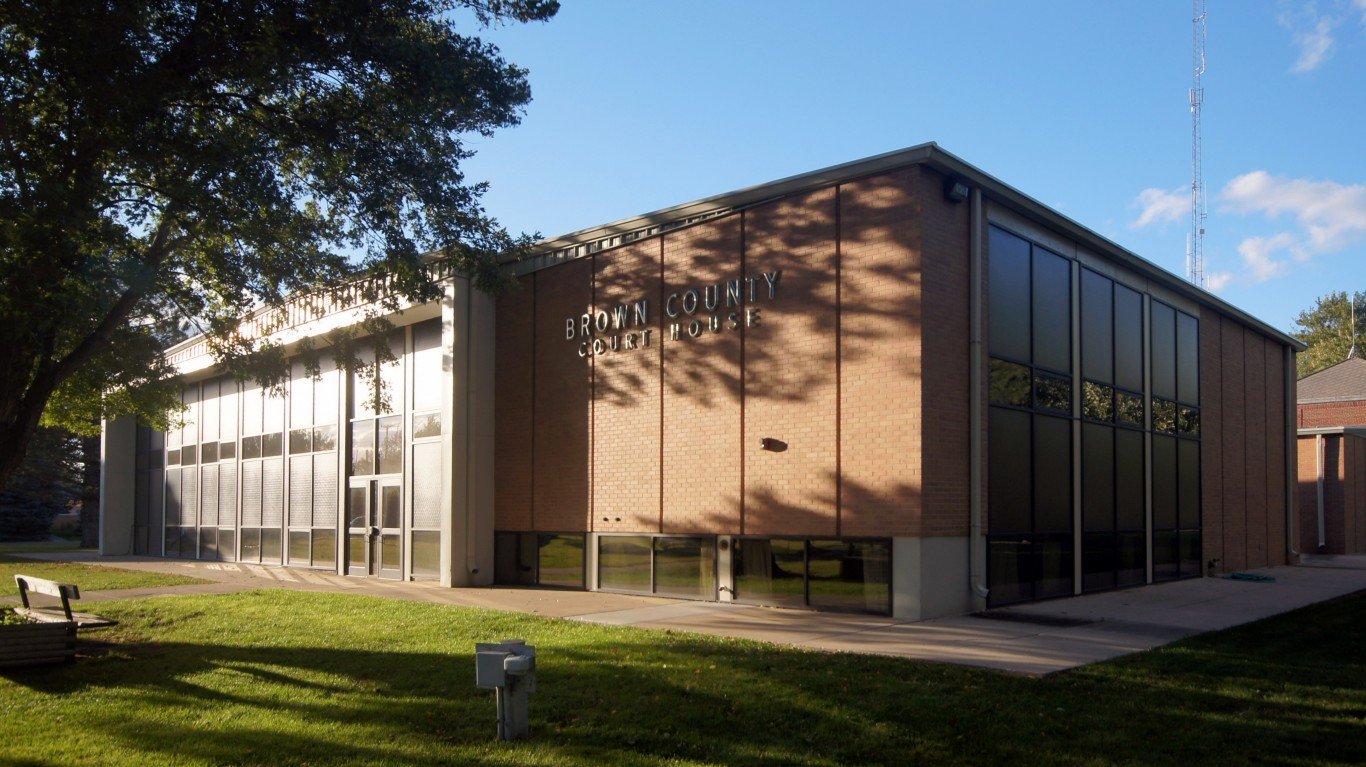
Nebraska: Brown County
> 65+ population: 28.1% (state: 15.7%)
> Life expectancy: 79.1 years (state: 79.0 years)
> Pop. w/ access to physical activity locations: 79.6% (state: 83.1%)
> Primary care physicians: 103.2 per 100,000 (state: 75.8 per 100,000)
> County seat: Ainsworth

Source: johnrandallalves / iStock via Getty Images
Nevada: Douglas County
> 65+ population: 29.0% (state: 15.8%)
> Life expectancy: 81.1 years (state: 78.1 years)
> Pop. w/ access to physical activity locations: 80.9% (state: 91.5%)
> Primary care physicians: 52.1 per 100,000 (state: 58.8 per 100,000)
> County seat: Minden
Source: DenisTangneyJr / iStock via Getty Images
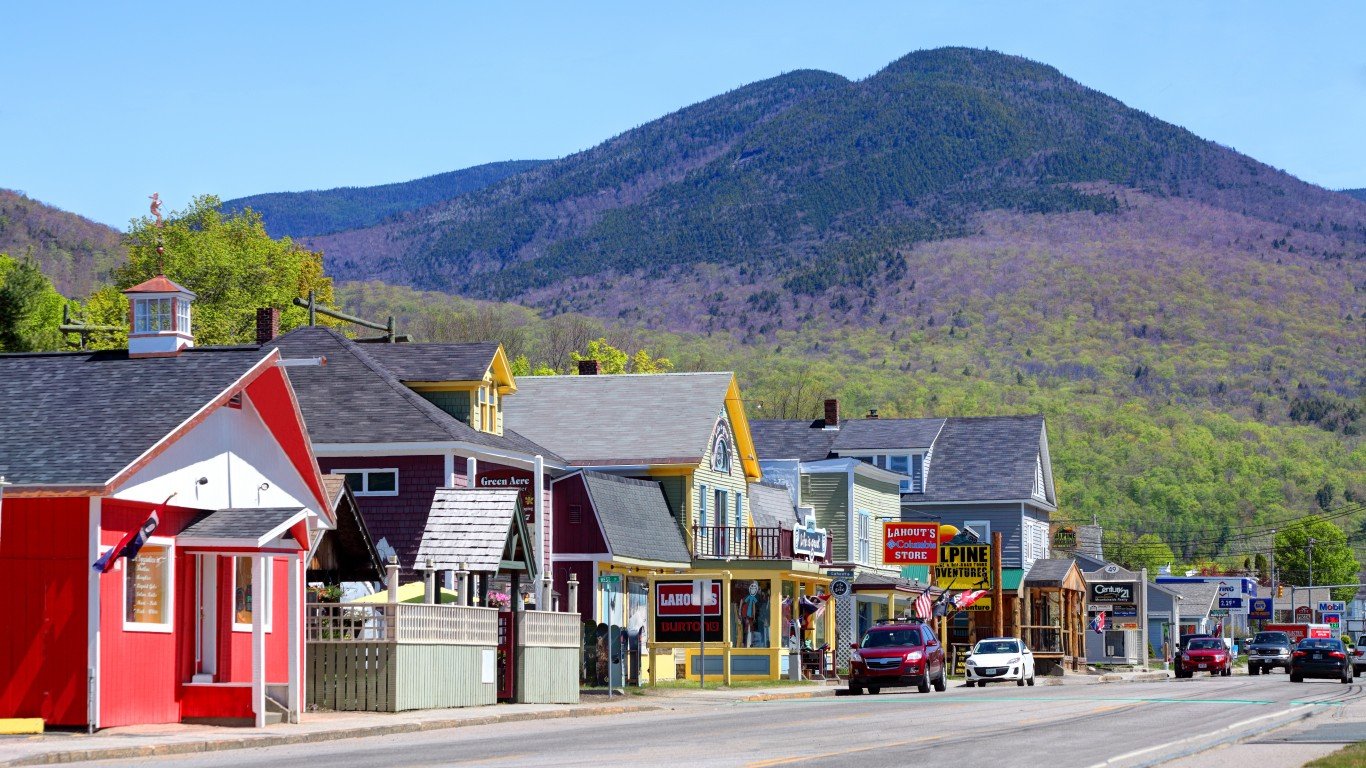
New Hampshire: Grafton County
> 65+ population: 20.8% (state: 18.2%)
> Life expectancy: 80.7 years (state: 79.6 years)
> Pop. w/ access to physical activity locations: 84.9% (state: 84.2%)
> Primary care physicians: 187.6 per 100,000 (state: 88.0 per 100,000)
> County seat: North Haverhill
[in-text-ad-2]

Source: DenisTangneyJr / iStock via Getty Images
New Jersey: Morris County
> 65+ population: 17.0% (state: 16.2%)
> Life expectancy: 81.8 years (state: 79.5 years)
> Pop. w/ access to physical activity locations: 98.5% (state: 96.1%)
> Primary care physicians: 97.1 per 100,000 (state: 81.2 per 100,000)
> County seat: Morristown
Source: benedek / iStock via Getty Images
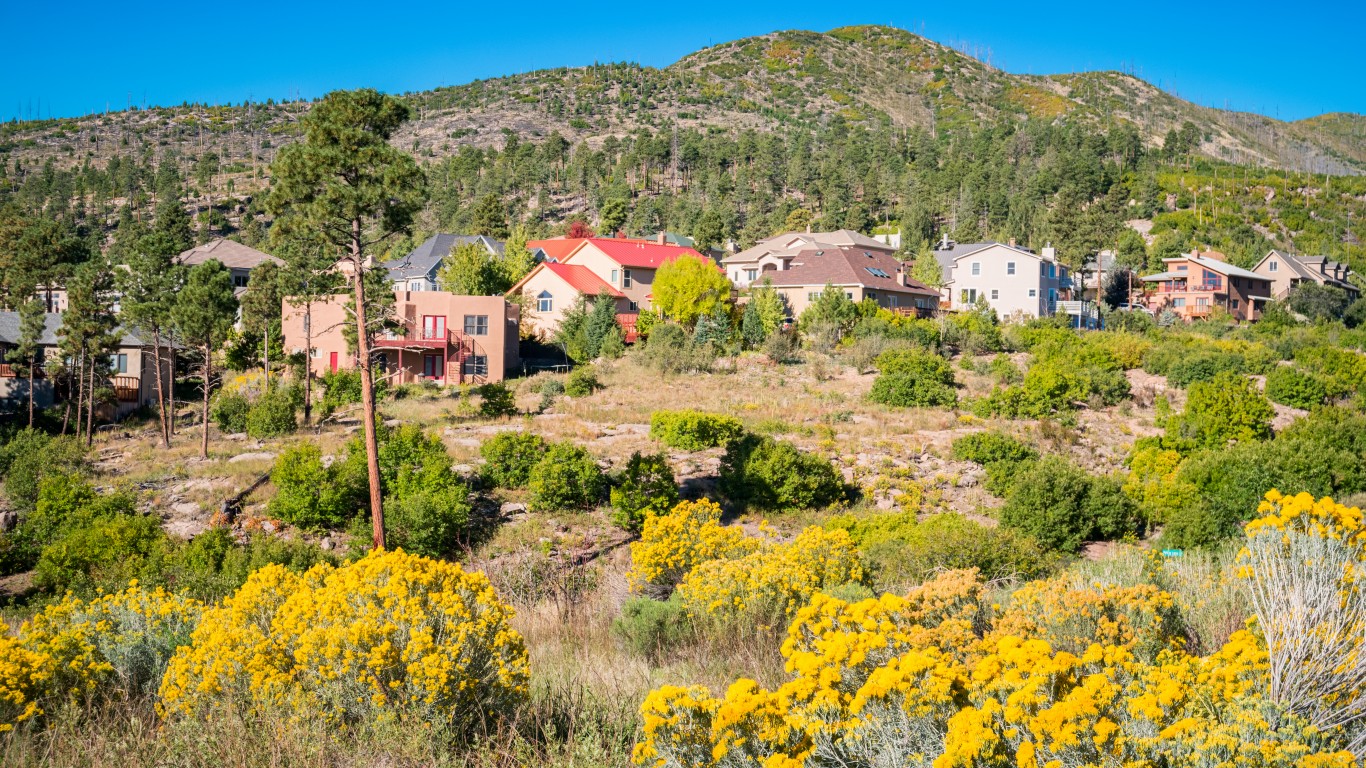
New Mexico: Los Alamos County
> 65+ population: 17.4% (state: 17.5%)
> Life expectancy: 83.9 years (state: 76.9 years)
> Pop. w/ access to physical activity locations: 99.3% (state: 74.3%)
> Primary care physicians: 150.0 per 100,000 (state: 74.9 per 100,000)
> County seat: Los Alamos
[in-text-ad]

Source: gregobagel / iStock via Getty Images
New York: New York County
> 65+ population: 16.8% (state: 16.6%)
> Life expectancy: 83.7 years (state: 80.3 years)
> Pop. w/ access to physical activity locations: 100.0% (state: 93.2%)
> Primary care physicians: 142.2 per 100,000 (state: 83.1 per 100,000)
> County seat: Manhattan
Source: Public Domain / Wikimedia Commons
North Carolina: Transylvania County
> 65+ population: 30.1% (state: 16.3%)
> Life expectancy: 81.0 years (state: 77.7 years)
> Pop. w/ access to physical activity locations: 85.0% (state: 74.5%)
> Primary care physicians: 72.4 per 100,000 (state: 71.1 per 100,000)
> County seat: Brevard
Source: Public Domain / Wikimedia Commons
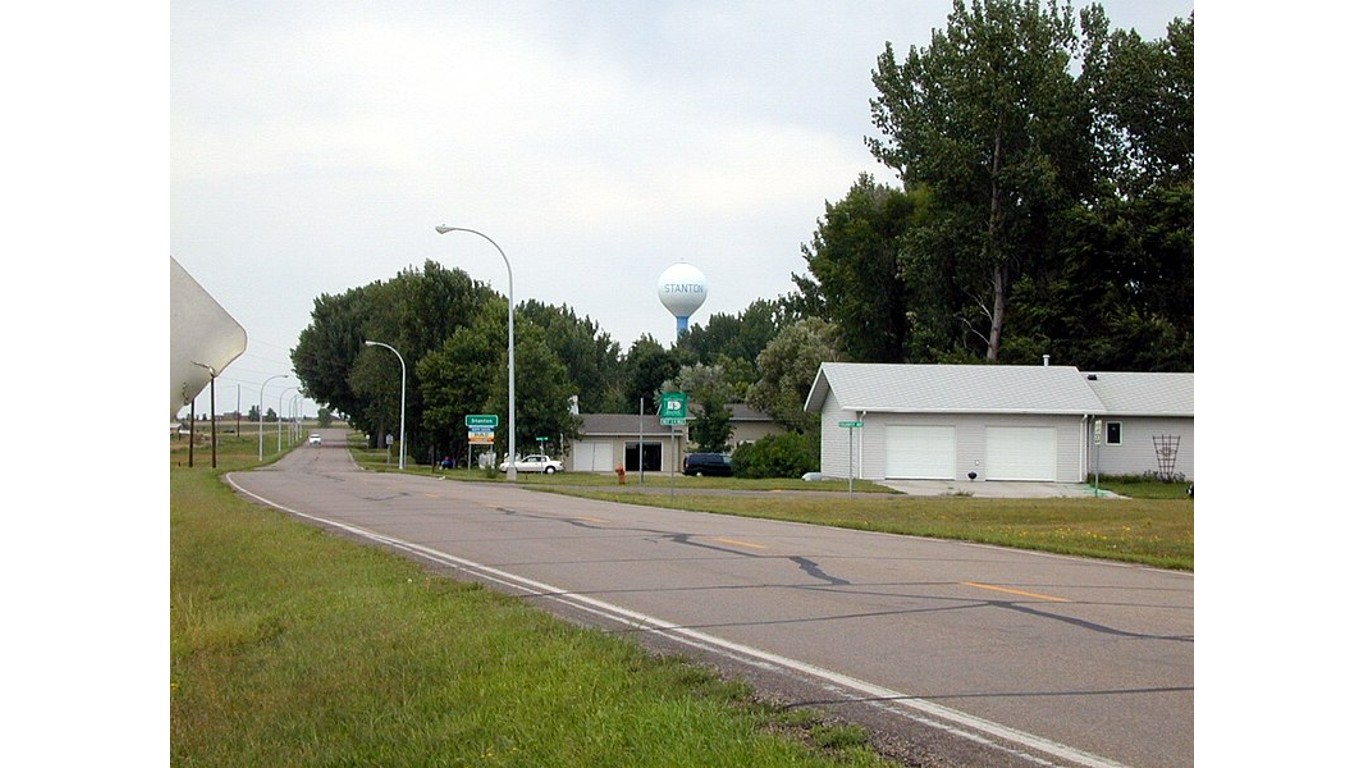
North Dakota: Mercer County
> 65+ population: 20.0% (state: 15.3%)
> Life expectancy: 81.9 years (state: 78.8 years)
> Pop. w/ access to physical activity locations: 79.1% (state: 72.5%)
> Primary care physicians: 84.1 per 100,000 (state: 76.8 per 100,000)
> County seat: Stanton
[in-text-ad-2]

Ohio: Medina County
> 65+ population: 18.0% (state: 17.0%)
> Life expectancy: 79.9 years (state: 76.5 years)
> Pop. w/ access to physical activity locations: 92.7% (state: 83.8%)
> Primary care physicians: 62.8 per 100,000 (state: 76.8 per 100,000)
> County seat: Medina
Source: RoseMaryBush / iStock via Getty Images
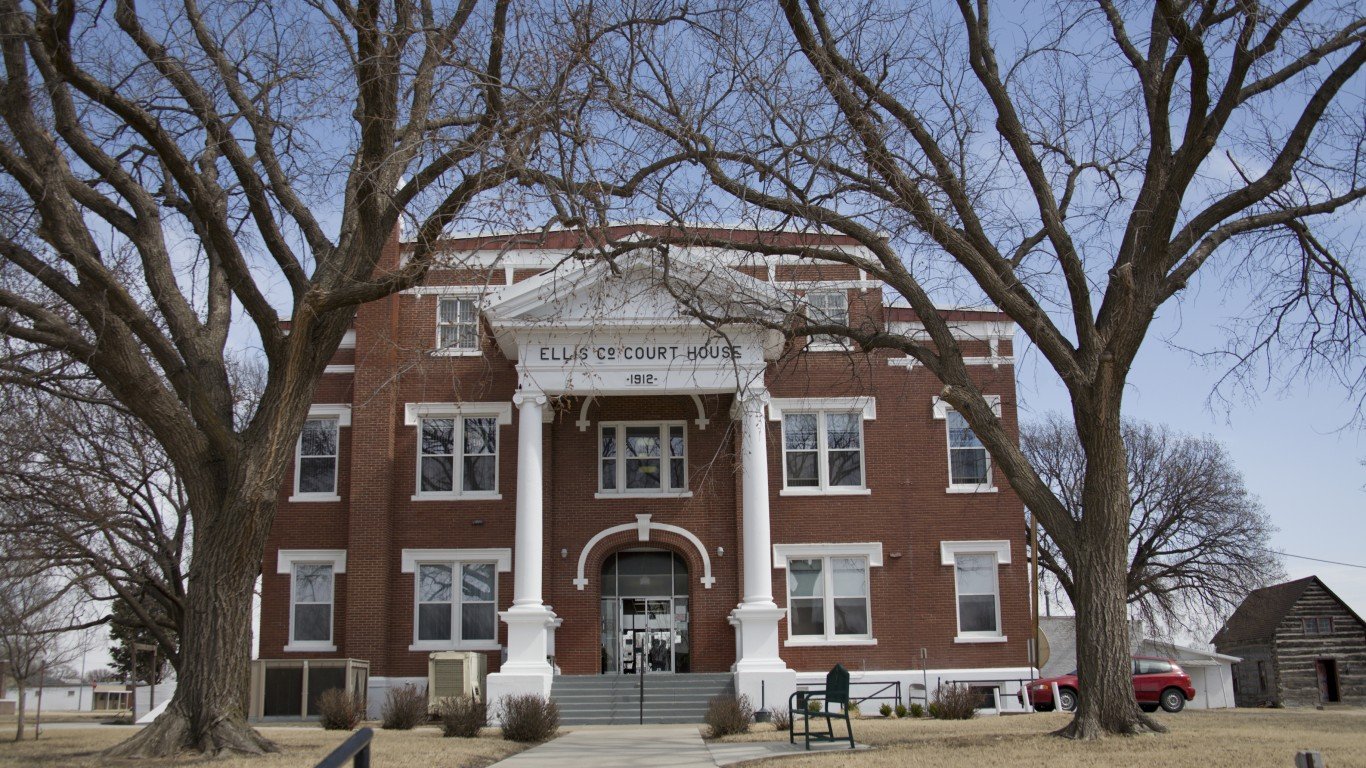
Oklahoma: Ellis County
> 65+ population: 23.2% (state: 15.6%)
> Life expectancy: 76.2 years (state: 75.5 years)
> Pop. w/ access to physical activity locations: 37.1% (state: 71.3%)
> Primary care physicians: 53.2 per 100,000 (state: 60.4 per 100,000)
> County seat: Arnett
[in-text-ad]

Oregon: Wallowa County
> 65+ population: 29.3% (state: 17.7%)
> Life expectancy: 82.0 years (state: 79.7 years)
> Pop. w/ access to physical activity locations: 58.5% (state: 87.9%)
> Primary care physicians: 145.8 per 100,000 (state: 94.1 per 100,000)
> County seat: Enterprise

Source: aimintang / iStock Unreleased via Getty Images
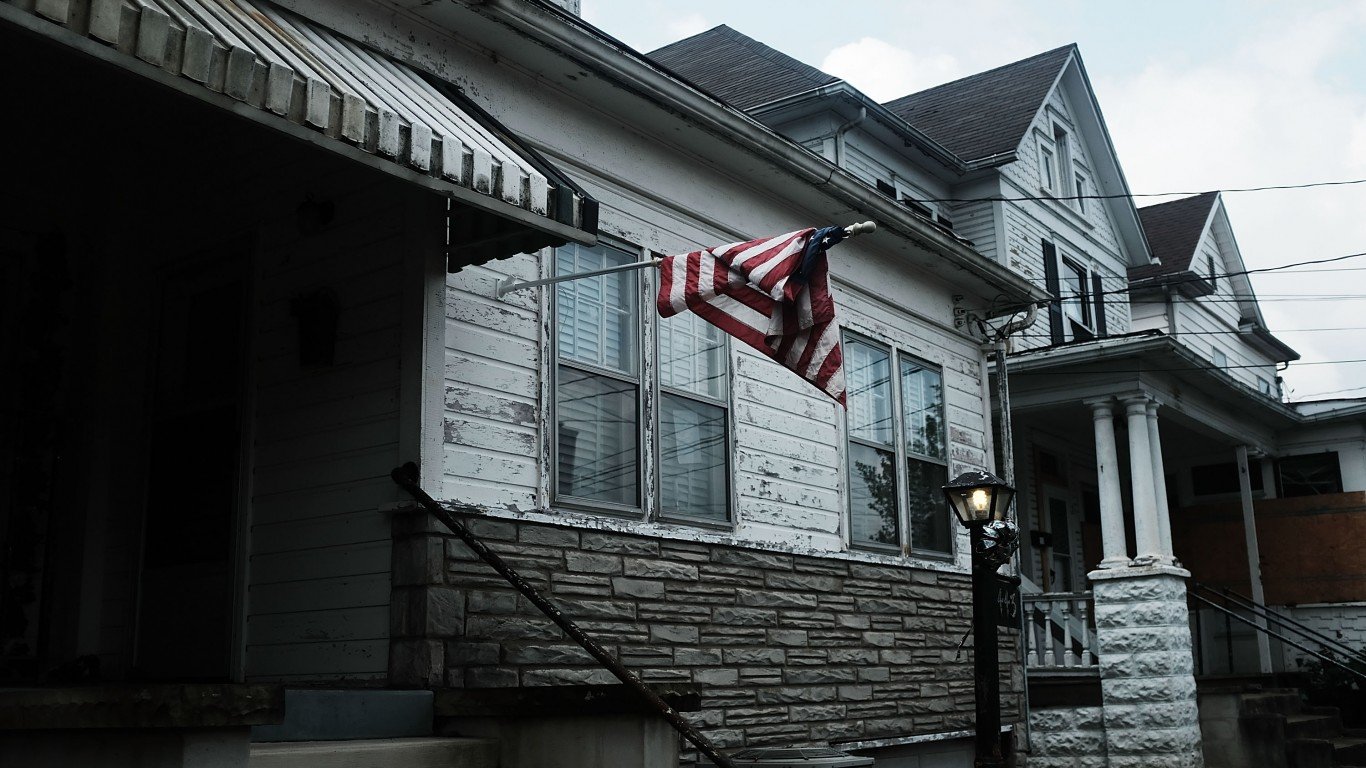
Pennsylvania: Montgomery County
> 65+ population: 17.7% (state: 18.2%)
> Life expectancy: 80.5 years (state: 78.0 years)
> Pop. w/ access to physical activity locations: 96.4% (state: 85.8%)
> Primary care physicians: 132.8 per 100,000 (state: 81.1 per 100,000)
> County seat: Norristown

Source: DenisTangneyJr / iStock via Getty Images
Rhode Island: Bristol County
> 65+ population: 19.7% (state: 17.3%)
> Life expectancy: 81.2 years (state: 79.4 years)
> Pop. w/ access to physical activity locations: 99.5% (state: 95.5%)
> Primary care physicians: 192.8 per 100,000 (state: 97.2 per 100,000)
> County seat: Bristol
[in-text-ad-2]
Source: VisionsbyAtlee / iStock via Getty Images
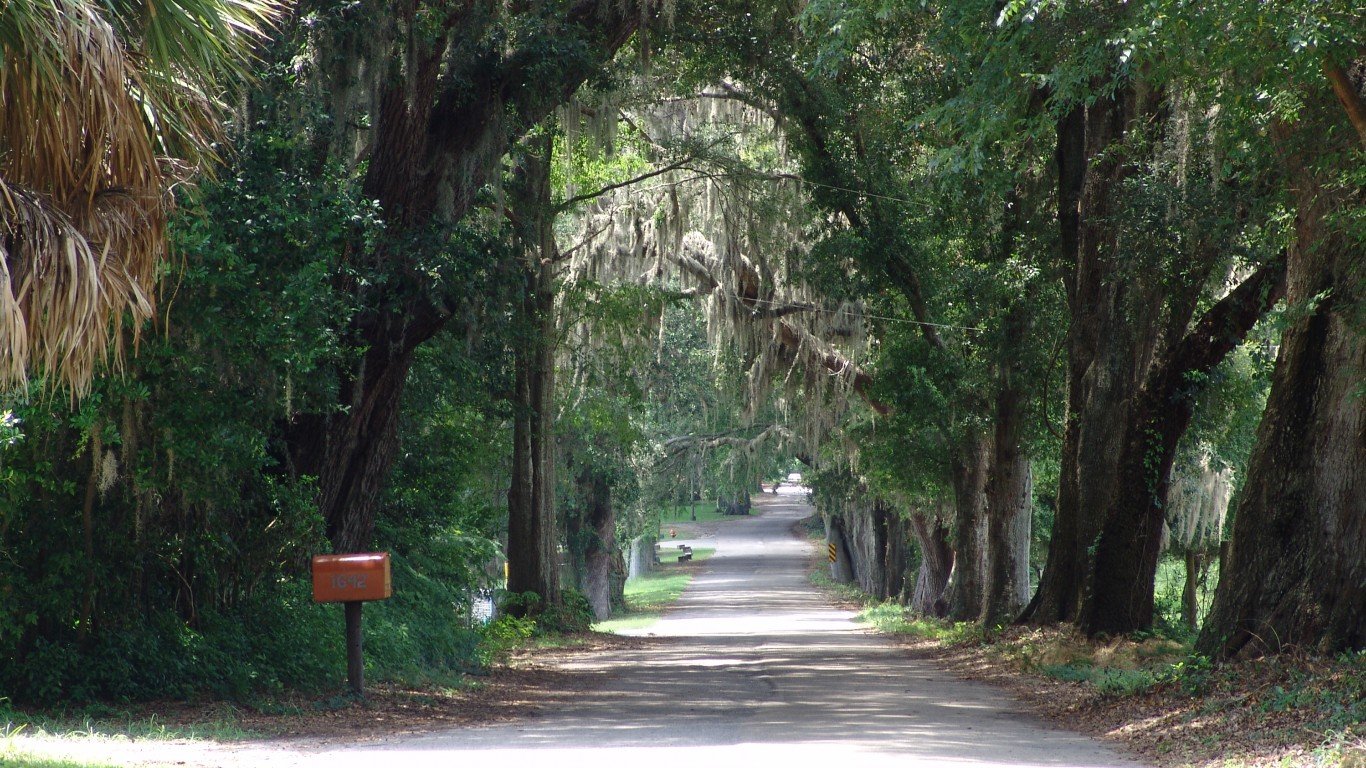
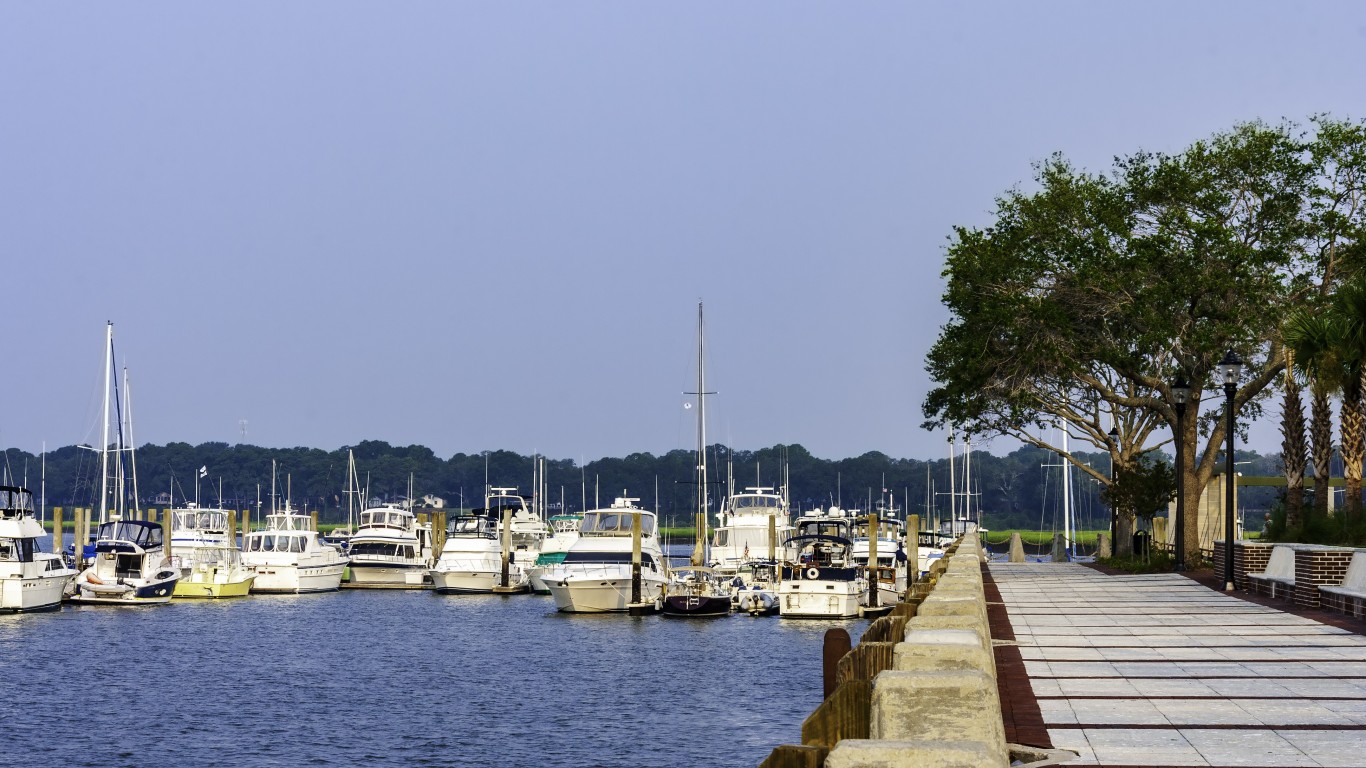
South Carolina: Beaufort County
> 65+ population: 27.4% (state: 17.7%)
> Life expectancy: 82.6 years (state: 76.4 years)
> Pop. w/ access to physical activity locations: 86.0% (state: 70.3%)
> Primary care physicians: 71.4 per 100,000 (state: 67.9 per 100,000)
> County seat: Beaufort

South Dakota: Fall River County
> 65+ population: 29.9% (state: 16.6%)
> Life expectancy: 74.7 years (state: 78.2 years)
> Pop. w/ access to physical activity locations: 86.4% (state: 70.6%)
> Primary care physicians: 69.4 per 100,000 (state: 80.2 per 100,000)
> County seat: Hot Springs
[in-text-ad]

Tennessee: Johnson County
> 65+ population: 22.8% (state: 16.3%)
> Life expectancy: 74.0 years (state: 75.3 years)
> Pop. w/ access to physical activity locations: 100.0% (state: 67.6%)
> Primary care physicians: 33.0 per 100,000 (state: 70.4 per 100,000)
> County seat: Mountain City

Texas: Jeff Davis County
> 65+ population: 36.9% (state: 12.5%)
> Life expectancy: 84.4 years (state: 78.4 years)
> Pop. w/ access to physical activity locations: 44.3% (state: 81.7%)
> Primary care physicians: 51.3 per 100,000 (state: 60.6 per 100,000)
> County seat: Fort Davis

Utah: Grand County
> 65+ population: 20.4% (state: 11.1%)
> Life expectancy: 79.4 years (state: 79.7 years)
> Pop. w/ access to physical activity locations: 94.5% (state: 84.2%)
> Primary care physicians: 134.5 per 100,000 (state: 55.9 per 100,000)
> County seat: Moab
[in-text-ad-2]
Source: DenisTangneyJr / iStock via Getty Images
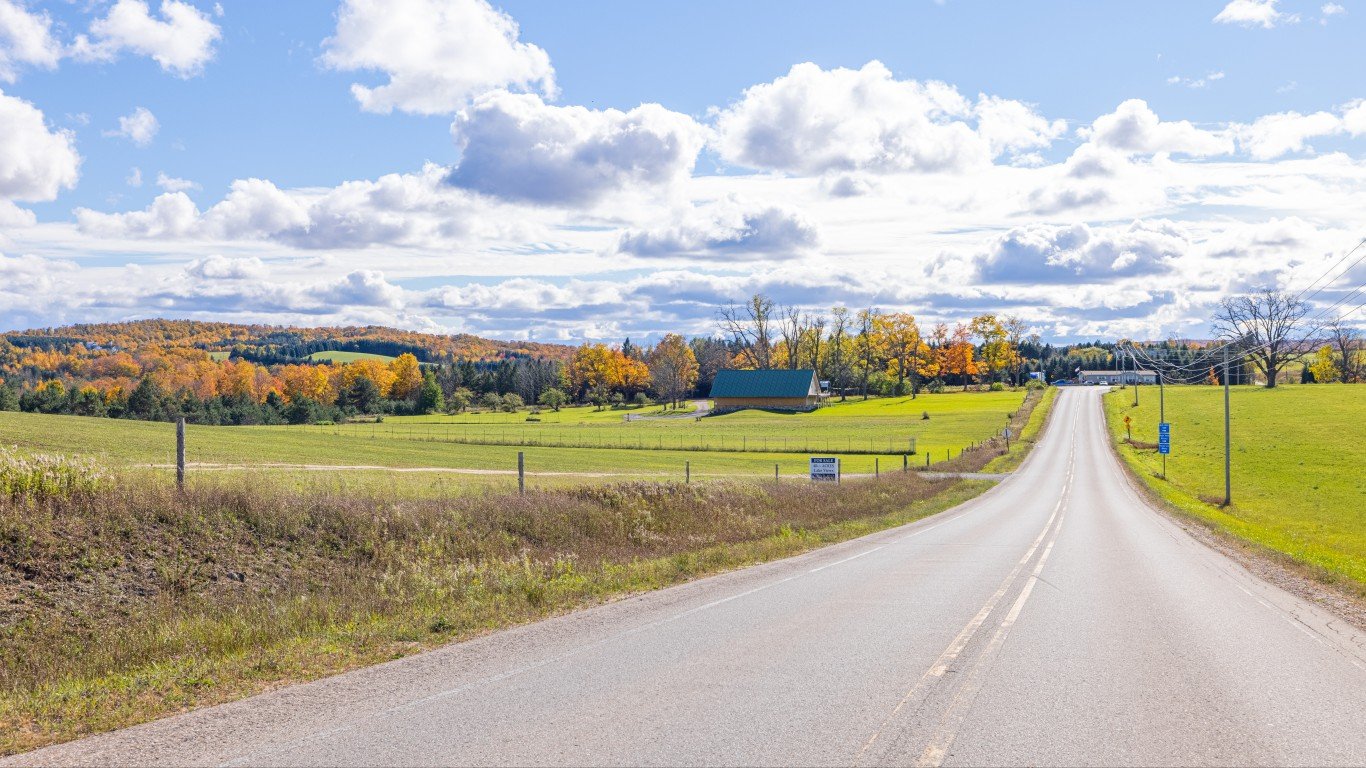
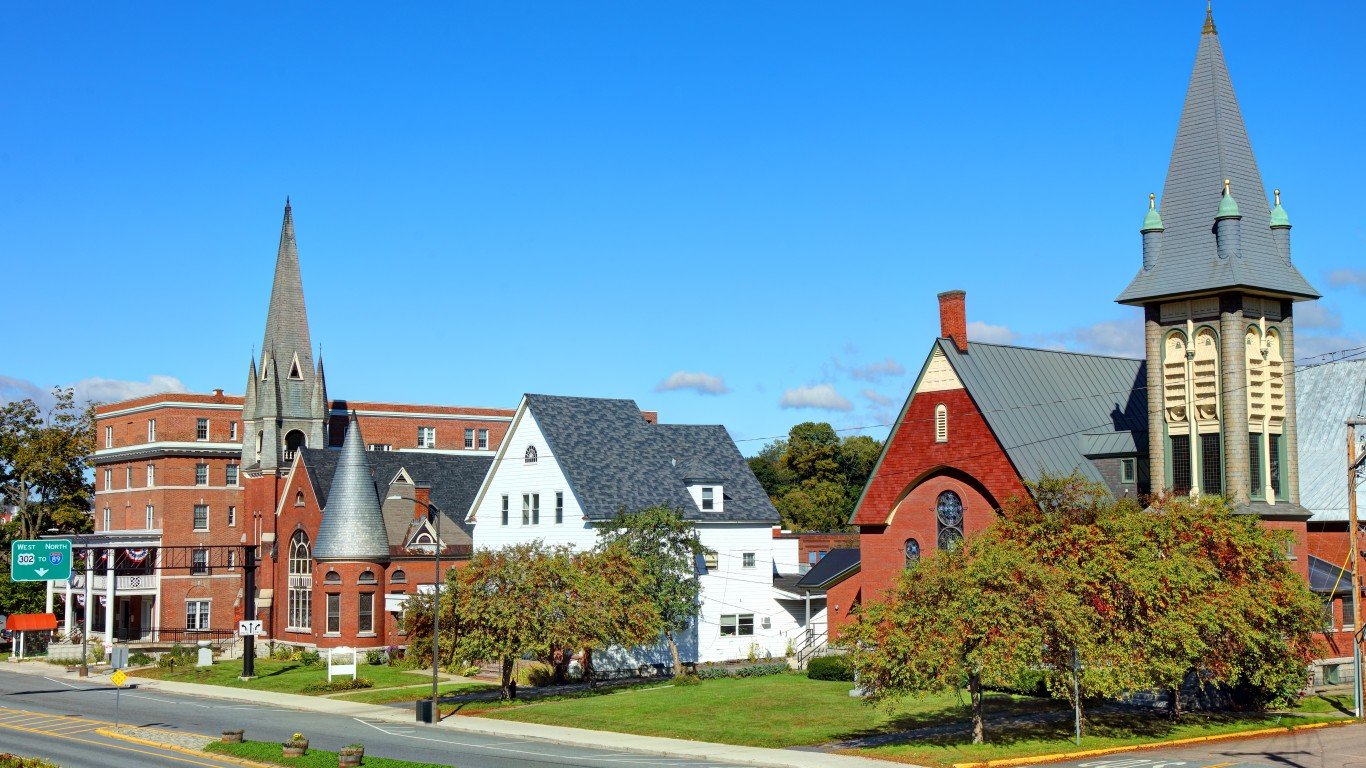
Vermont: Washington County
> 65+ population: 19.7% (state: 19.5%)
> Life expectancy: 79.8 years (state: 79.7 years)
> Pop. w/ access to physical activity locations: 73.4% (state: 70.6%)
> Primary care physicians: 100.1 per 100,000 (state: 112.9 per 100,000)
> County seat: Montpelier

Virginia: James City County
> 65+ population: 25.2% (state: 15.5%)
> Life expectancy: 81.6 years (state: 79.1 years)
> Pop. w/ access to physical activity locations: 97.5% (state: 83.4%)
> Primary care physicians: 111.4 per 100,000 (state: 75.0 per 100,000)
> County seat: Williamsburg
[in-text-ad]

Source: Colleen Michaels / iStock via Getty Images
Washington: San Juan County
> 65+ population: 33.7% (state: 15.5%)
> Life expectancy: 86.3 years (state: 80.2 years)
> Pop. w/ access to physical activity locations: 86.2% (state: 86.0%)
> Primary care physicians: 70.1 per 100,000 (state: 83.9 per 100,000)
> County seat: Friday Harbor
 24/7 Wall St.
Source: tristanbnz / iStock via Getty Images
West Virginia: Tucker County
> 65+ population: 26.3% (state: 19.9%)
> Life expectancy: 75.5 years (state: 74.3 years)
> Pop. w/ access to physical activity locations: 98.7% (state: 57.8%)
> Primary care physicians: 60.0 per 100,000 (state: 78.6 per 100,000)
> County seat: Parsons

Wisconsin: Ozaukee County
> 65+ population: 19.8% (state: 17.0%)
> Life expectancy: 81.9 years (state: 78.9 years)
> Pop. w/ access to physical activity locations: 97.3% (state: 83.5%)
> Primary care physicians: 141.6 per 100,000 (state: 79.7 per 100,000)
> County seat: Port Washington
[in-text-ad-2]

Wyoming: Park County
> 65+ population: 23.3% (state: 16.7%)
> Life expectancy: 80.5 years (state: 78.1 years)
> Pop. w/ access to physical activity locations: 72.5% (state: 77.5%)
> Primary care physicians: 122.9 per 100,000 (state: 70.1 per 100,000)
> County seat: Cody
Methodology
To determine the best places to retire in every state, 24/7 Wall St. developed an index of 11 different measures related to the health and well-being of the population 65 years and over in all 3,143 U.S. county and county equivalents. However, only counties in which the share of the 65+ population is greater than the 16.0% national figure were included. These counties were ranked based on the index, and the best in each state are listed here.
Data on the percentage of the population with adequate access to locations for physical activity, the number of primary care physicians per 100,000 residents, the number of preventable hospital admissions for ambulatory-care sensitive conditions per 100,000 Medicare enrollees, the number of social membership associations per 10,000 residents, the average daily density of fine particulate matter (PM2.5) per cubic meter of air, average life expectancy at birth, and the percentage of the citizen population 18 and older who voted in the 2020 U.S. presidential election all came from the 2023 edition of County Health Rankings and Roadmaps, a program of the University of Wisconsin Population Health Institute, and were included in the index at full weight.
Five-year data on the percentage of residents 65 years and older out of the total population, the percentage-point change in the 65+ population as a share of the total population from 2017 to 2021, and median home value came from the U.S. Census Bureau’s 2021 American Community Survey and were included in the index at full weight.
Data on the number of golf courses and country clubs per 10,000 square miles were calculated using establishment counts from the U.S. Census Bureau’s 2021 County Business Patterns program and were included in the index at full weight.
Sponsored: Want to Retire Early? Start Here
Want retirement to come a few years earlier than you’d planned? Orare you ready to retire now, but want an extra set of eyes on your finances?
Now you can speak with up to 3 financial experts in your area for FREE. By simply clicking here you can begin to match with financial professionals who can help you build your plan to retire early. And the best part? The first conversation with them is free.
Click here to match with up to 3 financial pros who would be excited to help you make financial decisions.
Thank you for reading! Have some feedback for us?
Contact the 24/7 Wall St. editorial team.
Editors' Picks