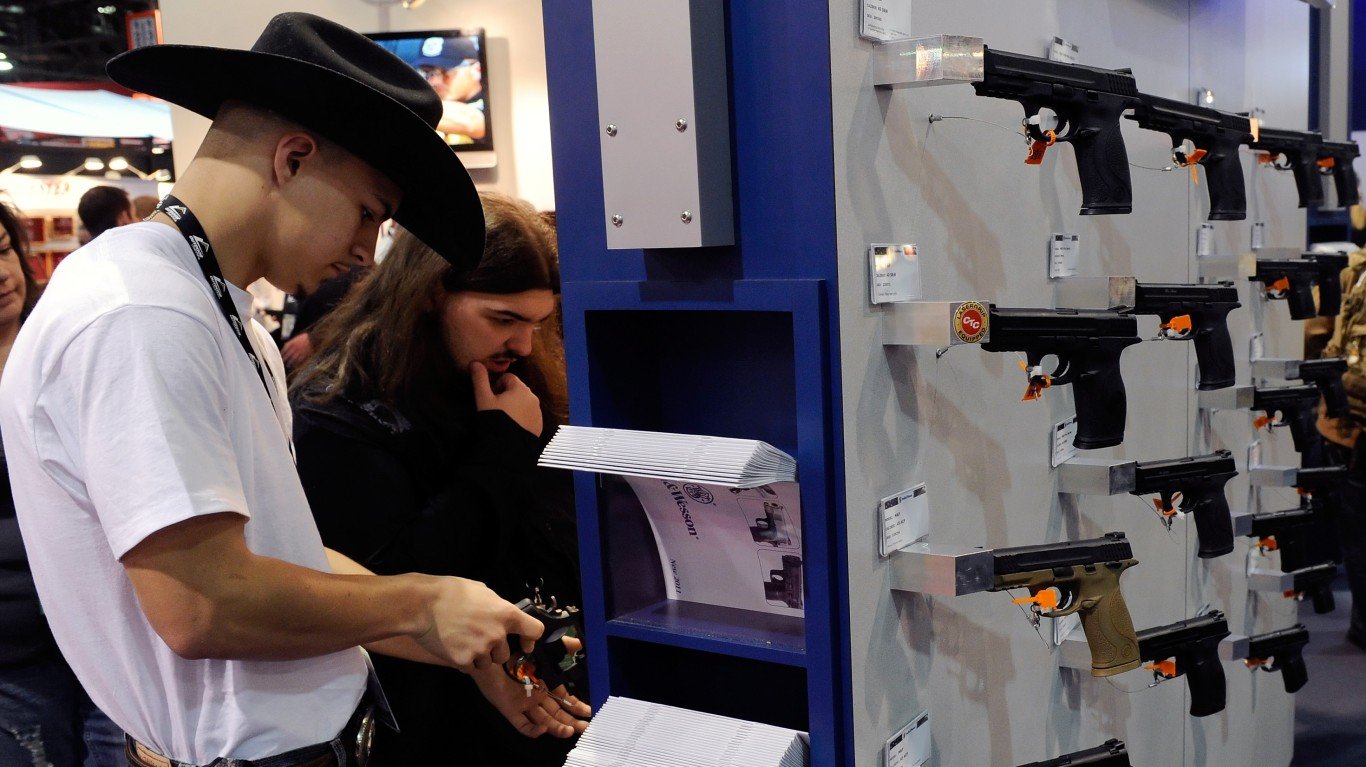
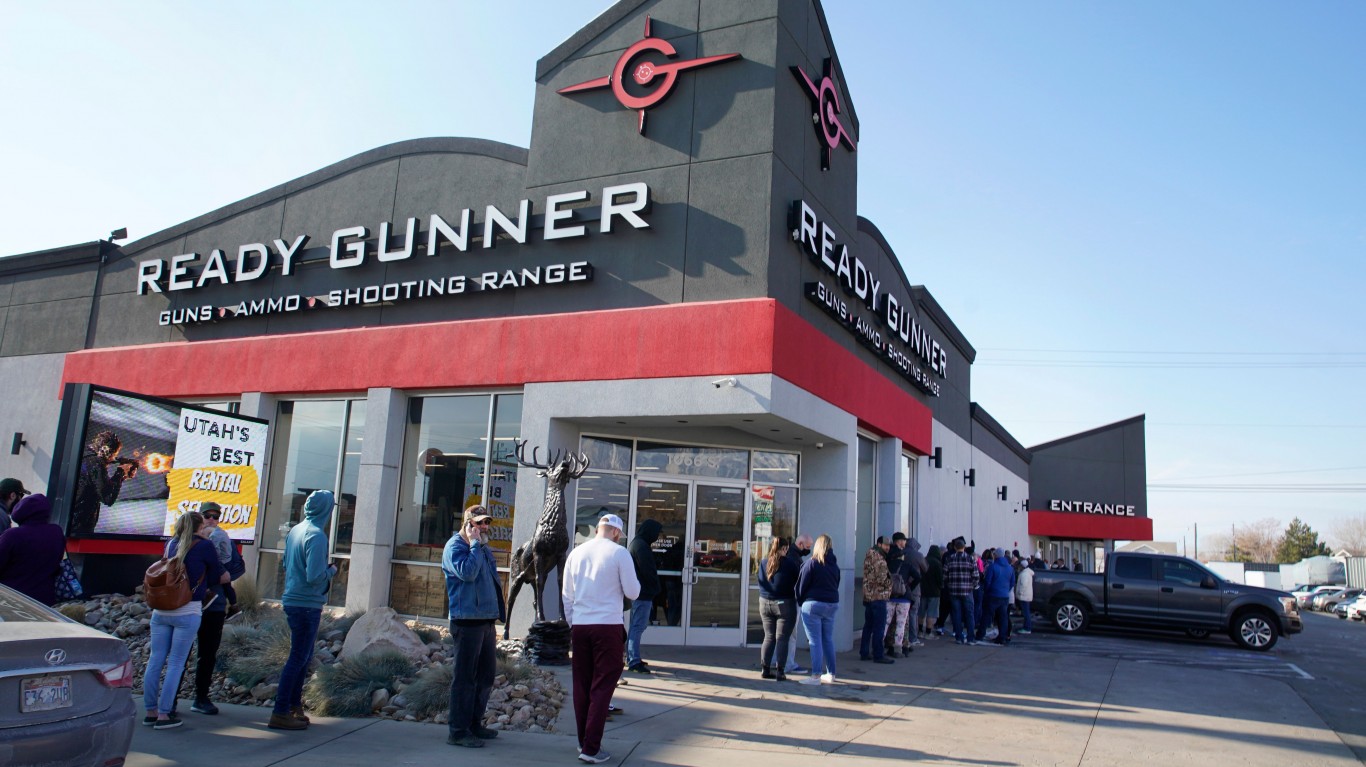
Somewhat bucking the national trend of cooling gun sales following record highs during the pandemic, Smith & Wesson reported a 16.4% increase in sales in the first six months of its fiscal year ending in Oct. 31 compared to the same period a year ago. Sturm, Ruger & Company, however, reported a 7.5% decline in the first nine months of the year ending in Sept. 30. Looking at firearm background checks, one can get an idea where firearm sales are highest. (These are the most popular 50 guns ever.)
FBI firearm background checks are a proxy of gun sales. To reach a more accurate approximation of gun sales, 24/7 Wall St. adjusts the FBI figures by excluding checks for such categories as pawn shop transactions, returns, rentals, and rechecks. Still, because every state has different laws in terms of when background checks are required and different accounting practices, background checks remain a rough approximation of gun sales.
To identify the states where the most people bought guns last month, 24/7 Wall St. used data from the FBI’s National Instant Criminal Background Check System. States were ranked based on the number of adjusted background checks per 1,000 people in November 2023.
That month, the FBI conducted 1,801,563 adjusted firearm background checks nationwide, or 5.4 checks per 1,000 people. By state, per capita checks ranged from 1.6 checks per 1,000 residents to 11.6 per 1,000.
Among the 15 states with the highest background checks per capita in November 2023 — where the FBI conducted over 8 firearm background checks per 1,000 residents — gun laws are among the most lax. With the exception of Wisconsin, which scored a D+ for its gun laws, all the other states received an F grade in the Gifford Law Center’s most recent Annual Gun Law Scorecard. (Here is every state’s grade on gun laws.)
While these states have high firearm background checks per capita, total background checks are not necessarily high as they include some of the least populous states, including North and South Dakota, Alaska, Montana, and Wyoming.
Here are the states where the most people bought guns last month.
50. New Jersey
- Firearm background checks per capita, Nov. 2023: 1.6 per 1,000 residents
- Total firearm background checks, Nov. 2023: 15,060 (15th lowest)
- Firearm background checks per capita, Nov. 2022: 1.4 per 1,000 (2nd lowest)
- Total firearm background checks, Nov. 2022: 13,316 (14th lowest)
- Population: 9,261,699 (11th highest)
49. Hawaii

- Firearm background checks per capita, Nov. 2023: 1.7 per 1,000 residents
- Total firearm background checks, Nov. 2023: 2,455 (2nd lowest)
- Firearm background checks per capita, Nov. 2022: 1.0 per 1,000 (the lowest)
- Total firearm background checks, Nov. 2022: 1,418 (the lowest)
- Population: 1,440,196 (11th lowest)
48. New York

- Firearm background checks per capita, Nov. 2023: 1.7 per 1,000 residents
- Total firearm background checks, Nov. 2023: 33,595 (21st highest)
- Firearm background checks per capita, Nov. 2022: 1.6 per 1,000 (3rd lowest)
- Total firearm background checks, Nov. 2022: 31,201 (24th highest)
- Population: 19,677,151 (4th highest)
47. Illinois
- Firearm background checks per capita, Nov. 2023: 1.9 per 1,000 residents
- Total firearm background checks, Nov. 2023: 24,055 (24th lowest)
- Firearm background checks per capita, Nov. 2022: 3.3 per 1,000 (7th lowest)
- Total firearm background checks, Nov. 2022: 41,743 (18th highest)
- Population: 12,582,032 (6th highest)
46. Rhode Island

- Firearm background checks per capita, Nov. 2023: 2.2 per 1,000 residents
- Total firearm background checks, Nov. 2023: 2,430 (the lowest)
- Firearm background checks per capita, Nov. 2022: 2.0 per 1,000 (4th lowest)
- Total firearm background checks, Nov. 2022: 2,223 (2nd lowest)
- Population: 1,093,734 (7th lowest)
45. California

- Firearm background checks per capita, Nov. 2023: 3.2 per 1,000 residents
- Total firearm background checks, Nov. 2023: 126,033 (3rd highest)
- Firearm background checks per capita, Nov. 2022: 2.6 per 1,000 (5th lowest)
- Total firearm background checks, Nov. 2022: 102,205 (4th highest)
- Population: 39,029,342 (the highest)
44. Massachusetts

- Firearm background checks per capita, Nov. 2023: 3.4 per 1,000 residents
- Total firearm background checks, Nov. 2023: 23,805 (22nd lowest)
- Firearm background checks per capita, Nov. 2022: 2.9 per 1,000 (6th lowest)
- Total firearm background checks, Nov. 2022: 20,205 (21st lowest)
- Population: 6,981,974 (16th highest)
43. Nebraska
- Firearm background checks per capita, Nov. 2023: 3.8 per 1,000 residents
- Total firearm background checks, Nov. 2023: 7,479 (8th lowest)
- Firearm background checks per capita, Nov. 2022: 3.5 per 1,000 (8th lowest)
- Total firearm background checks, Nov. 2022: 6,962 (7th lowest)
- Population: 1,967,923 (14th lowest)
42. Nevada
- Firearm background checks per capita, Nov. 2023: 3.8 per 1,000 residents
- Total firearm background checks, Nov. 2023: 12,218 (10th lowest)
- Firearm background checks per capita, Nov. 2022: 3.6 per 1,000 (9th lowest)
- Total firearm background checks, Nov. 2022: 11,304 (13th lowest)
- Population: 3,177,772 (19th lowest)
41. Delaware

- Firearm background checks per capita, Nov. 2023: 4.2 per 1,000 residents
- Total firearm background checks, Nov. 2023: 4,281 (4th lowest)
- Firearm background checks per capita, Nov. 2022: 4.0 per 1,000 (10th lowest)
- Total firearm background checks, Nov. 2022: 4,035 (4th lowest)
- Population: 1,018,396 (6th lowest)
40. Iowa

- Firearm background checks per capita, Nov. 2023: 4.3 per 1,000 residents
- Total firearm background checks, Nov. 2023: 13,783 (13th lowest)
- Firearm background checks per capita, Nov. 2022: 4.2 per 1,000 (11th lowest)
- Total firearm background checks, Nov. 2022: 13,373 (15th lowest)
- Population: 3,200,517 (20th lowest)
39. Maryland

- Firearm background checks per capita, Nov. 2023: 4.3 per 1,000 residents
- Total firearm background checks, Nov. 2023: 26,633 (25th highest)
- Firearm background checks per capita, Nov. 2022: 6.4 per 1,000 (25th highest)
- Total firearm background checks, Nov. 2022: 39,708 (19th highest)
- Population: 6,164,660 (19th highest)
38. Georgia

- Firearm background checks per capita, Nov. 2023: 4.6 per 1,000 residents
- Total firearm background checks, Nov. 2023: 50,327 (12th highest)
- Firearm background checks per capita, Nov. 2022: 4.6 per 1,000 (14th lowest)
- Total firearm background checks, Nov. 2022: 49,833 (12th highest)
- Population: 10,912,876 (8th highest)
37. Connecticut

- Firearm background checks per capita, Nov. 2023: 4.7 per 1,000 residents
- Total firearm background checks, Nov. 2023: 16,999 (17th lowest)
- Firearm background checks per capita, Nov. 2022: 4.4 per 1,000 (12th lowest)
- Total firearm background checks, Nov. 2022: 16,015 (17th lowest)
- Population: 3,626,205 (22nd lowest)
36. Texas
- Firearm background checks per capita, Nov. 2023: 5.0 per 1,000 residents
- Total firearm background checks, Nov. 2023: 149,021 (the highest)
- Firearm background checks per capita, Nov. 2022: 4.6 per 1,000 (15th lowest)
- Total firearm background checks, Nov. 2022: 138,599 (the highest)
- Population: 30,029,572 (2nd highest)
35. Arizona
- Firearm background checks per capita, Nov. 2023: 5.7 per 1,000 residents
- Total firearm background checks, Nov. 2023: 41,638 (17th highest)
- Firearm background checks per capita, Nov. 2022: 5.3 per 1,000 (18th lowest)
- Total firearm background checks, Nov. 2022: 39,287 (20th highest)
- Population: 7,359,197 (14th highest)
34. North Carolina

- Firearm background checks per capita, Nov. 2023: 5.7 per 1,000 residents
- Total firearm background checks, Nov. 2023: 60,837 (8th highest)
- Firearm background checks per capita, Nov. 2022: 4.5 per 1,000 (13th lowest)
- Total firearm background checks, Nov. 2022: 48,228 (13th highest)
- Population: 10,698,973 (9th highest)
33. Vermont

- Firearm background checks per capita, Nov. 2023: 5.7 per 1,000 residents
- Total firearm background checks, Nov. 2023: 3,688 (3rd lowest)
- Firearm background checks per capita, Nov. 2022: 5.7 per 1,000 (19th lowest)
- Total firearm background checks, Nov. 2022: 3,704 (3rd lowest)
- Population: 647,064 (2nd lowest)
32. Florida
- Firearm background checks per capita, Nov. 2023: 5.8 per 1,000 residents
- Total firearm background checks, Nov. 2023: 128,109 (2nd highest)
- Firearm background checks per capita, Nov. 2022: 5.2 per 1,000 (17th lowest)
- Total firearm background checks, Nov. 2022: 114,977 (2nd highest)
- Population: 22,244,823 (3rd highest)
31. Ohio

- Firearm background checks per capita, Nov. 2023: 5.8 per 1,000 residents
- Total firearm background checks, Nov. 2023: 68,143 (6th highest)
- Firearm background checks per capita, Nov. 2022: 5.2 per 1,000 (16th lowest)
- Total firearm background checks, Nov. 2022: 60,607 (8th highest)
- Population: 11,756,058 (7th highest)
30. Washington

- Firearm background checks per capita, Nov. 2023: 5.9 per 1,000 residents
- Total firearm background checks, Nov. 2023: 46,211 (15th highest)
- Firearm background checks per capita, Nov. 2022: 5.9 per 1,000 (21st lowest)
- Total firearm background checks, Nov. 2022: 46,202 (15th highest)
- Population: 7,785,786 (13th highest)
29. South Carolina
- Firearm background checks per capita, Nov. 2023: 6.0 per 1,000 residents
- Total firearm background checks, Nov. 2023: 31,749 (22nd highest)
- Firearm background checks per capita, Nov. 2022: 6.6 per 1,000 (23rd highest)
- Total firearm background checks, Nov. 2022: 34,905 (22nd highest)
- Population: 5,282,634 (23rd highest)
28. Kansas
- Firearm background checks per capita, Nov. 2023: 6.0 per 1,000 residents
- Total firearm background checks, Nov. 2023: 17,750 (18th lowest)
- Firearm background checks per capita, Nov. 2022: 6.0 per 1,000 (22nd lowest)
- Total firearm background checks, Nov. 2022: 17,521 (18th lowest)
- Population: 2,937,150 (16th lowest)
27. Virginia

- Firearm background checks per capita, Nov. 2023: 6.2 per 1,000 residents
- Total firearm background checks, Nov. 2023: 53,783 (10th highest)
- Firearm background checks per capita, Nov. 2022: 5.9 per 1,000 (20th lowest)
- Total firearm background checks, Nov. 2022: 51,056 (11th highest)
- Population: 8,683,619 (12th highest)
26. Louisiana

- Firearm background checks per capita, Nov. 2023: 6.3 per 1,000 residents
- Total firearm background checks, Nov. 2023: 29,070 (24th highest)
- Firearm background checks per capita, Nov. 2022: 6.2 per 1,000 (24th lowest)
- Total firearm background checks, Nov. 2022: 28,556 (25th highest)
- Population: 4,590,241 (25th highest)
25. New Mexico

- Firearm background checks per capita, Nov. 2023: 6.6 per 1,000 residents
- Total firearm background checks, Nov. 2023: 13,897 (14th lowest)
- Firearm background checks per capita, Nov. 2022: 6.6 per 1,000 (21st highest)
- Total firearm background checks, Nov. 2022: 13,980 (16th lowest)
- Population: 2,113,344 (15th lowest)
24. Minnesota
- Firearm background checks per capita, Nov. 2023: 6.6 per 1,000 residents
- Total firearm background checks, Nov. 2023: 37,811 (18th highest)
- Firearm background checks per capita, Nov. 2022: 6.6 per 1,000 (24th highest)
- Total firearm background checks, Nov. 2022: 37,651 (21st highest)
- Population: 5,717,184 (22nd highest)
23. Kentucky
- Firearm background checks per capita, Nov. 2023: 6.6 per 1,000 residents
- Total firearm background checks, Nov. 2023: 29,958 (23rd highest)
- Firearm background checks per capita, Nov. 2022: 6.2 per 1,000 (23rd lowest)
- Total firearm background checks, Nov. 2022: 27,831 (25th lowest)
- Population: 4,512,310 (25th lowest)
22. Indiana

- Firearm background checks per capita, Nov. 2023: 6.8 per 1,000 residents
- Total firearm background checks, Nov. 2023: 46,681 (14th highest)
- Firearm background checks per capita, Nov. 2022: 6.6 per 1,000 (22nd highest)
- Total firearm background checks, Nov. 2022: 45,168 (16th highest)
- Population: 6,833,037 (17th highest)
21. Michigan

- Firearm background checks per capita, Nov. 2023: 7.0 per 1,000 residents
- Total firearm background checks, Nov. 2023: 70,328 (5th highest)
- Firearm background checks per capita, Nov. 2022: 6.4 per 1,000 (25th lowest)
- Total firearm background checks, Nov. 2022: 64,166 (7th highest)
- Population: 10,034,113 (10th highest)
20. Utah
- Firearm background checks per capita, Nov. 2023: 7.1 per 1,000 residents
- Total firearm background checks, Nov. 2023: 23,863 (23rd lowest)
- Firearm background checks per capita, Nov. 2022: 7.2 per 1,000 (18th highest)
- Total firearm background checks, Nov. 2022: 24,288 (23rd lowest)
- Population: 3,380,800 (21st lowest)
19. Colorado

- Firearm background checks per capita, Nov. 2023: 7.2 per 1,000 residents
- Total firearm background checks, Nov. 2023: 42,161 (16th highest)
- Firearm background checks per capita, Nov. 2022: 7.5 per 1,000 (16th highest)
- Total firearm background checks, Nov. 2022: 43,551 (17th highest)
- Population: 5,839,926 (21st highest)
18. Arkansas
- Firearm background checks per capita, Nov. 2023: 7.7 per 1,000 residents
- Total firearm background checks, Nov. 2023: 23,321 (21st lowest)
- Firearm background checks per capita, Nov. 2022: 7.1 per 1,000 (19th highest)
- Total firearm background checks, Nov. 2022: 21,689 (22nd lowest)
- Population: 3,045,637 (18th lowest)
17. Oregon

- Firearm background checks per capita, Nov. 2023: 8.0 per 1,000 residents
- Total firearm background checks, Nov. 2023: 33,986 (19th highest)
- Firearm background checks per capita, Nov. 2022: 21.5 per 1,000 (the highest)
- Total firearm background checks, Nov. 2022: 91,073 (5th highest)
- Population: 4,240,137 (24th lowest)
16. Pennsylvania

- Firearm background checks per capita, Nov. 2023: 8.0 per 1,000 residents
- Total firearm background checks, Nov. 2023: 104,201 (4th highest)
- Firearm background checks per capita, Nov. 2022: 8.1 per 1,000 (12th highest)
- Total firearm background checks, Nov. 2022: 105,538 (3rd highest)
- Population: 12,972,008 (5th highest)
15. Missouri
- Firearm background checks per capita, Nov. 2023: 8.1 per 1,000 residents
- Total firearm background checks, Nov. 2023: 50,107 (13th highest)
- Firearm background checks per capita, Nov. 2022: 7.7 per 1,000 (15th highest)
- Total firearm background checks, Nov. 2022: 47,399 (14th highest)
- Population: 6,177,957 (18th highest)
14. North Dakota

- Firearm background checks per capita, Nov. 2023: 8.4 per 1,000 residents
- Total firearm background checks, Nov. 2023: 6,516 (7th lowest)
- Firearm background checks per capita, Nov. 2022: 7.4 per 1,000 (17th highest)
- Total firearm background checks, Nov. 2022: 5,754 (5th lowest)
- Population: 779,261 (4th lowest)
13. Oklahoma

- Firearm background checks per capita, Nov. 2023: 8.4 per 1,000 residents
- Total firearm background checks, Nov. 2023: 33,811 (20th highest)
- Firearm background checks per capita, Nov. 2022: 8.1 per 1,000 (13th highest)
- Total firearm background checks, Nov. 2022: 32,606 (23rd highest)
- Population: 4,019,800 (23rd lowest)
12. Mississippi

- Firearm background checks per capita, Nov. 2023: 8.4 per 1,000 residents
- Total firearm background checks, Nov. 2023: 24,761 (25th lowest)
- Firearm background checks per capita, Nov. 2022: 8.6 per 1,000 (11th highest)
- Total firearm background checks, Nov. 2022: 25,198 (24th lowest)
- Population: 2,940,057 (17th lowest)
11. Wisconsin
- Firearm background checks per capita, Nov. 2023: 8.6 per 1,000 residents
- Total firearm background checks, Nov. 2023: 50,476 (11th highest)
- Firearm background checks per capita, Nov. 2022: 9.9 per 1,000 (7th highest)
- Total firearm background checks, Nov. 2022: 58,280 (10th highest)
- Population: 5,892,539 (20th highest)
10. Alaska

- Firearm background checks per capita, Nov. 2023: 8.6 per 1,000 residents
- Total firearm background checks, Nov. 2023: 6,321 (5th lowest)
- Firearm background checks per capita, Nov. 2022: 9.5 per 1,000 (9th highest)
- Total firearm background checks, Nov. 2022: 6,981 (8th lowest)
- Population: 733,583 (3rd lowest)
9. South Dakota
- Firearm background checks per capita, Nov. 2023: 8.9 per 1,000 residents
- Total firearm background checks, Nov. 2023: 8,127 (9th lowest)
- Firearm background checks per capita, Nov. 2022: 9.2 per 1,000 (10th highest)
- Total firearm background checks, Nov. 2022: 8,330 (9th lowest)
- Population: 909,824 (5th lowest)
8. Maine

- Firearm background checks per capita, Nov. 2023: 9.0 per 1,000 residents
- Total firearm background checks, Nov. 2023: 12,421 (12th lowest)
- Firearm background checks per capita, Nov. 2022: 7.0 per 1,000 (20th highest)
- Total firearm background checks, Nov. 2022: 9,633 (10th lowest)
- Population: 1,385,340 (9th lowest)
7. Tennessee
- Firearm background checks per capita, Nov. 2023: 9.2 per 1,000 residents
- Total firearm background checks, Nov. 2023: 64,866 (7th highest)
- Firearm background checks per capita, Nov. 2022: 10.4 per 1,000 (3rd highest)
- Total firearm background checks, Nov. 2022: 73,315 (6th highest)
- Population: 7,051,339 (15th highest)
6. Idaho

- Firearm background checks per capita, Nov. 2023: 9.9 per 1,000 residents
- Total firearm background checks, Nov. 2023: 19,180 (20th lowest)
- Firearm background checks per capita, Nov. 2022: 10.2 per 1,000 (5th highest)
- Total firearm background checks, Nov. 2022: 19,703 (20th lowest)
- Population: 1,939,033 (13th lowest)
5. West Virginia
- Firearm background checks per capita, Nov. 2023: 10.6 per 1,000 residents
- Total firearm background checks, Nov. 2023: 18,729 (19th lowest)
- Firearm background checks per capita, Nov. 2022: 10.1 per 1,000 (6th highest)
- Total firearm background checks, Nov. 2022: 17,952 (19th lowest)
- Population: 1,775,156 (12th lowest)
4. Alabama
- Firearm background checks per capita, Nov. 2023: 11.0 per 1,000 residents
- Total firearm background checks, Nov. 2023: 55,844 (9th highest)
- Firearm background checks per capita, Nov. 2022: 11.9 per 1,000 (2nd highest)
- Total firearm background checks, Nov. 2022: 60,215 (9th highest)
- Population: 5,074,296 (24th highest)
3. Montana

- Firearm background checks per capita, Nov. 2023: 11.0 per 1,000 residents
- Total firearm background checks, Nov. 2023: 12,387 (11th lowest)
- Firearm background checks per capita, Nov. 2022: 9.6 per 1,000 (8th highest)
- Total firearm background checks, Nov. 2022: 10,756 (11th lowest)
- Population: 1,122,867 (8th lowest)
2. Wyoming

- Firearm background checks per capita, Nov. 2023: 11.1 per 1,000 residents
- Total firearm background checks, Nov. 2023: 6,457 (6th lowest)
- Firearm background checks per capita, Nov. 2022: 10.2 per 1,000 (4th highest)
- Total firearm background checks, Nov. 2022: 5,927 (6th lowest)
- Population: 581,381 (the lowest)
1. New Hampshire
- Firearm background checks per capita, Nov. 2023: 11.6 per 1,000 residents
- Total firearm background checks, Nov. 2023: 16,201 (16th lowest)
- Firearm background checks per capita, Nov. 2022: 8.0 per 1,000 (14th highest)
- Total firearm background checks, Nov. 2022: 11,178 (12th lowest)
- Population: 1,395,231 (10th lowest)
Methodology
To identify the states where the most people bought guns last month, 24/7 Wall St. used data from the FBI’s National Instant Criminal Background Check System. States were ranked based on the number of background checks per 1,000 people in November 2023. To reach a more accurate approximation of gun sales, we adjusted background checks by excluding checks for such categories as pawn shop transactions, returns, rentals, and rechecks.
Even after removing some types of checks that are clearly unrelated to a new firearm purchase, because every state has different laws in terms of when background checks are required and different accounting practices, background checks still only serve as a rough approximation of gun sales.
The most glaring example of this is Illinois, which alone accounted for about half of the background checks in the country after excluding the aforementioned categories. Illinois no longer breaks down background checks separately, but did from July 2016 through July 2021. During the four full years of data, an average of 9.2% of Illinois’s non-private sale or gun-specific permit checks were non-rechecks. We applied that average to the most recent state figures to estimate Illinois’ count. This was done only because Illinois is such a glaring example of inconsistency and because there was historical data to produce an estimate.
There are likely other states for which the background check figures listed are inflated or underestimated proxies for gun sales.
Population data came from the U.S. Census Bureau’s Population and Housing Unit Estimates Program, and are for July of 2022, the most recent data available.
Contact [email protected] for any questions or corrections.