Sometimes, it feels like there is road construction everywhere — all the time. It seems that just as repairs on one section of the highway are done, another section is being widened. And yet, despite all the maintenance, there are still roads in poor condition, congestion on some highways, and bridges that are in need of repair.
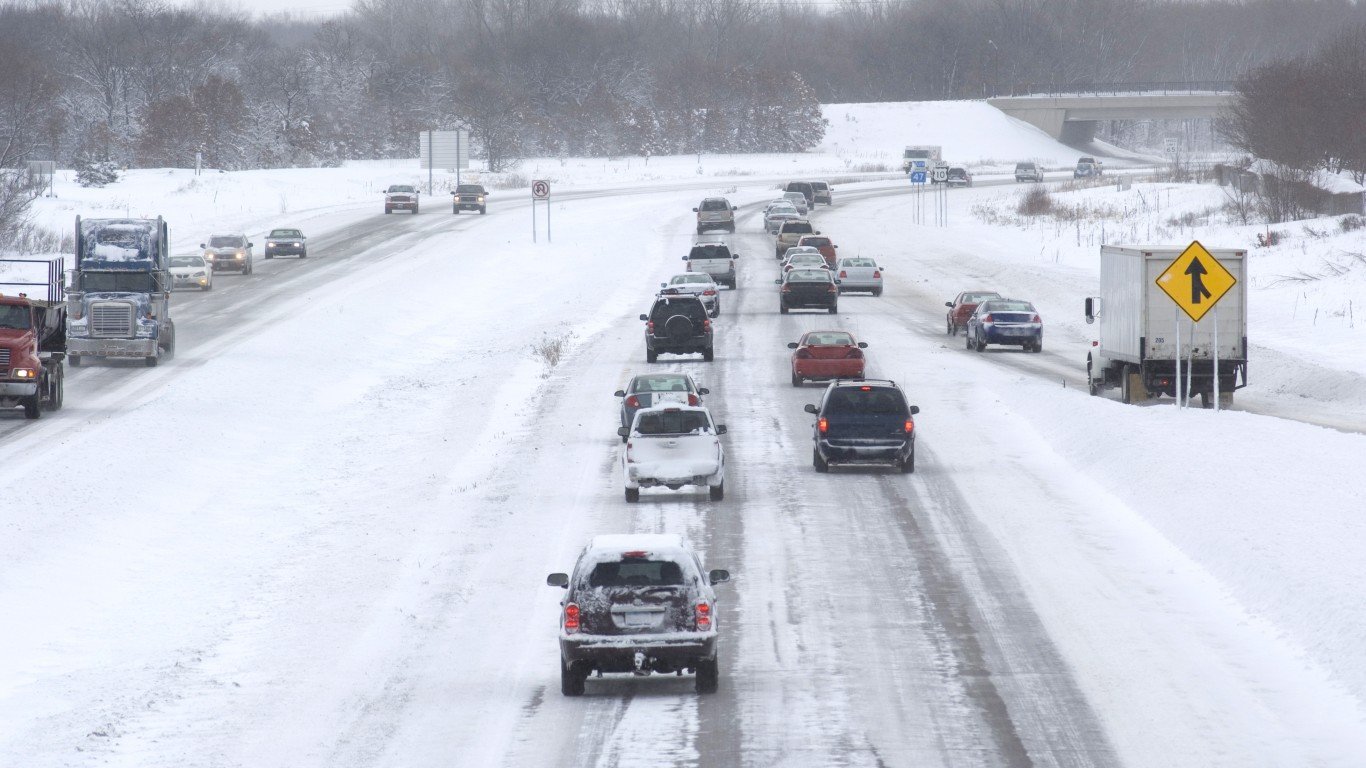
Of course, the situation is different by state, and the requirements are different too. States that experience harsh winters, for example, often need more pothole repairs. To be able to compare states on a relative basis, Libertarian Reason Foundation’s Annual Highway Report uses each state’s highway system budgets (per mile of responsibility) with the highway system performance. Specifically, the report looks at 13 categories, including urban and rural pavement condition, deficient bridges, traffic fatalities, spending per mile, and administrative costs per mile of highway.
To find the state with the worst highways in America, 24/7 Wall St. reviewed Reason Foundation’s 27th Annual Highway Report, listing the states by their overall rank, from best to worst, along with several measures from the report. “States with high ratings typically have better-than-average system conditions (good for road users) along with relatively low per-mile expenditures (good for taxpayers),” the report explains. All data is from the report, though for total disbursements, we added the different disbursement categories.
Numerous factors affect the ranking, including terrain, climate, truck volumes, urbanization, highway/road system age, budget priorities, cost differences, state budget circumstances, and management/maintenance philosophies and policies. (Also see: This Is the Worst American City To Drive In.)
The top-ranking states are Connecticut, Georgia, Tennessee, North Carolina, and Virginia. The states at the top are a mix, with some large states and some small ones — both by geographic area and population — as well as some that are more urban and more. The lowest-rankings are Washington, California, Hawaii, New York, and Alaska.
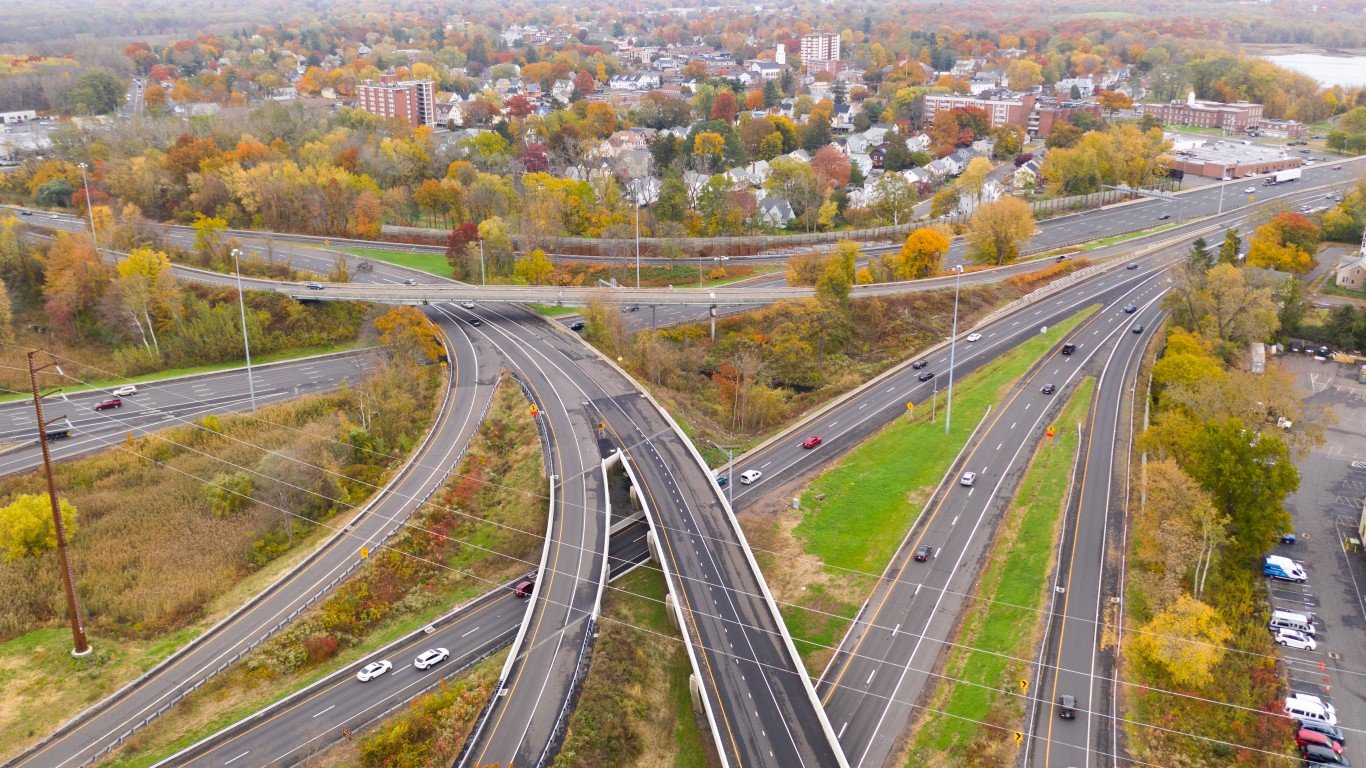
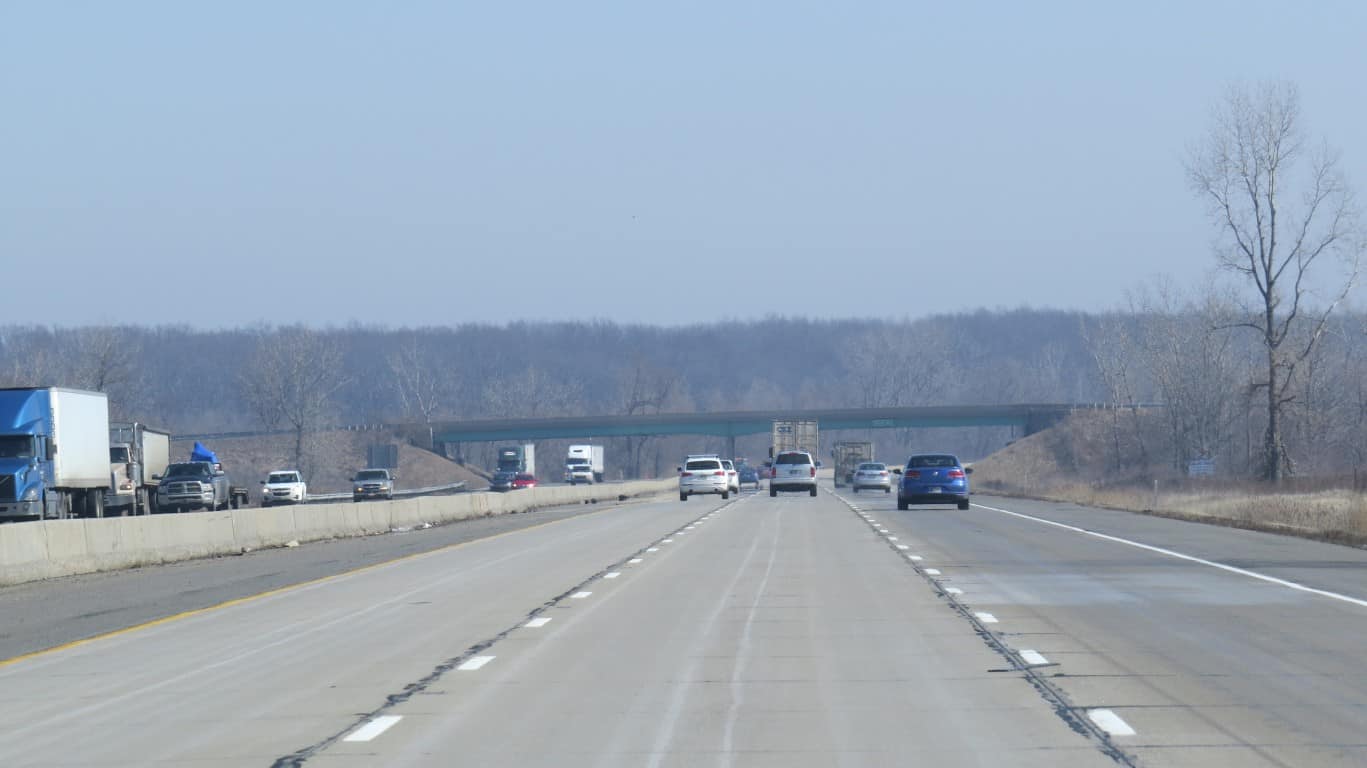
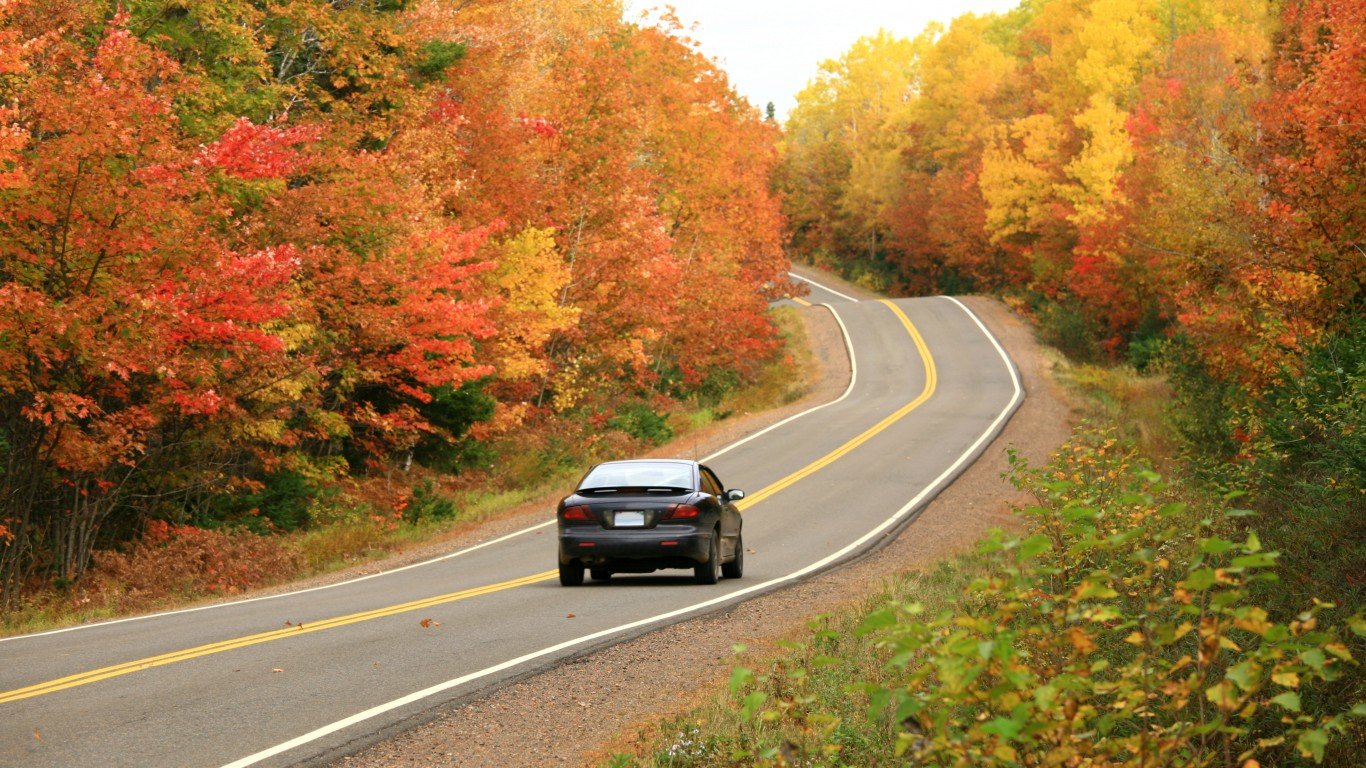
Virginia — overall rank: 1
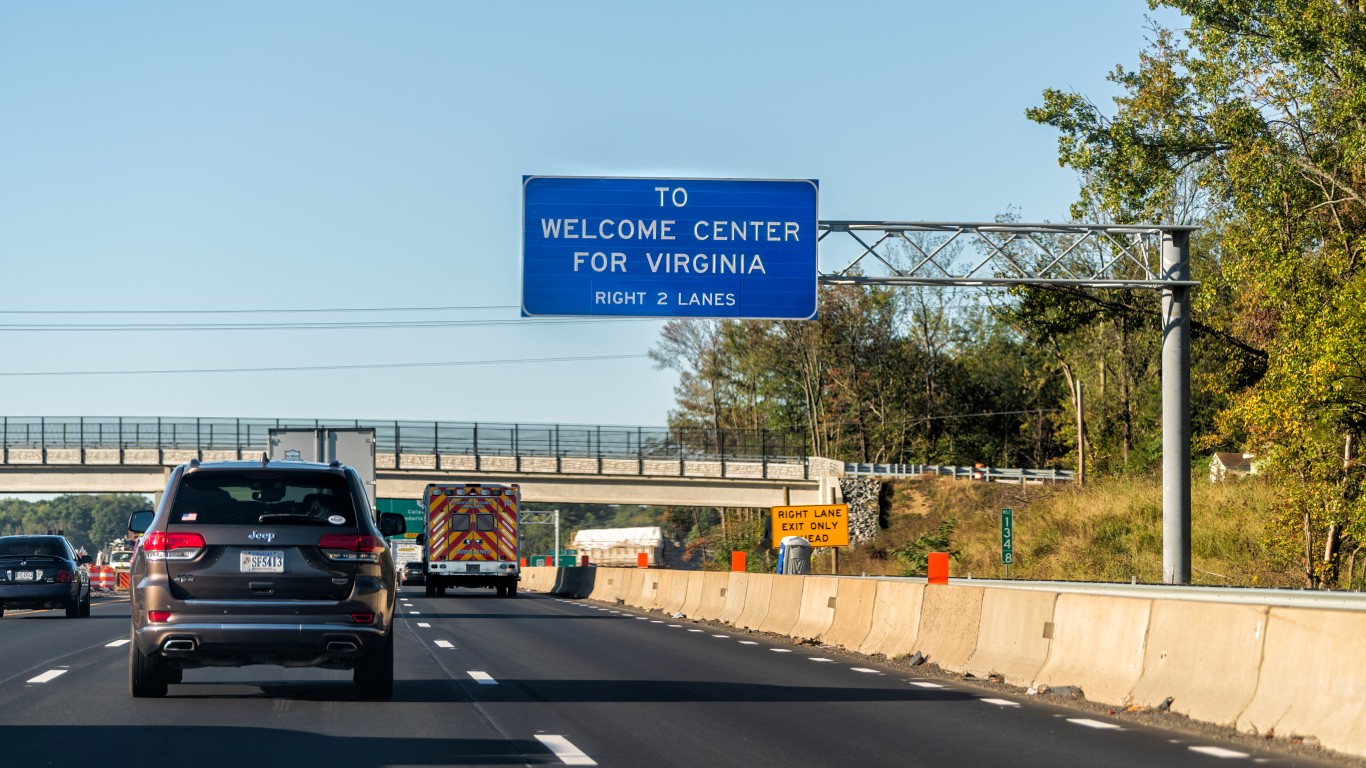
Source: krblokhin / iStock Editorial via Getty Images
- Worst ranking category: Other fatality rate — category rank: 29
- Total disbursements per lane-mile: $34,870 — 8th lowest
- Percent urban interstate mileage in poor condition: 2.57% — category rank: 19
- Percent rural interstate mileage in poor condition: 0.35% — category rank: 5
- Percent structurally deficient bridges: 3.79% — category rank: 10
- State-control highway miles: 128,989 — 3rd highest
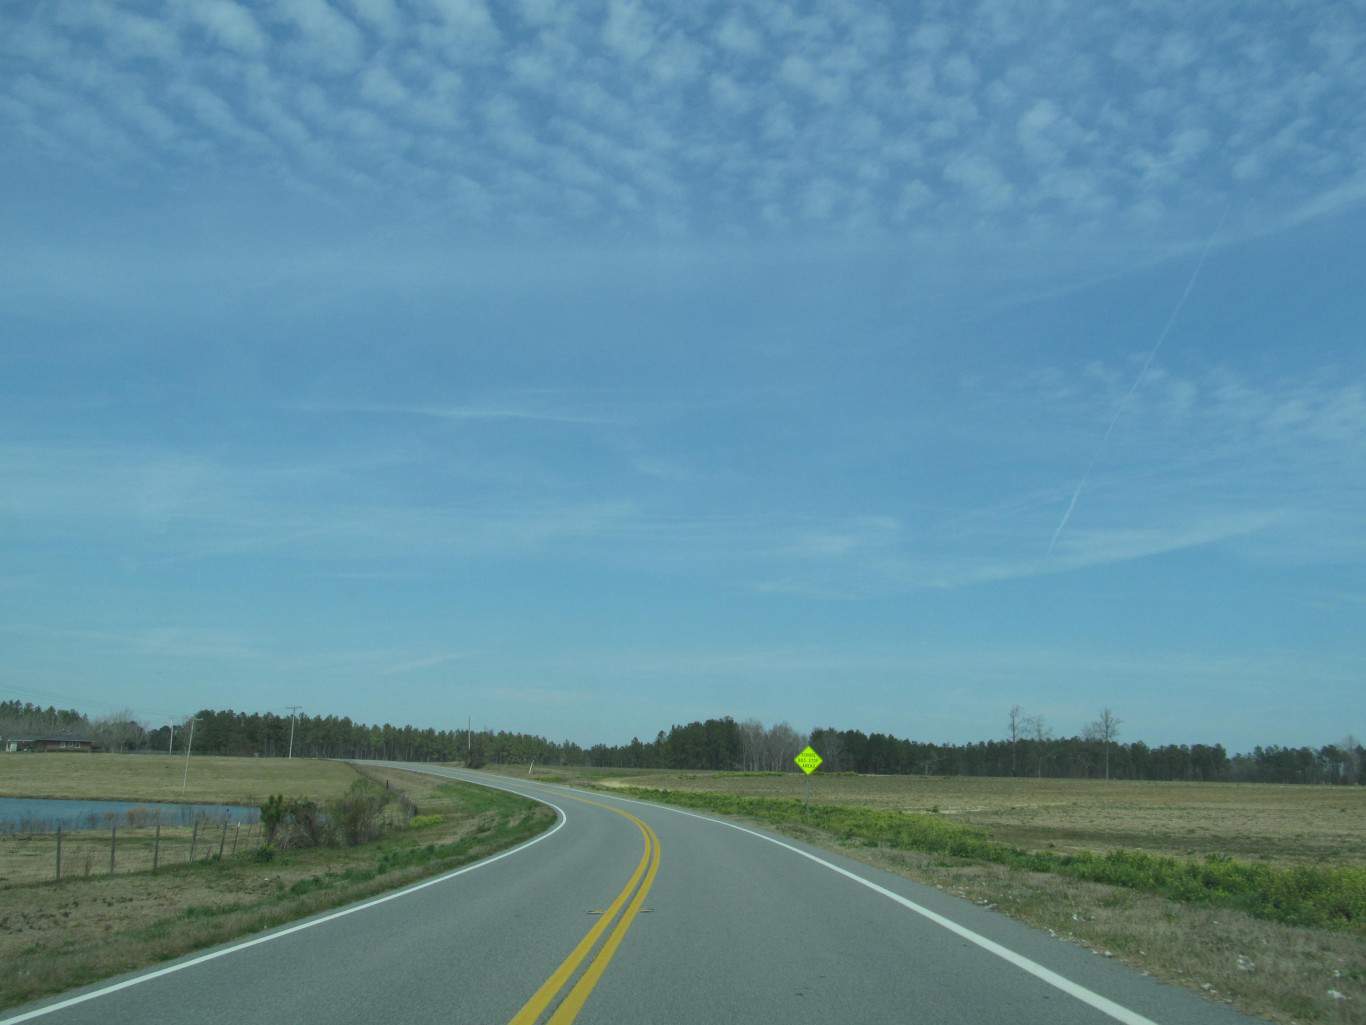
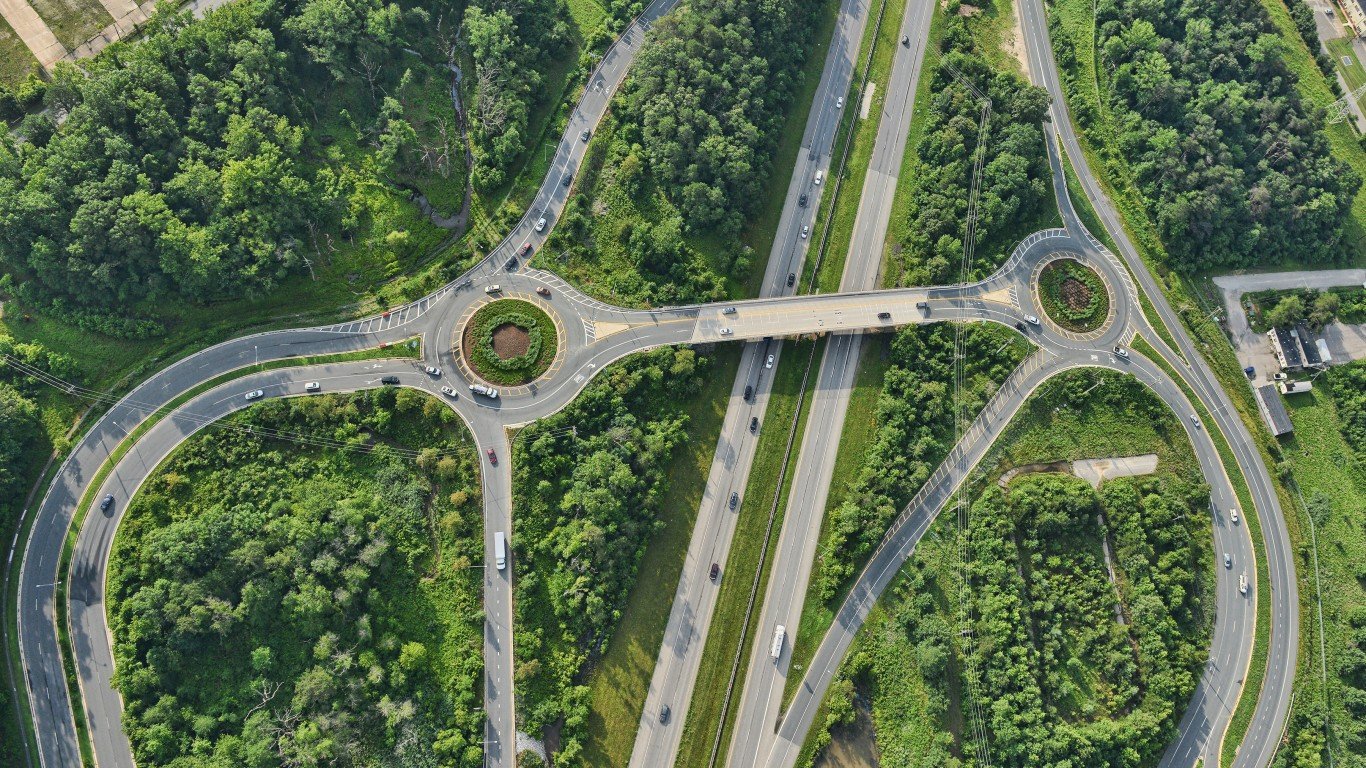
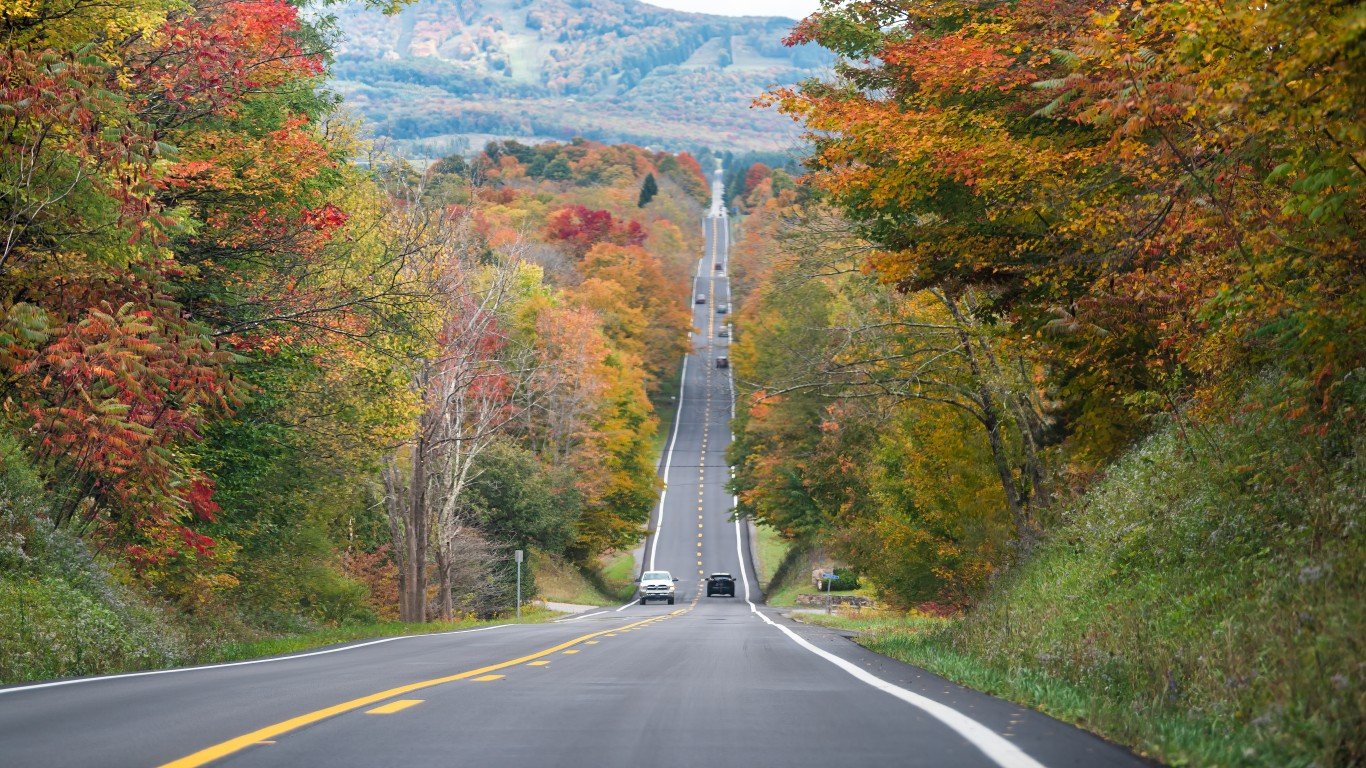
North Carolina — overall rank: 2
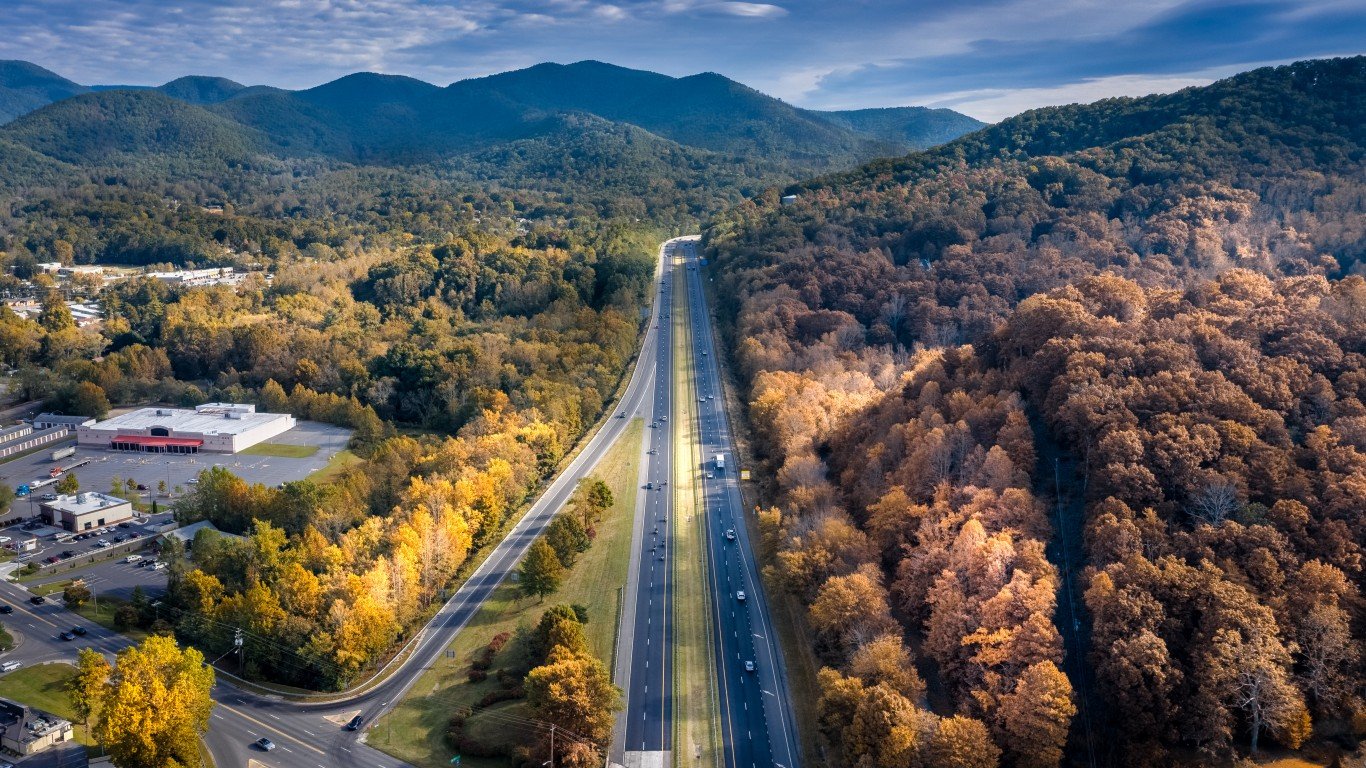
Source: rodclementphotography / iStock via Getty Images
- Worst ranking category: Other fatality rate — category rank: 39
- Total disbursements per lane-mile: $41,126 — 15th lowest
- Percent urban interstate mileage in poor condition: 2.27% — category rank: 15
- Percent rural interstate mileage in poor condition: 0.77% — category rank: 15
- Percent structurally deficient bridges: 7.02% — category rank: 30
- State-control highway miles: 173,653 — 2nd highest
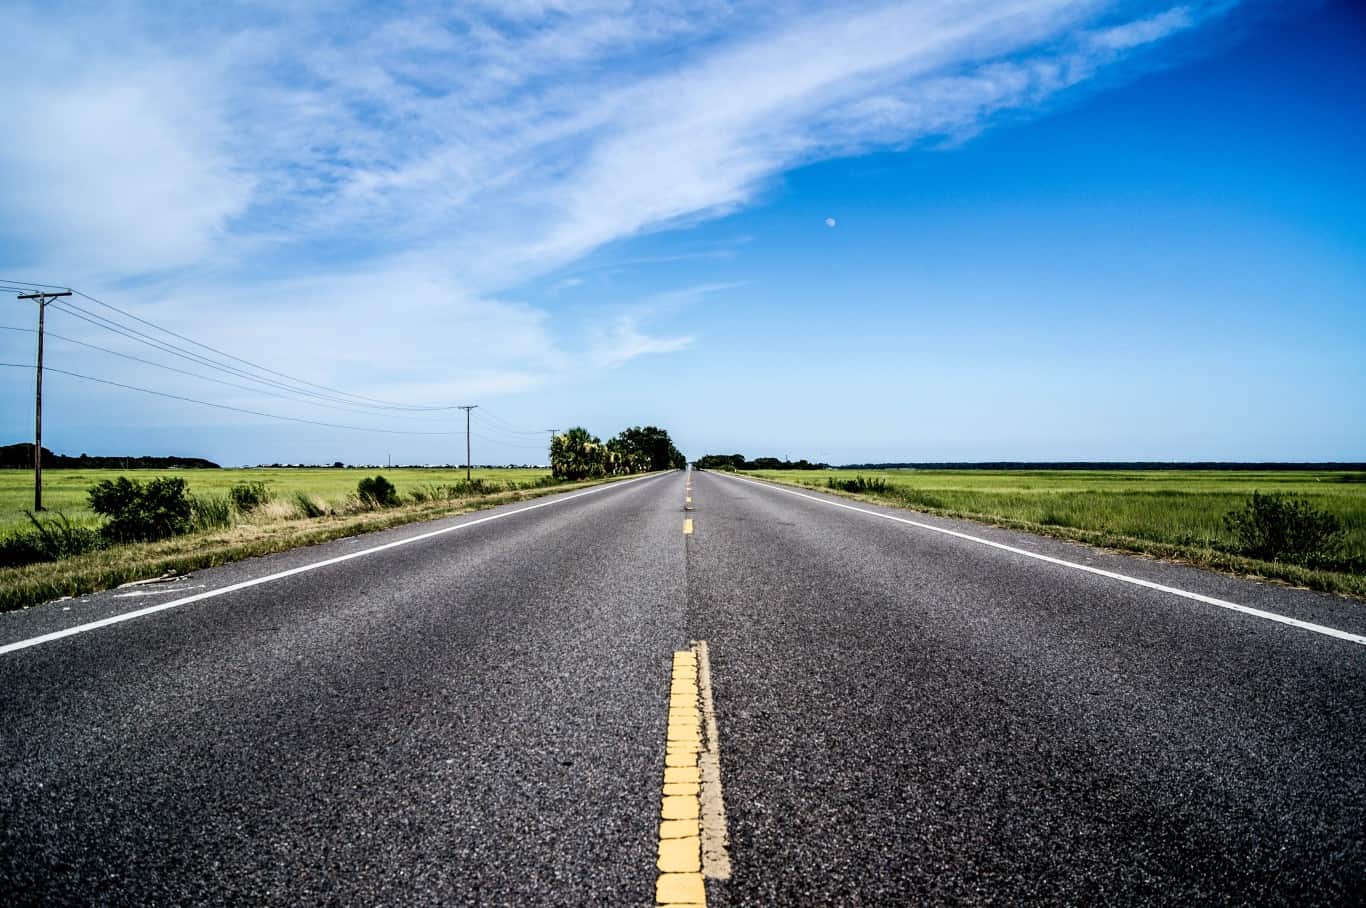
Tennessee — overall rank: 3
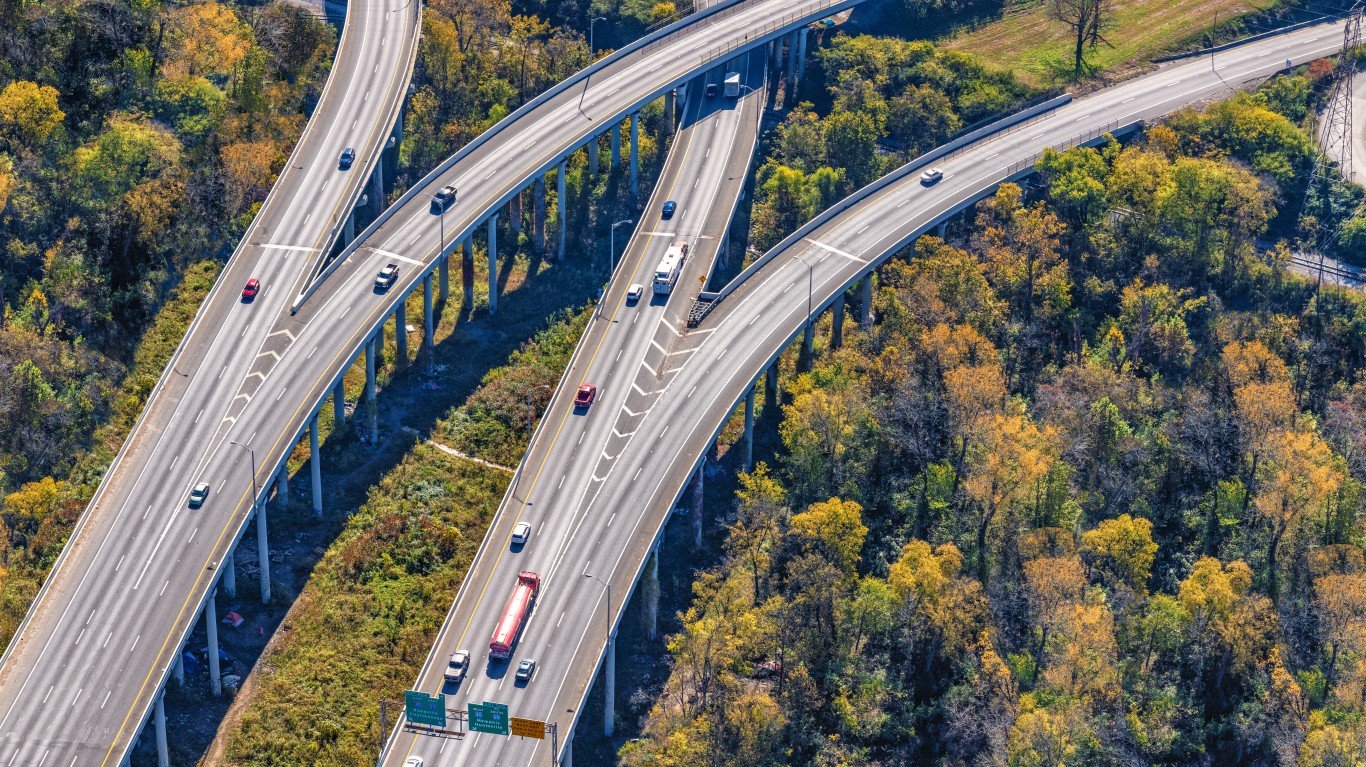
Source: Art Wager / E+ via Getty Images
- Worst ranking category: Urban fatality rate — category rank: 47
- Total disbursements per lane-mile: $48,910 — 16th lowest
- Percent urban interstate mileage in poor condition: 1.66% — category rank: 10
- Percent rural interstate mileage in poor condition: 0.67% — category rank: 12
- Percent structurally deficient bridges: 4.14% — category rank: 11
- State-control highway miles: 37,746 — 17th highest
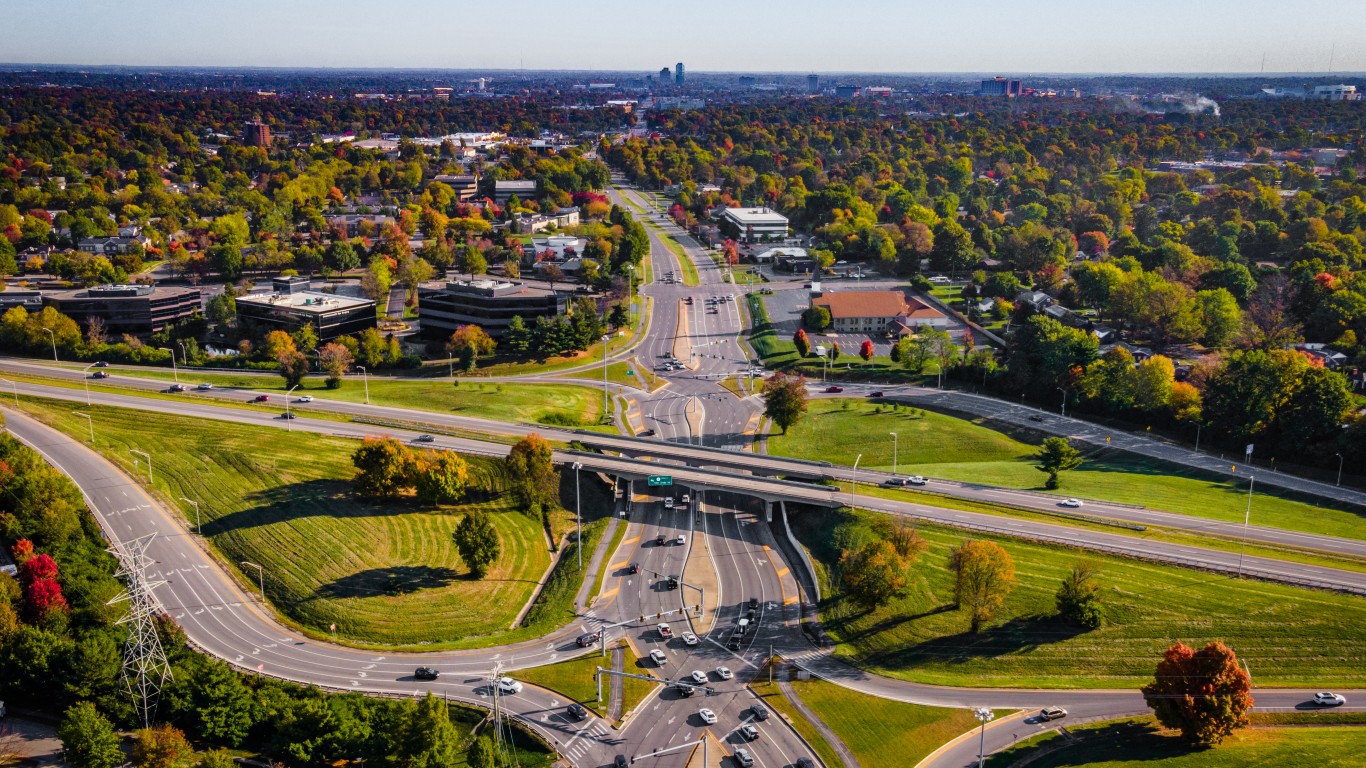
Georgia — overall rank: 4
Source: dougtone / Flickr
- Worst ranking category: Urbanized area congestion — category rank: 40
- Total disbursements per lane-mile: $66,805 — 20th lowest
- Percent urban interstate mileage in poor condition: 1.36% — category rank: 5
- Percent rural interstate mileage in poor condition: 0.91% — category rank: 18
- Percent structurally deficient bridges: 2.13% — category rank: 6
- State-control highway miles: 49,497 — 11th highest
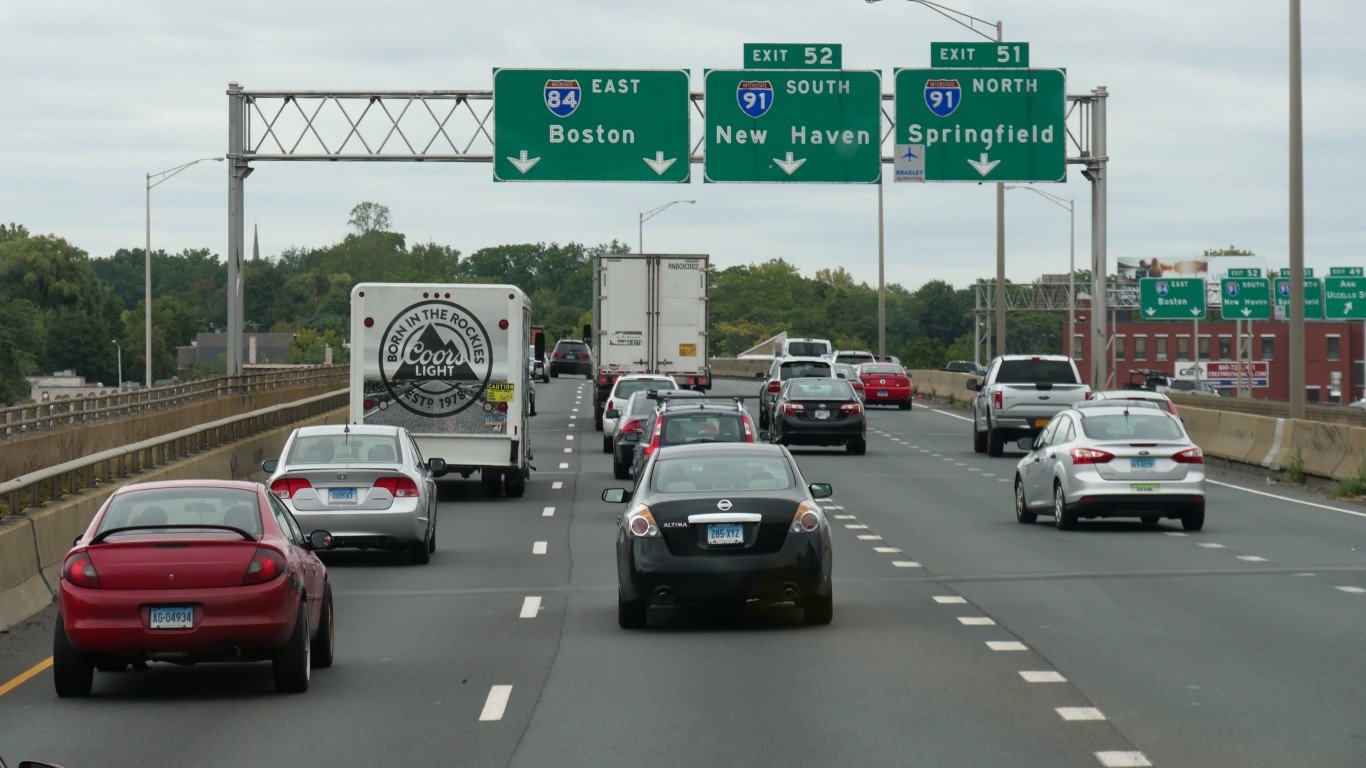
Connecticut — overall rank: 5
Source: ChrisBoswell / iStock via Getty Images
- Worst ranking category: Urbanized area congestion — category rank: 42
- Total disbursements per lane-mile: $205,881 — 8th highest
- Percent urban interstate mileage in poor condition: 1.57% — category rank: 8
- Percent rural interstate mileage in poor condition: 0.73% — category rank: 13
- Percent structurally deficient bridges: 5.30% — category rank: 22
- State-control highway miles: 9,827 — 7th lowest
South Carolina — overall rank: 6
Source: evoflash / Flickr
- Worst ranking category: Rural fatality rate — category rank: 50
- Total disbursements per lane-mile: $27,474 — 3rd lowest
- Percent urban interstate mileage in poor condition: 1.13% — category rank: 3
- Percent rural interstate mileage in poor condition: 0.95% — category rank: 19
- Percent structurally deficient bridges: 5.31% — category rank: 23
- State-control highway miles: 90,552 — 4th highest
Kentucky — overall rank: 7
Source: Ivelin Denev / iStock via Getty Images
- Worst ranking category: Other fatality rate — category rank: 48
- Total disbursements per lane-mile: $36,139 — 11th lowest
- Percent urban interstate mileage in poor condition: 2.32% — category rank: 16
- Percent rural interstate mileage in poor condition: 0.80% — category rank: 16
- Percent structurally deficient bridges: 6.87% — category rank: 26
- State-control highway miles: 62,346 — 8th highest
Florida — overall rank: 8
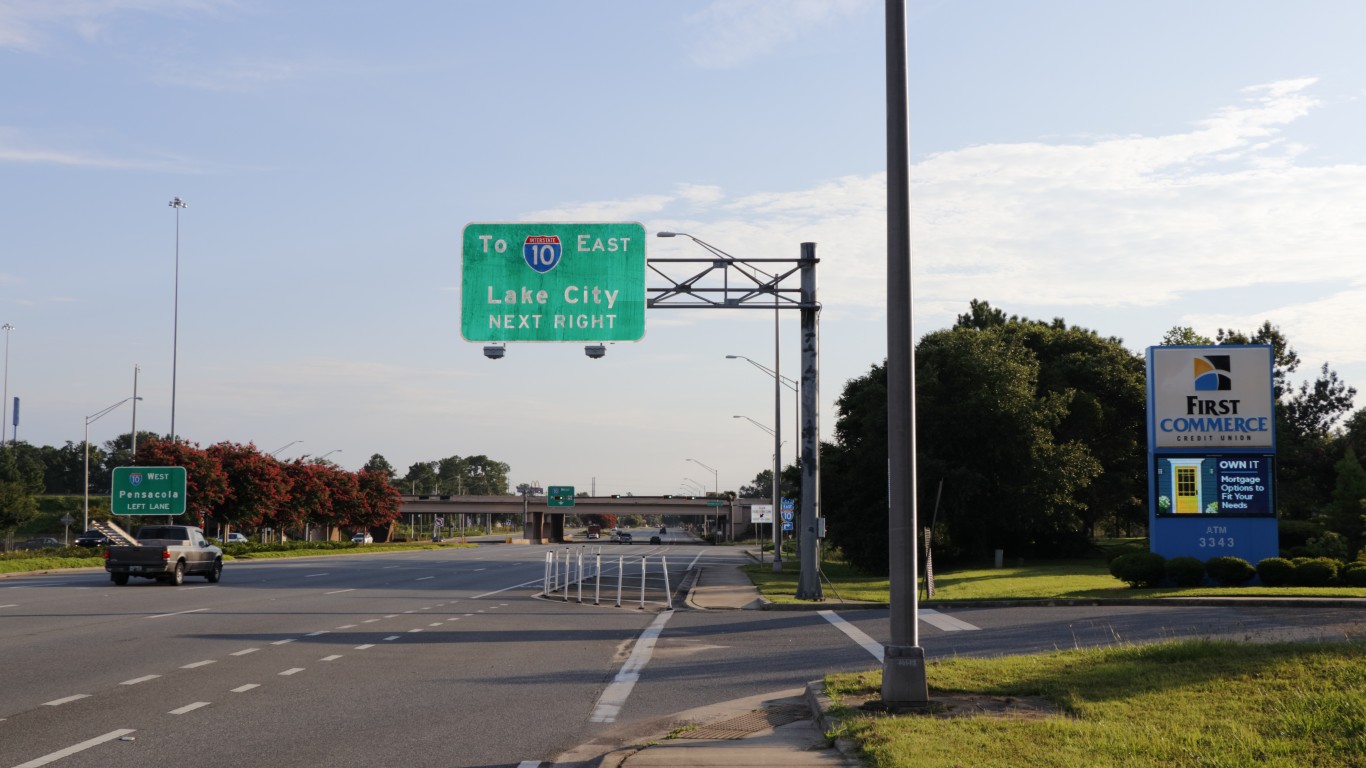
Source: Serenethos / iStock Editorial via Getty Images
- Worst ranking category: Urban fatality rate — category rank: 49
- Total disbursements per lane-mile: $241,859 — 4th highest
- Percent urban interstate mileage in poor condition: 1.59% — category rank: 9
- Percent rural interstate mileage in poor condition: 0.15% — category rank: 1
- Percent structurally deficient bridges: 3.62% — category rank: 8
- State-control highway miles: 45,013 — 12th highest
North Dakota — overall rank: 9
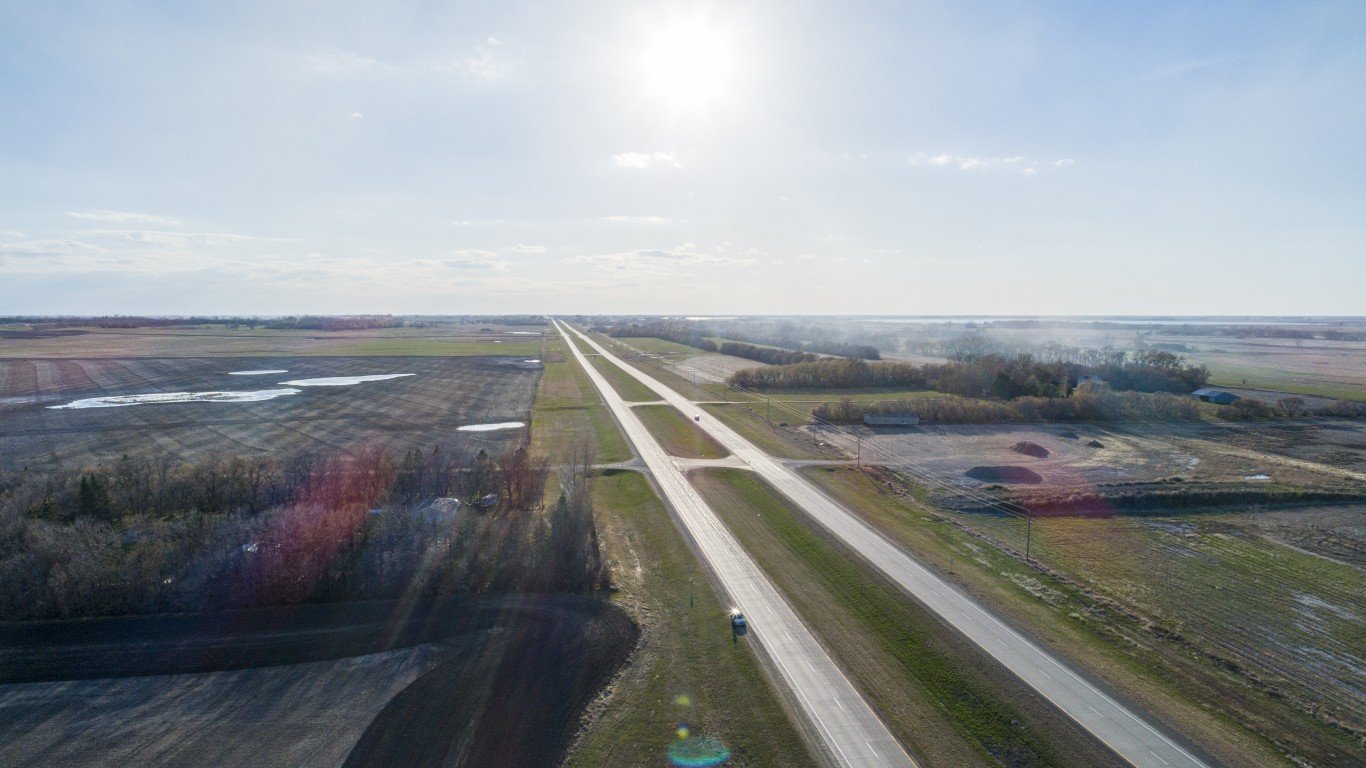
Source: Alex Potemkin / iStock via Getty Images
- Worst ranking category: Structurally deficient bridges — category rank: 43
- Total disbursements per lane-mile: $26,932 — 2nd lowest
- Percent urban interstate mileage in poor condition: 0.98% — category rank: 2
- Percent rural interstate mileage in poor condition: 0.38% — category rank: 7
- Percent structurally deficient bridges: 11.23% — category rank: 43
- State-control highway miles: 17,245 — 15th lowest
Utah — overall rank: 10
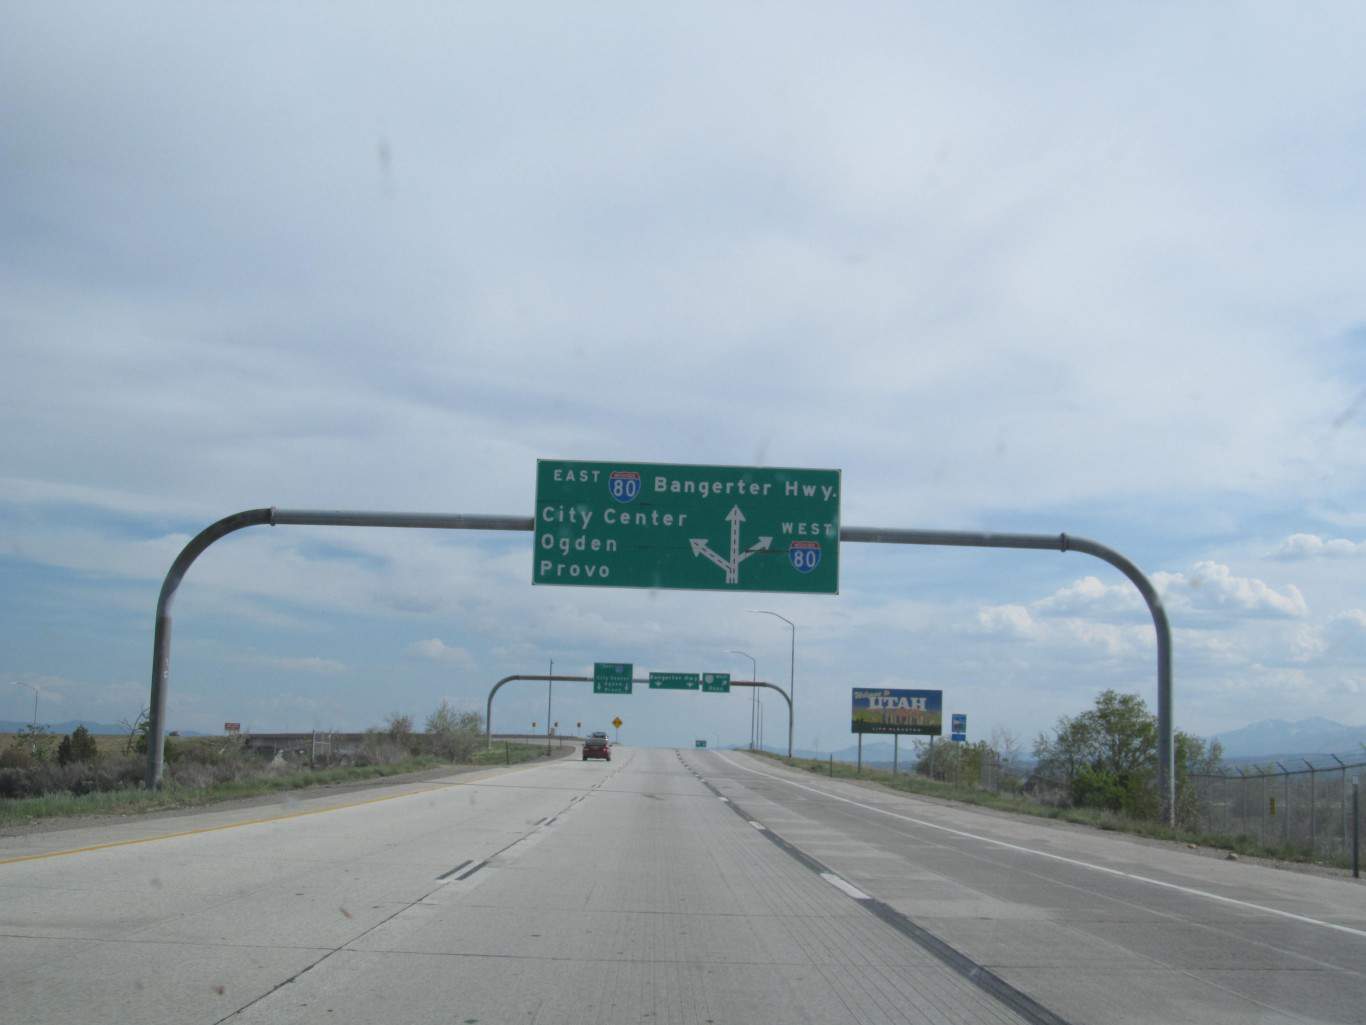
Source: dougtone / Flickr
- Worst ranking category: Other disbursements ratio — category rank: 47
- Total disbursements per lane-mile: $104,697 — 15th highest
- Percent urban interstate mileage in poor condition: 2.69% — category rank: 20
- Percent rural interstate mileage in poor condition: 0.30% — category rank: 4
- Percent structurally deficient bridges: 2.06% — category rank: 5
- State-control highway miles: 16,023 — 14th lowest
Missouri — overall rank: 11
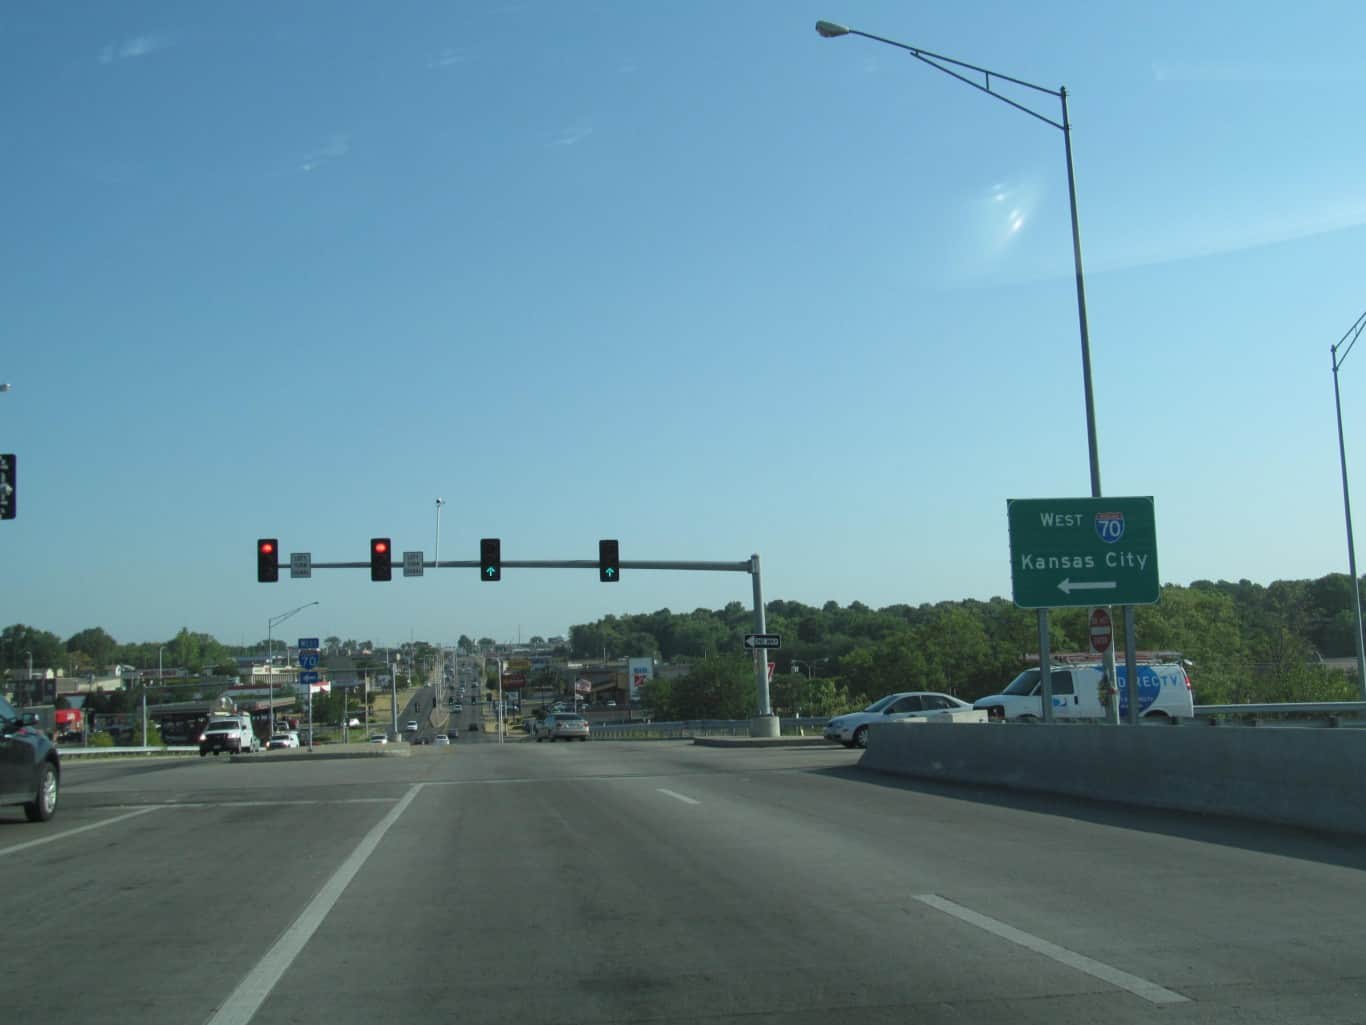
Source: dougtone / Flickr
- Worst ranking category: Urban fatality rate — category rank: 42
- Total disbursements per lane-mile: $27,773 — 5th lowest
- Percent urban interstate mileage in poor condition: 3.03% — category rank: 24
- Percent rural interstate mileage in poor condition: 0.55% — category rank: 9
- Percent structurally deficient bridges: 9.02% — category rank: 39
- State-control highway miles: 77,693 — 6th highest
Minnesota — overall rank: 12
Source: LawrenceSawyer / iStock via Getty Images
- Worst ranking category: Maintenance disbursements ratio — category rank: 40
- Total disbursements per lane-mile: $80,690 — 24th highest
- Percent urban interstate mileage in poor condition: 3.20% — category rank: 27
- Percent rural interstate mileage in poor condition: 0.89% — category rank: 17
- Percent structurally deficient bridges: 4.58% — category rank: 12
- State-control highway miles: 29,176 — 22nd highest
Arkansas — overall rank: 13
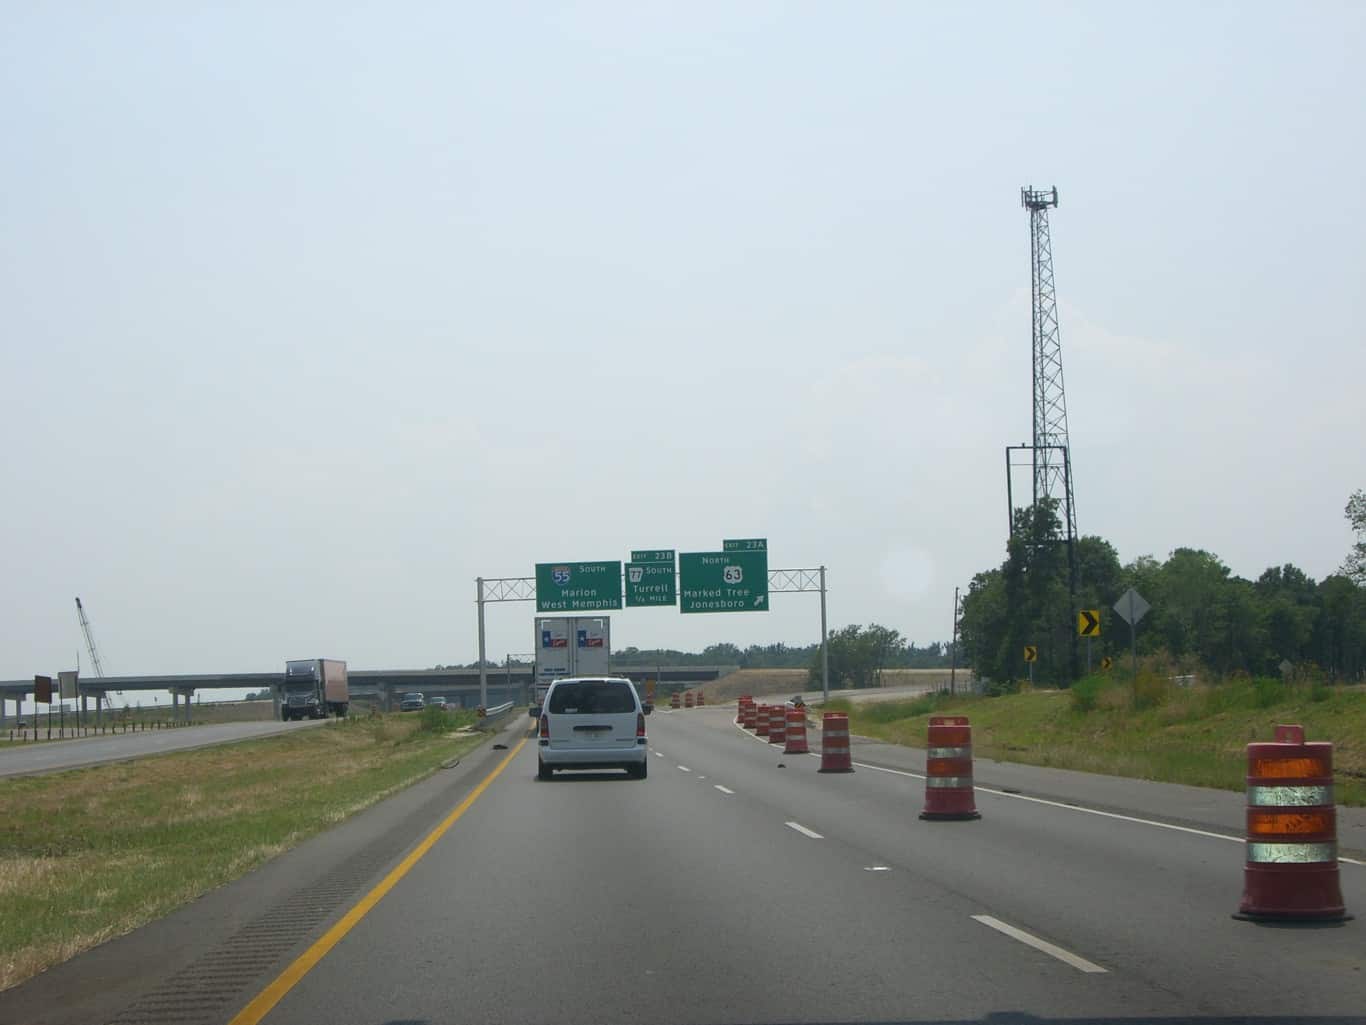
Source: lordsutch / Flickr
- Worst ranking category: Rural interstate pavement condition — category rank: 37
- Total disbursements per lane-mile: $35,367 — 9th lowest
- Percent urban interstate mileage in poor condition: 5.13% — category rank: 35
- Percent rural interstate mileage in poor condition: 2.65% — category rank: 37
- Percent structurally deficient bridges: 5.25% — category rank: 20
- State-control highway miles: 38,078 — 16th highest
New Hampshire — overall rank: 14

Source: Ultima_Gaina / iStock via Getty Images
- Worst ranking category: Admin disbursements ratio — category rank: 45
- Total disbursements per lane-mile: $70,952 — 22nd lowest
- Percent urban interstate mileage in poor condition: 0.16% — category rank: 1
- Percent rural interstate mileage in poor condition: 0.35% — category rank: 6
- Percent structurally deficient bridges: 7.68% — category rank: 34
- State-control highway miles: 8,453 — 4th lowest
Alabama — overall rank: 15
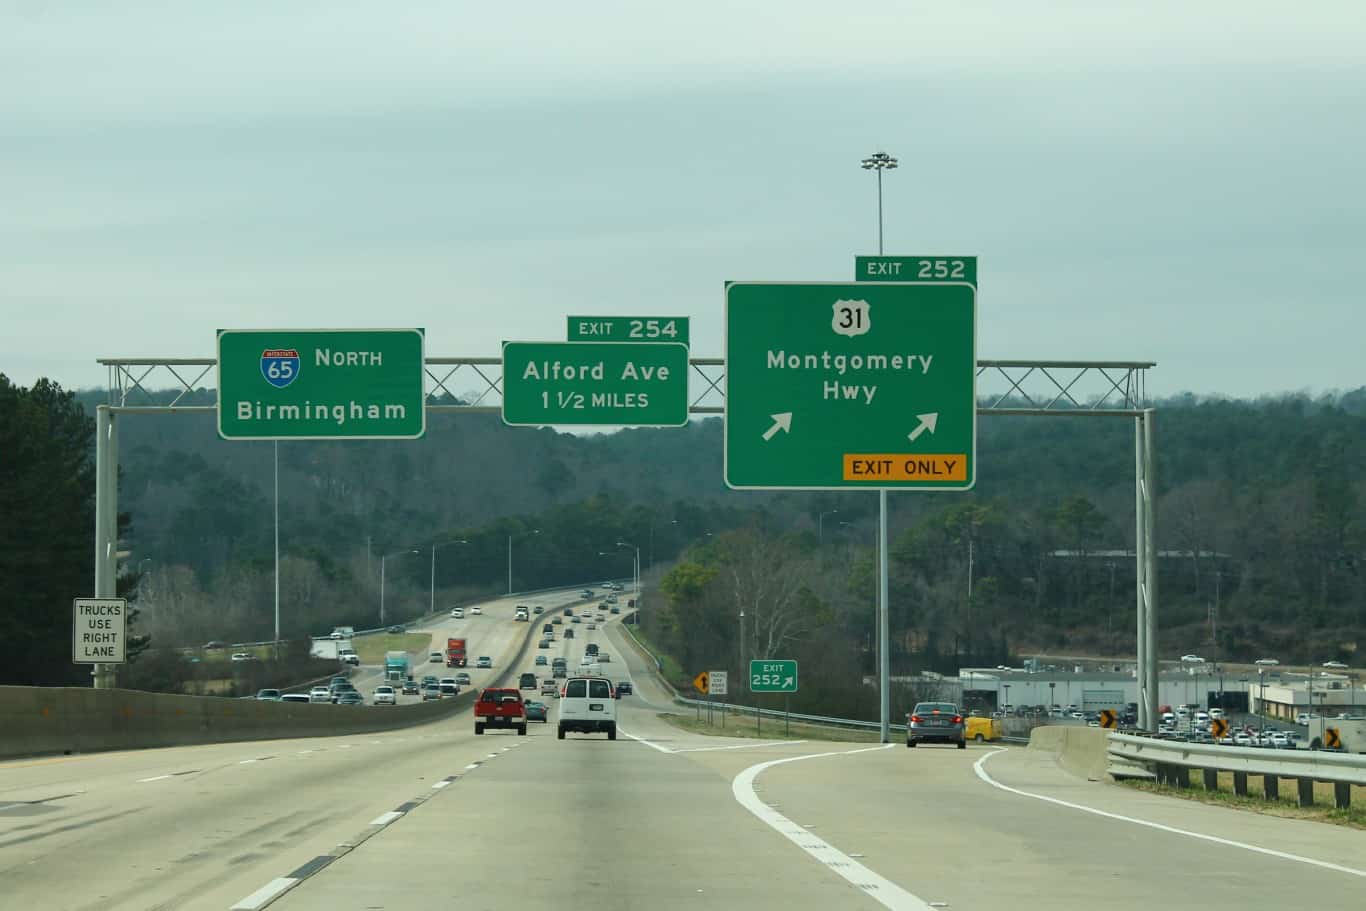
Source: formulanone / Flickr
- Worst ranking category: Admin disbursements ratio — category rank: 42
- Total disbursements per lane-mile: $73,783 — 23rd lowest
- Percent urban interstate mileage in poor condition: 5.16% — category rank: 36
- Percent rural interstate mileage in poor condition: 1.49% — category rank: 28
- Percent structurally deficient bridges: 3.63% — category rank: 9
- State-control highway miles: 29,707 — 20th highest
Wyoming — overall rank: 16
Source: Willowpix / iStock via Getty Images
- Worst ranking category: Urban fatality rate — category rank: 44
- Total disbursements per lane-mile: $35,737 — 10th lowest
- Percent urban interstate mileage in poor condition: 6.70% — category rank: 41
- Percent rural interstate mileage in poor condition: 1.58% — category rank: 31
- Percent structurally deficient bridges: 7.39% — category rank: 32
- State-control highway miles: 15,792 — 13th lowest
Ohio — overall rank: 17
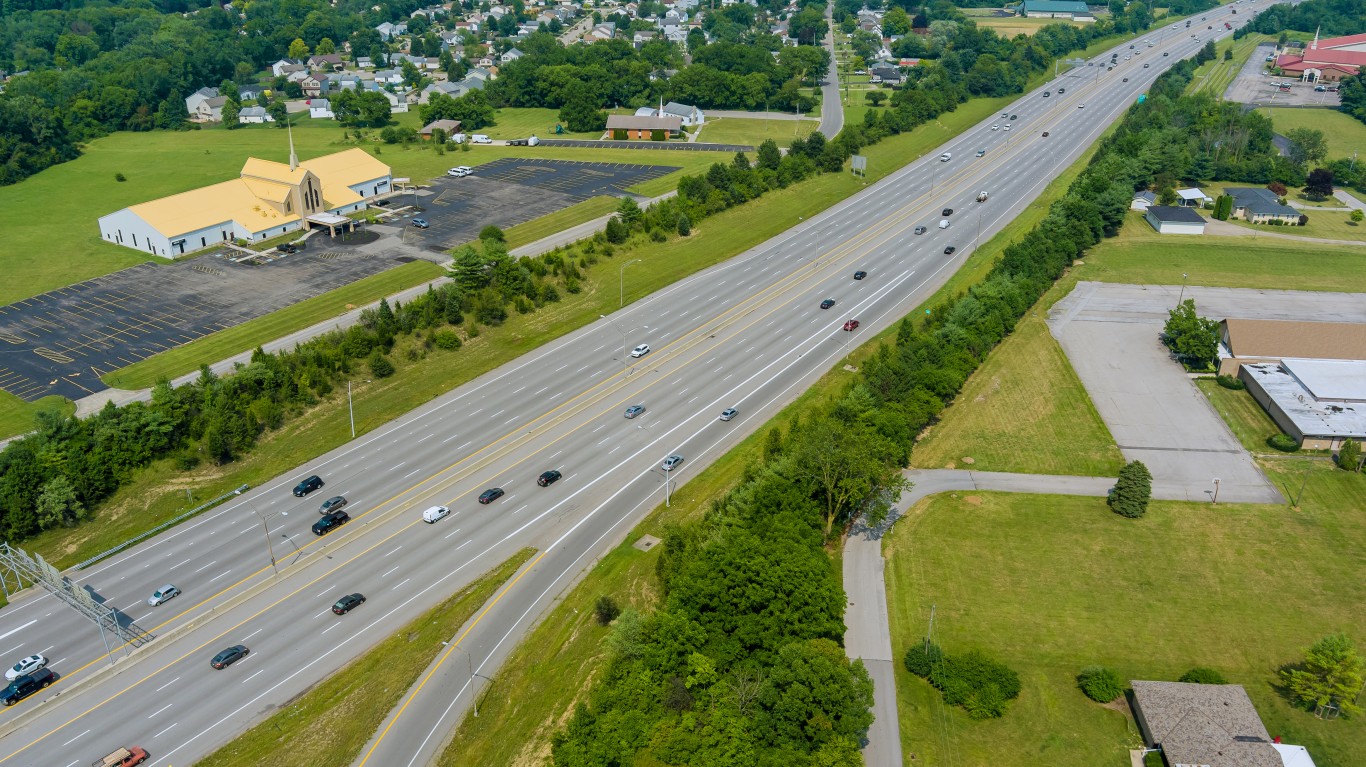
Source: photovs / iStock via Getty Images
- Worst ranking category: Urban other principal arterial pavement condition — category rank: 39
- Total disbursements per lane-mile: $80,329 — 25th highest
- Percent urban interstate mileage in poor condition: 4.56% — category rank: 32
- Percent rural interstate mileage in poor condition: 2.17% — category rank: 33
- Percent structurally deficient bridges: 4.91% — category rank: 16
- State-control highway miles: 49,681 — 10th highest
Mississippi — overall rank: 18
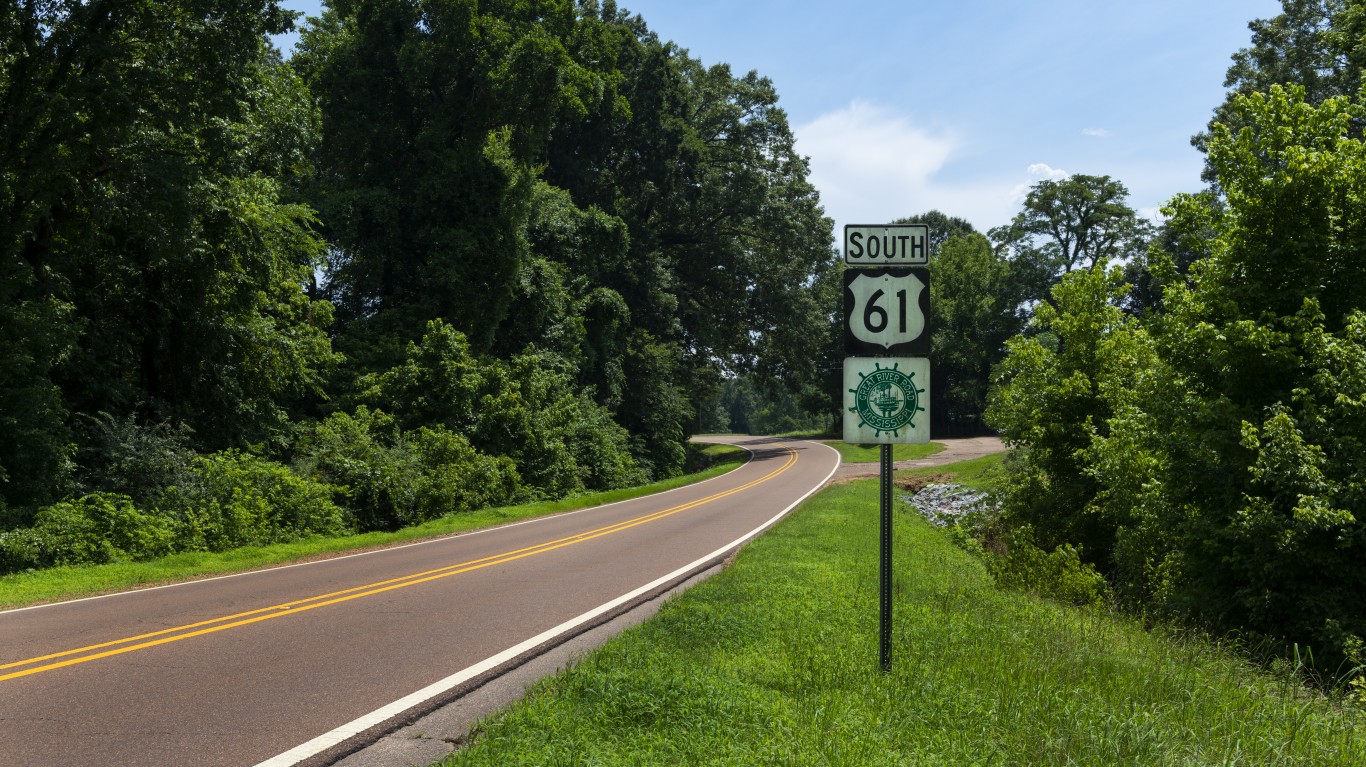
Source: Tiago_Fernandez / iStock via Getty Images
- Worst ranking category: Other fatality rate — category rank: 49
- Total disbursements per lane-mile: $36,425 — 13th lowest
- Percent urban interstate mileage in poor condition: 3.13% — category rank: 26
- Percent rural interstate mileage in poor condition: 1.49% — category rank: 29
- Percent structurally deficient bridges: 6.99% — category rank: 29
- State-control highway miles: 28,310 — 24th highest
Texas — overall rank: 19

Source: Sean Pavone / iStock via Getty Images
- Worst ranking category: Urbanized area congestion — category rank: 47
- Total disbursements per lane-mile: $74,921 — 24th lowest
- Percent urban interstate mileage in poor condition: 3.97% — category rank: 30
- Percent rural interstate mileage in poor condition: 1.24% — category rank: 22
- Percent structurally deficient bridges: 1.43% — category rank: 3
- State-control highway miles: 198,465 — the highest
Massachusetts — overall rank: 20
Source: raksyBH / iStock Editorial via Getty Images
- Worst ranking category: Urbanized area congestion — category rank: 48
- Total disbursements per lane-mile: $346,370 — 3rd highest
- Percent urban interstate mileage in poor condition: 2.99% — category rank: 23
- Percent rural interstate mileage in poor condition: 1.04% — category rank: 20
- Percent structurally deficient bridges: 8.69% — category rank: 37
- State-control highway miles: 9,556 — 6th lowest
Nevada — overall rank: 21

Source: zhudifeng / iStock via Getty Images
- Worst ranking category: Rural fatality rate — category rank: 48
- Total disbursements per lane-mile: $90,024 — 20th highest
- Percent urban interstate mileage in poor condition: 2.48% — category rank: 17
- Percent rural interstate mileage in poor condition: 0.18% — category rank: 2
- Percent structurally deficient bridges: 1.40% — category rank: 2
- State-control highway miles: 13,509 — 11th lowest
Kansas — overall rank: 22
Source: peeterv / iStock via Getty Images
- Worst ranking category: Other disbursements ratio — category rank: 48
- Total disbursements per lane-mile: $50,211 — 18th lowest
- Percent urban interstate mileage in poor condition: 3.08% — category rank: 25
- Percent rural interstate mileage in poor condition: 0.74% — category rank: 14
- Percent structurally deficient bridges: 5.12% — category rank: 17
- State-control highway miles: 24,037 — 24th lowest
Indiana — overall rank: 23
Source: befuddledsenses / Flickr
- Worst ranking category: Maintenance disbursements ratio — category rank: 48
- Total disbursements per lane-mile: $95,146 — 18th highest
- Percent urban interstate mileage in poor condition: 4.24% — category rank: 31
- Percent rural interstate mileage in poor condition: 2.76% — category rank: 39
- Percent structurally deficient bridges: 5.60% — category rank: 24
- State-control highway miles: 28,445 — 23rd highest
Maryland — overall rank: 24
Source: floridastock / iStock via Getty Images
- Worst ranking category: Urban interstate pavement condition — category rank: 42
- Total disbursements per lane-mile: $213,604 — 6th highest
- Percent urban interstate mileage in poor condition: 6.94% — category rank: 42
- Percent rural interstate mileage in poor condition: 1.24% — category rank: 23
- Percent structurally deficient bridges: 4.65% — category rank: 14
- State-control highway miles: 14,928 — 12th lowest
Montana — overall rank: 25

Source: YinYang / iStock via Getty Images
- Worst ranking category: Rural fatality rate — category rank: 47
- Total disbursements per lane-mile: $31,102 — 6th lowest
- Percent urban interstate mileage in poor condition: 1.74% — category rank: 13
- Percent rural interstate mileage in poor condition: 1.32% — category rank: 25
- Percent structurally deficient bridges: 6.93% — category rank: 28
- State-control highway miles: 25,211 — 25th lowest
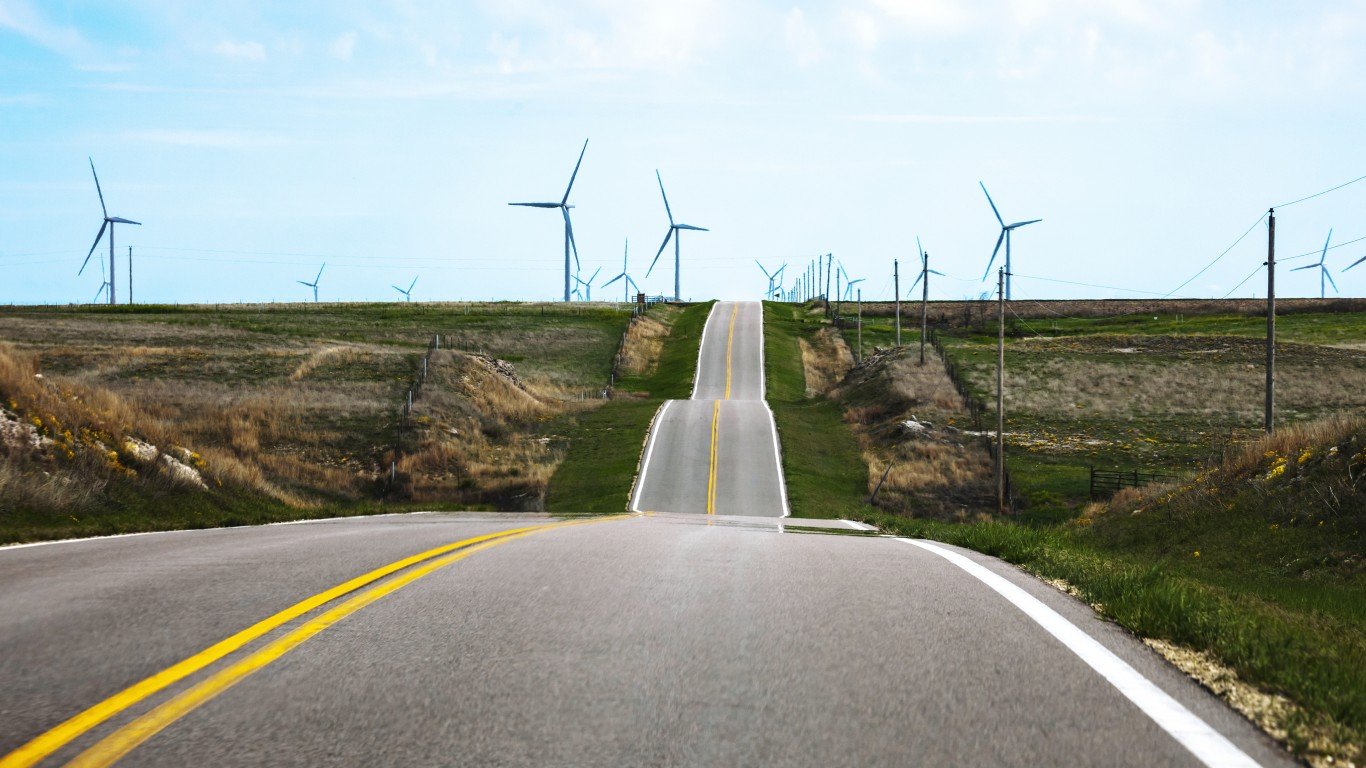
Nebraska — overall rank: 26
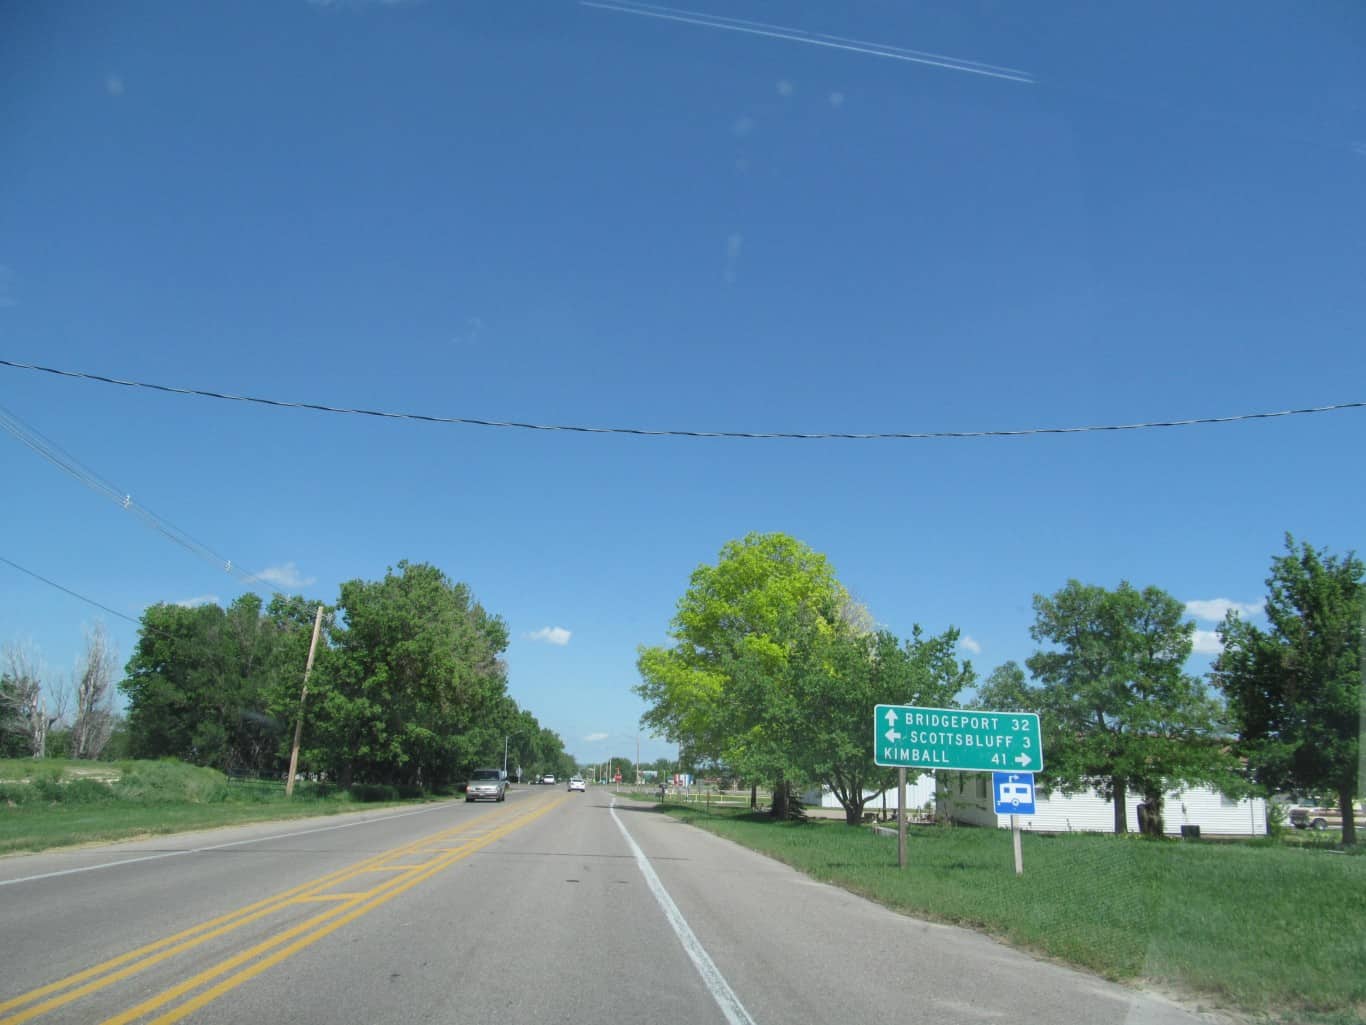
Source: dougtone / Flickr
- Worst ranking category: Urban other principal arterial pavement condition — category rank: 48
- Total disbursements per lane-mile: $36,202 — 12th lowest
- Percent urban interstate mileage in poor condition: 3.85% — category rank: 29
- Percent rural interstate mileage in poor condition: 0.62% — category rank: 10
- Percent structurally deficient bridges: 8.34% — category rank: 36
- State-control highway miles: 22,541 — 21st lowest
Michigan — overall rank: 27
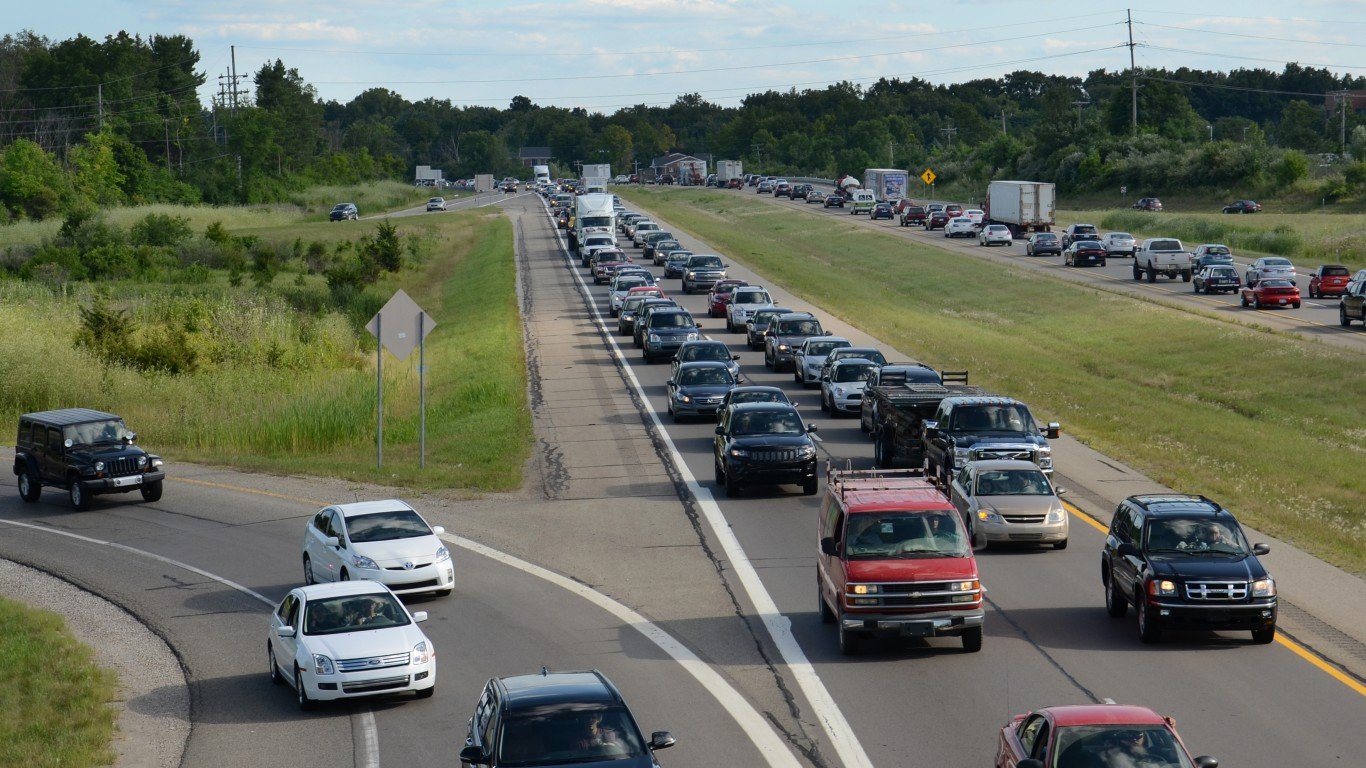
Source: smontgom65 / iStock Editorial via Getty Images
- Worst ranking category: Urban interstate pavement condition — category rank: 43
- Total disbursements per lane-mile: $92,566 — 19th highest
- Percent urban interstate mileage in poor condition: 7.79% — category rank: 43
- Percent rural interstate mileage in poor condition: 3.00% — category rank: 41
- Percent structurally deficient bridges: 10.99% — category rank: 42
- State-control highway miles: 27,366 — 25th highest
South Dakota — overall rank: 28
Source: YinYang / E+ via Getty Images
- Worst ranking category: Structurally deficient bridges — category rank: 47
- Total disbursements per lane-mile: $27,628 — 4th lowest
- Percent urban interstate mileage in poor condition: 1.14% — category rank: 4
- Percent rural interstate mileage in poor condition: 0.44% — category rank: 8
- Percent structurally deficient bridges: 17.30% — category rank: 47
- State-control highway miles: 17,955 — 17th lowest
Illinois — overall rank: 29
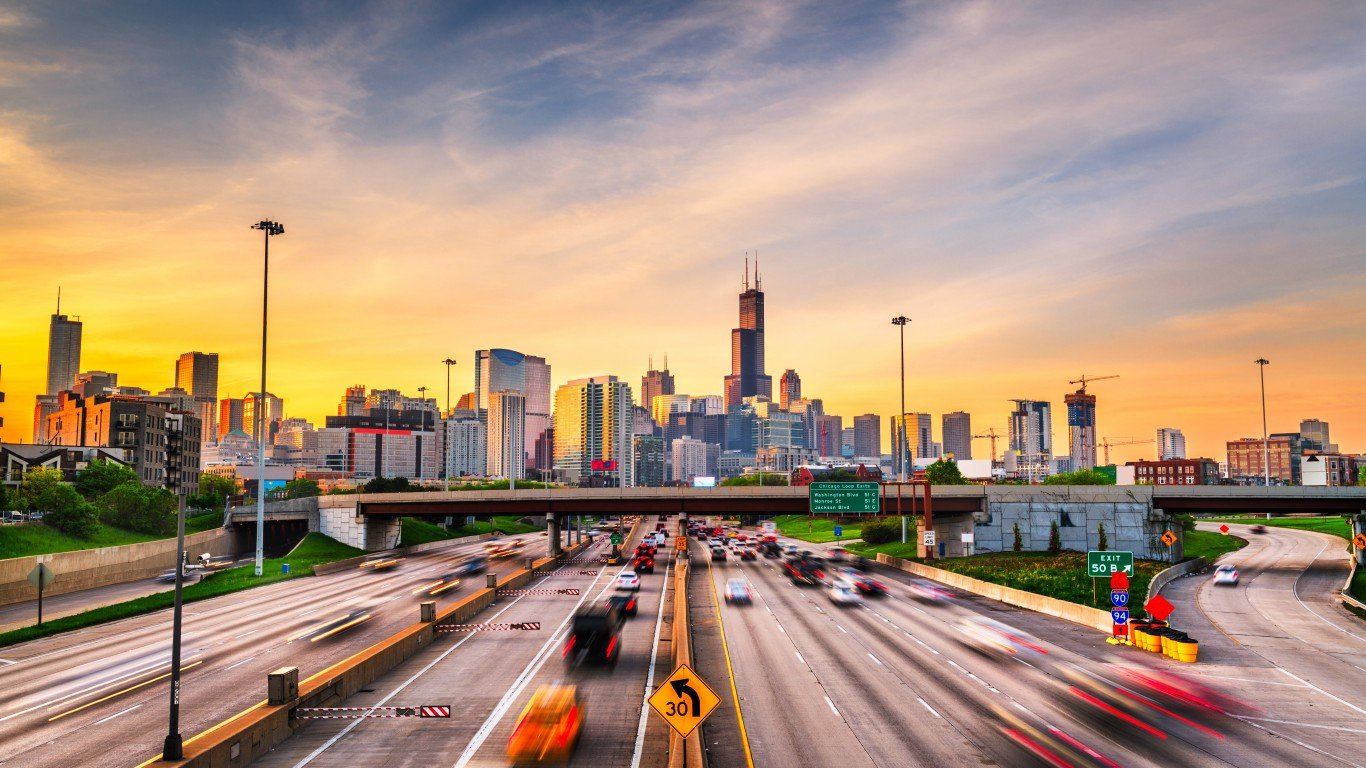
Source: Sean Pavone / iStock via Getty Images
- Worst ranking category: Urbanized area congestion — category rank: 45
- Total disbursements per lane-mile: $123,480 — 12th highest
- Percent urban interstate mileage in poor condition: 4.82% — category rank: 34
- Percent rural interstate mileage in poor condition: 1.34% — category rank: 26
- Percent structurally deficient bridges: 8.96% — category rank: 38
- State-control highway miles: 42,169 — 13th highest
Arizona — overall rank: 30
Source: aresauburnphotos / Flickr
- Worst ranking category: Urban fatality rate — category rank: 48
- Total disbursements per lane-mile: $107,607 — 14th highest
- Percent urban interstate mileage in poor condition: 2.13% — category rank: 14
- Percent rural interstate mileage in poor condition: 2.22% — category rank: 34
- Percent structurally deficient bridges: 1.38% — category rank: 1
- State-control highway miles: 20,046 — 20th lowest
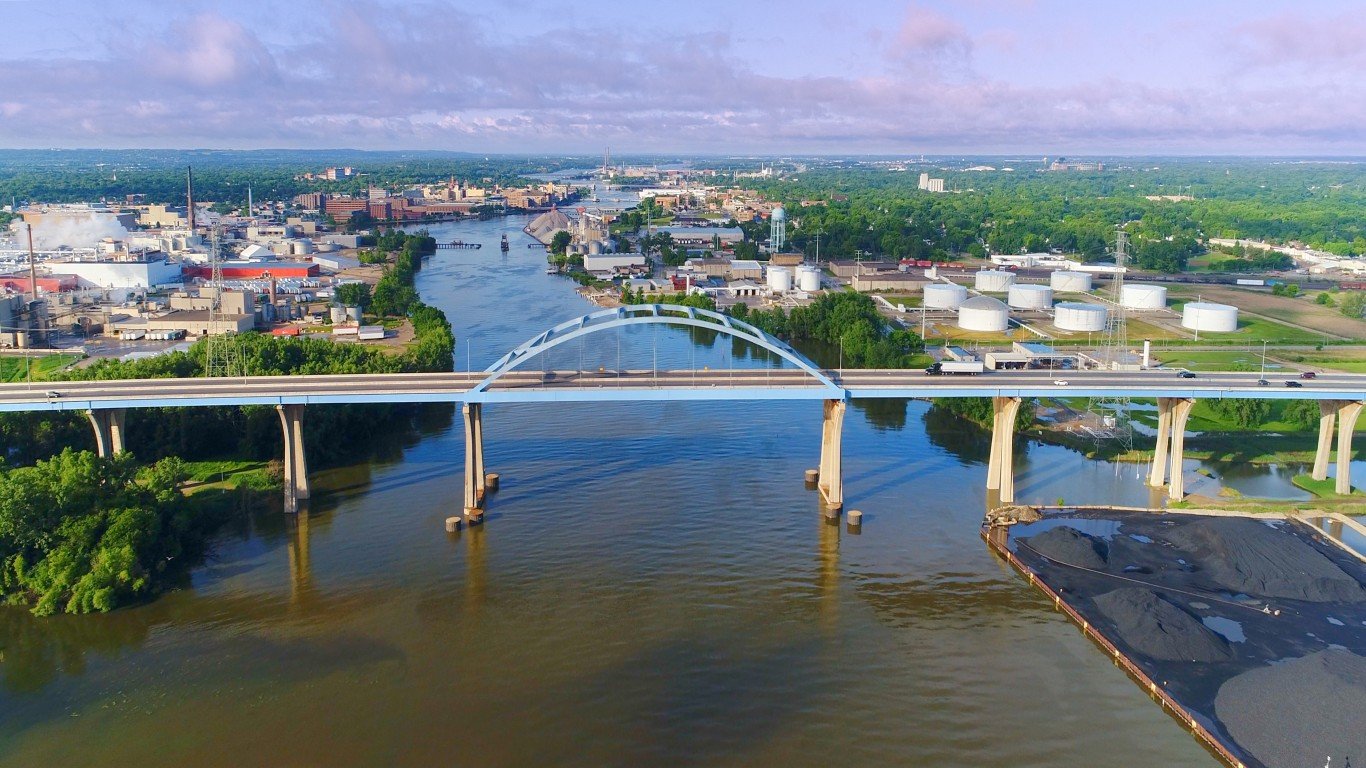
Iowa — overall rank: 31
Source: Maksymowicz / iStock via Getty Images
- Worst ranking category: Structurally deficient bridges — category rank: 49
- Total disbursements per lane-mile: $63,391 — 19th lowest
- Percent urban interstate mileage in poor condition: 4.72% — category rank: 33
- Percent rural interstate mileage in poor condition: 1.55% — category rank: 30
- Percent structurally deficient bridges: 18.87% — category rank: 49
- State-control highway miles: 22,918 — 22nd lowest
Maine — overall rank: 32
Source: zhudifeng / iStock via Getty Images
- Worst ranking category: Rural other principal arterial pavement condition — category rank: 47
- Total disbursements per lane-mile: $49,234 — 17th lowest
- Percent urban interstate mileage in poor condition: 1.43% — category rank: 7
- Percent rural interstate mileage in poor condition: 1.39% — category rank: 27
- Percent structurally deficient bridges: 12.64% — category rank: 44
- State-control highway miles: 17,467 — 16th lowest
Wisconsin — overall rank: 33
Source: JamesBrey / iStock via Getty Images
- Worst ranking category: Urban other principal arterial pavement condition — category rank: 43
- Total disbursements per lane-mile: $85,189 — 22nd highest
- Percent urban interstate mileage in poor condition: 5.23% — category rank: 37
- Percent rural interstate mileage in poor condition: 2.63% — category rank: 36
- Percent structurally deficient bridges: 6.90% — category rank: 27
- State-control highway miles: 29,806 — 19th highest
Idaho — overall rank: 34

Source: ChrisBoswell / iStock via Getty Images
- Worst ranking category: Capital & bridge disbursements ratio — category rank: 48
- Total disbursements per lane-mile: $68,714 — 21st lowest
- Percent urban interstate mileage in poor condition: 1.66% — category rank: 11
- Percent rural interstate mileage in poor condition: 2.08% — category rank: 32
- Percent structurally deficient bridges: 5.22% — category rank: 19
- State-control highway miles: 12,272 — 10th lowest
Delaware — overall rank: 35
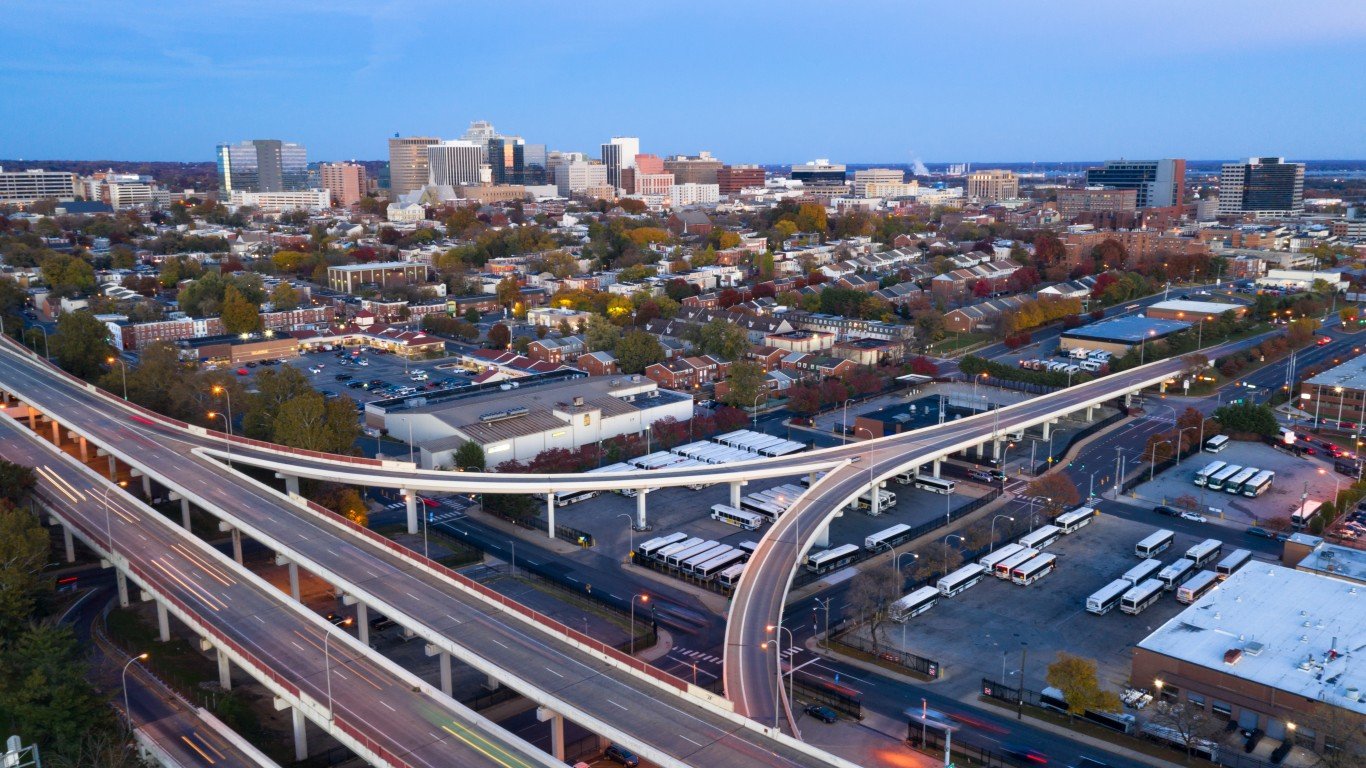
Source: ChrisBoswell / iStock via Getty Images
- Worst ranking category: Admin disbursements ratio — category rank: 49
- Total disbursements per lane-mile: $148,392 — 11th highest
- Percent urban interstate mileage in poor condition: 8.67% — category rank: 44
- Percent rural interstate mileage in poor condition: N/A
- Percent structurally deficient bridges: 1.94% — category rank: 4
- State-control highway miles: 11,998 — 9th lowest
New Mexico — overall rank: 36
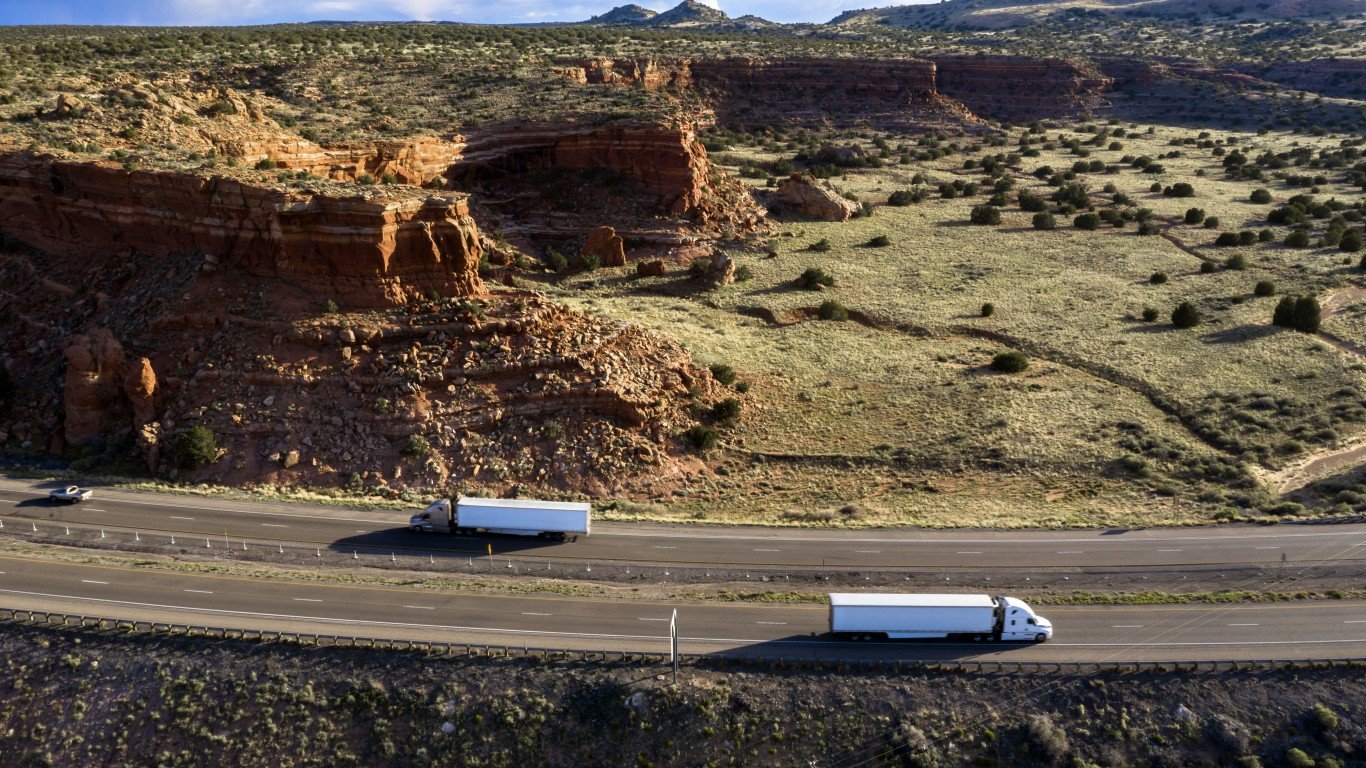
Source: Bim / E+ via Getty Images
- Worst ranking category: Urban fatality rate — category rank: 50
- Total disbursements per lane-mile: $33,130 — 7th lowest
- Percent urban interstate mileage in poor condition: 3.57% — category rank: 28
- Percent rural interstate mileage in poor condition: 2.81% — category rank: 40
- Percent structurally deficient bridges: 5.17% — category rank: 18
- State-control highway miles: 29,430 — 21st highest
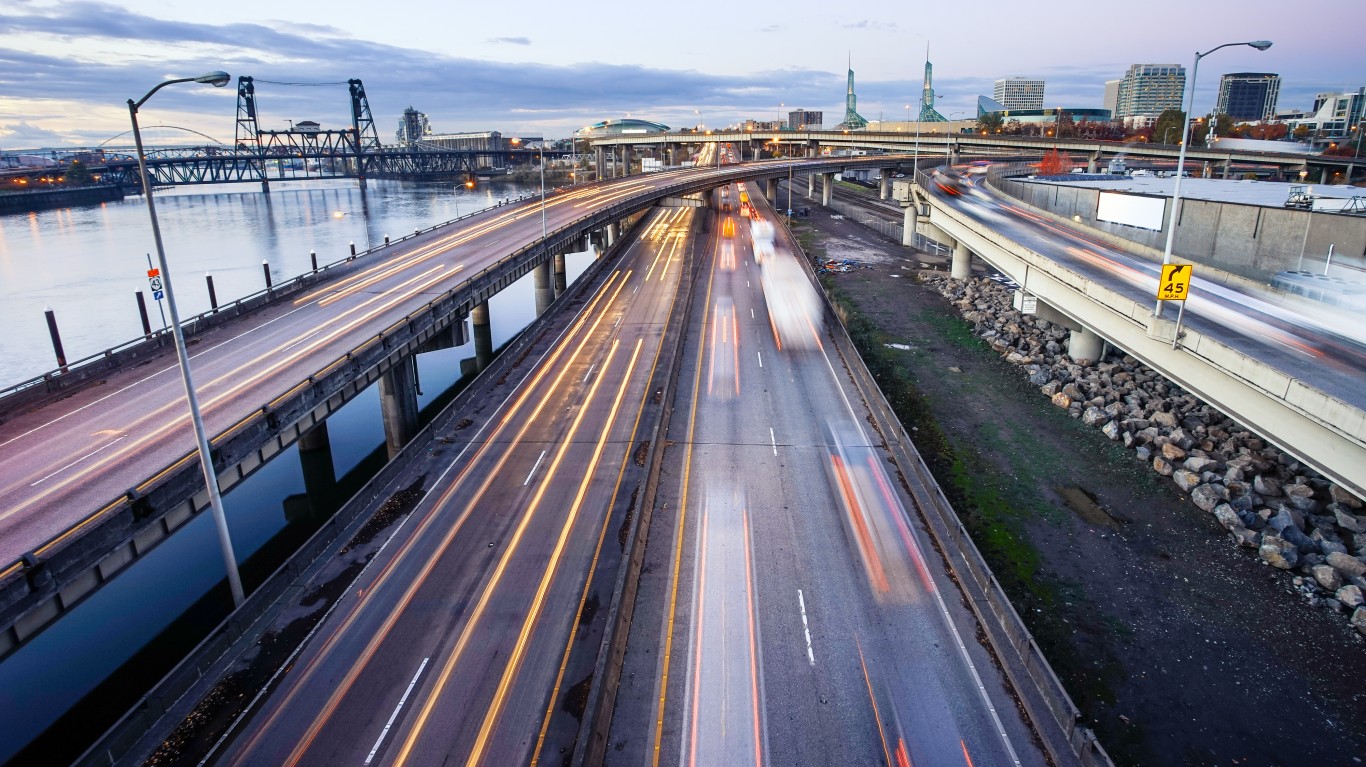
Oregon — overall rank: 37

Source: SquatchPhotography / iStock via Getty Images
- Worst ranking category: Other disbursements ratio — category rank: 49
- Total disbursements per lane-mile: $108,401 — 13th highest
- Percent urban interstate mileage in poor condition: 2.88% — category rank: 21
- Percent rural interstate mileage in poor condition: 0.66% — category rank: 11
- Percent structurally deficient bridges: 4.64% — category rank: 13
- State-control highway miles: 18,460 — 18th lowest
Vermont — overall rank: 38
Source: ImagineGolf / E+ via Getty Images
- Worst ranking category: Admin disbursements ratio — category rank: 50
- Total disbursements per lane-mile: $78,884 — 25th lowest
- Percent urban interstate mileage in poor condition: 1.37% — category rank: 6
- Percent rural interstate mileage in poor condition: 1.14% — category rank: 21
- Percent structurally deficient bridges: 2.40% — category rank: 7
- State-control highway miles: 5,998 — 3rd lowest
West Virginia — overall rank: 39
Source: krblokhin / iStock via Getty Images
- Worst ranking category: Structurally deficient bridges — category rank: 50
- Total disbursements per lane-mile: $20,882 — the lowest
- Percent urban interstate mileage in poor condition: 8.99% — category rank: 45
- Percent rural interstate mileage in poor condition: 3.44% — category rank: 44
- Percent structurally deficient bridges: 20.37% — category rank: 50
- State-control highway miles: 71,054 — 7th highest
Louisiana — overall rank: 40
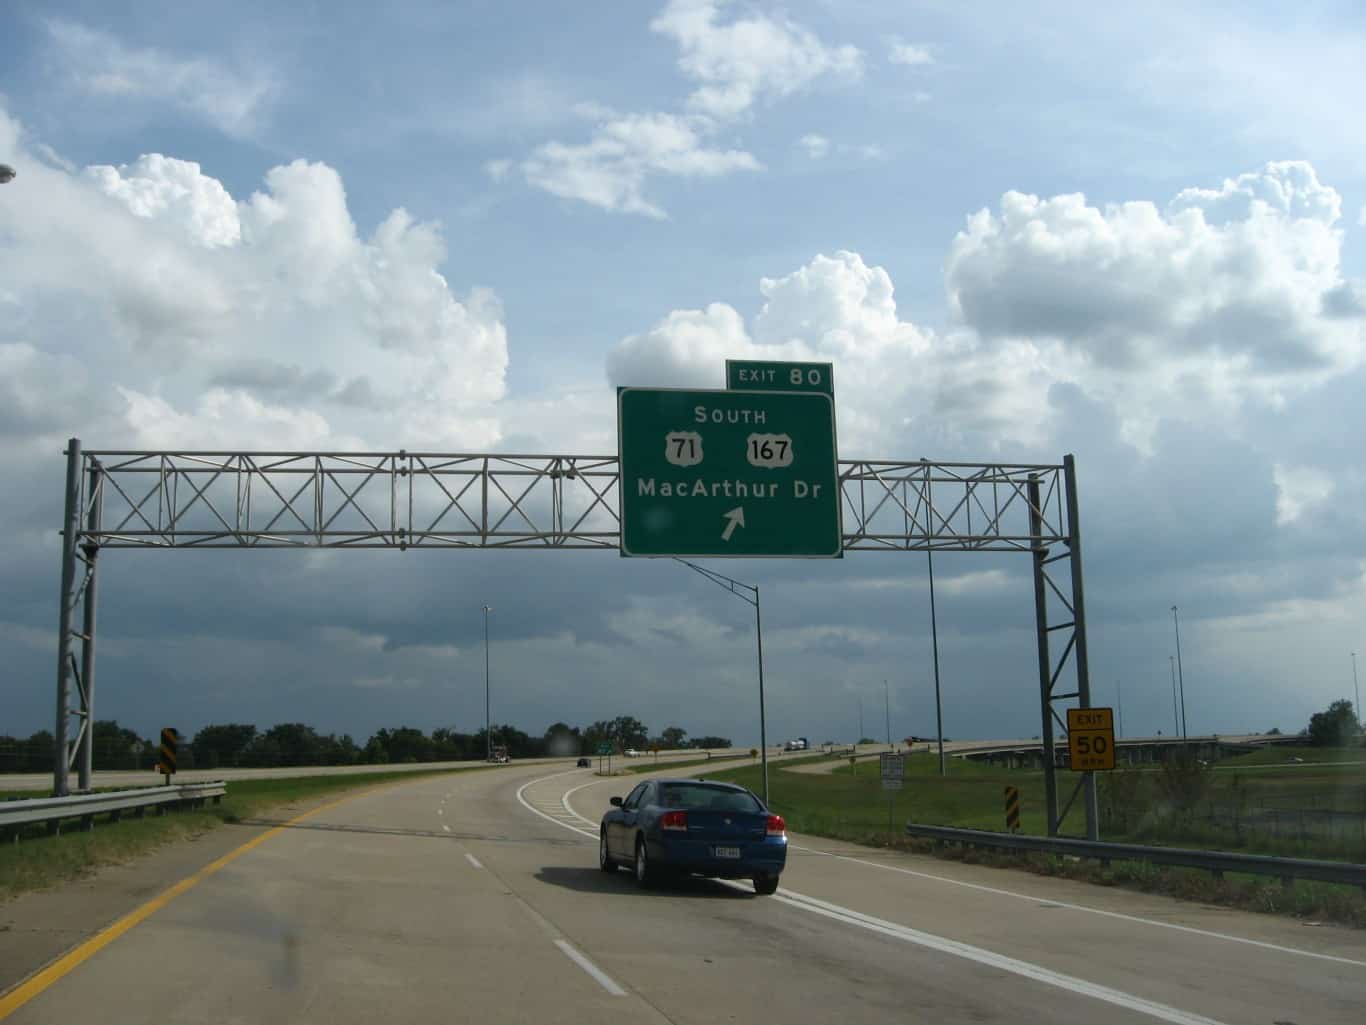
Source: kenlund / Flickr
- Worst ranking category: Urban interstate pavement condition — category rank: 49
- Total disbursements per lane-mile: $40,641 — 14th lowest
- Percent urban interstate mileage in poor condition: 11.99% — category rank: 49
- Percent rural interstate mileage in poor condition: 3.07% — category rank: 43
- Percent structurally deficient bridges: 12.76% — category rank: 45
- State-control highway miles: 40,154 — 14th highest
Pennsylvania — overall rank: 41
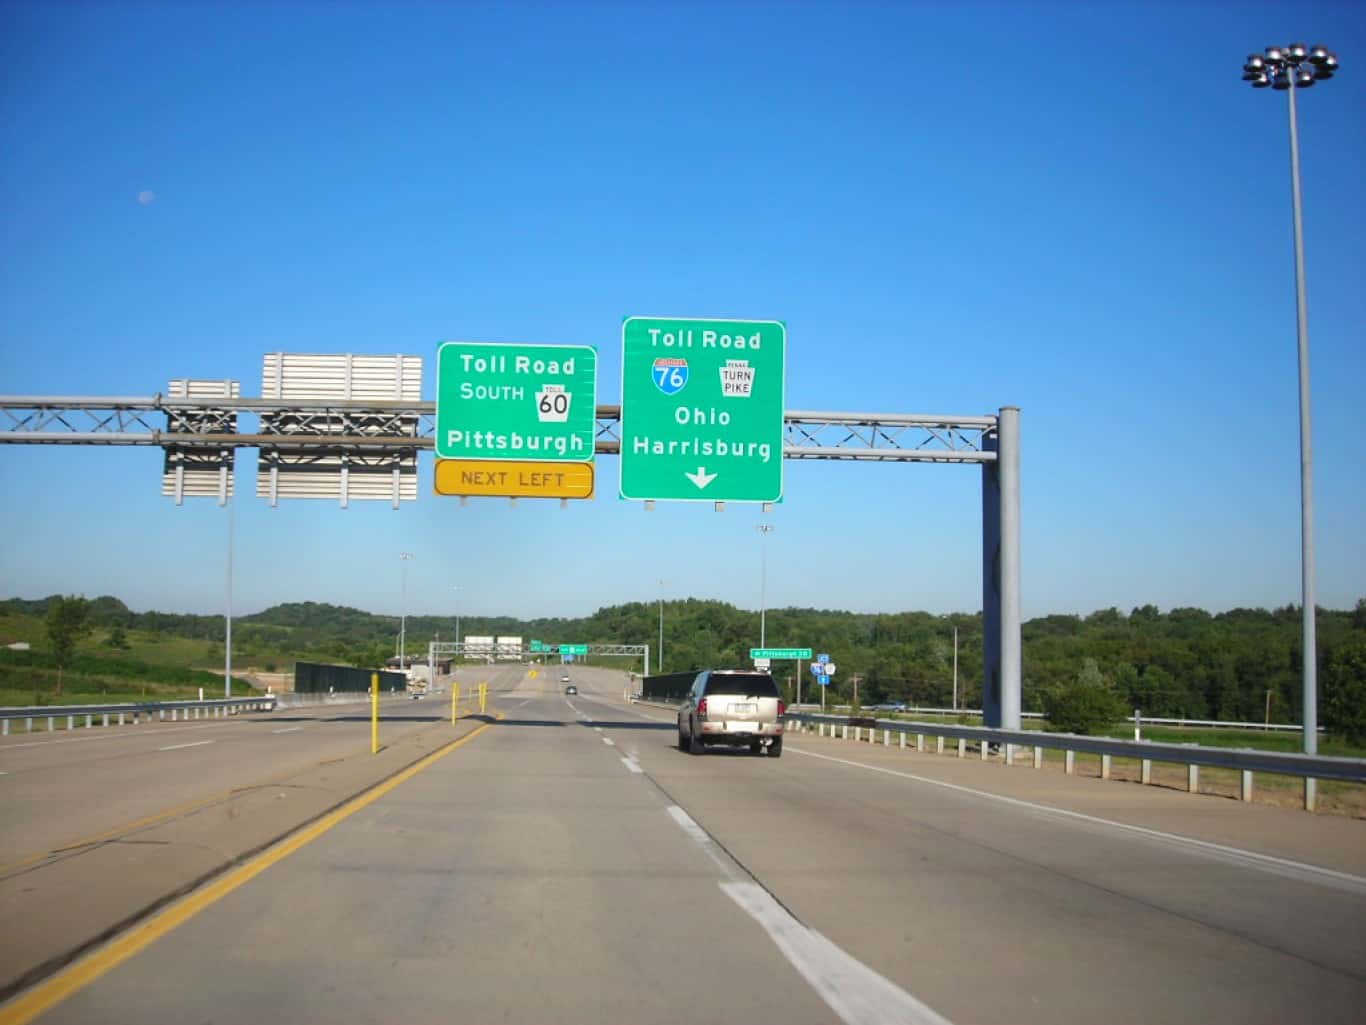
Source: dougtone / Flickr
- Worst ranking category: Structurally deficient bridges — category rank: 46
- Total disbursements per lane-mile: $102,258 — 16th highest
- Percent urban interstate mileage in poor condition: 6.13% — category rank: 39
- Percent rural interstate mileage in poor condition: 3.03% — category rank: 42
- Percent structurally deficient bridges: 13.80% — category rank: 46
- State-control highway miles: 88,322 — 5th highest
Rhode Island — overall rank: 42
Source: dougtone / Flickr
- Worst ranking category: Rural other principal arterial pavement condition — category rank: 49
- Total disbursements per lane-mile: $220,035 — 5th highest
- Percent urban interstate mileage in poor condition: 2.49% — category rank: 18
- Percent rural interstate mileage in poor condition: 0.27% — category rank: 3
- Percent structurally deficient bridges: 17.46% — category rank: 48
- State-control highway miles: 2,870 — 2nd lowest
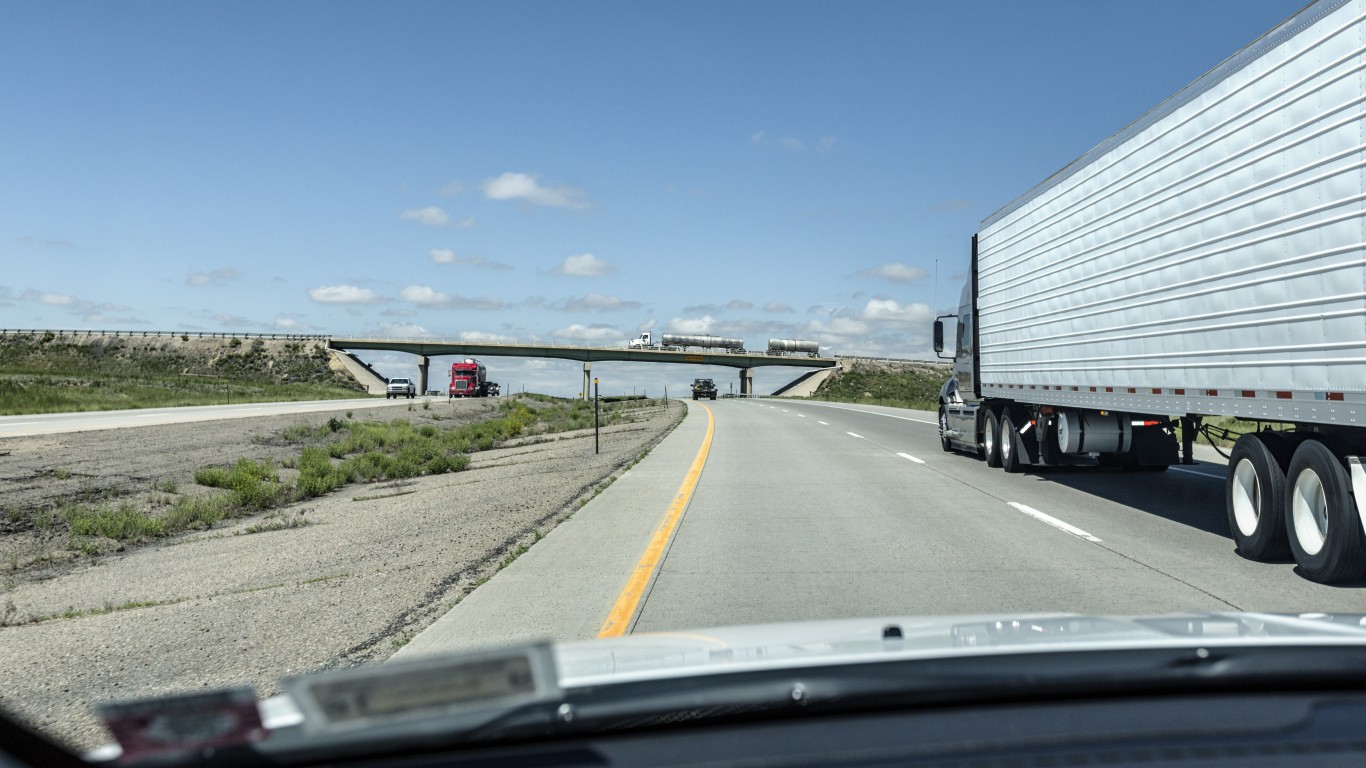
Colorado — overall rank: 43
Source: Spencer Platt / Getty Images News via Getty Images
- Worst ranking category: Rural interstate pavement condition — category rank: 47
- Total disbursements per lane-mile: $84,343 — 23rd highest
- Percent urban interstate mileage in poor condition: 6.64% — category rank: 40
- Percent rural interstate mileage in poor condition: 8.32% — category rank: 47
- Percent structurally deficient bridges: 5.29% — category rank: 21
- State-control highway miles: 23,022 — 23rd lowest
New Jersey — overall rank: 44
Source: georgeolsson / E+ via Getty Images
- Worst ranking category: Urbanized area congestion — category rank: 50
- Total disbursements per lane-mile: $1,137,815 — the highest
- Percent urban interstate mileage in poor condition: 9.32% — category rank: 46
- Percent rural interstate mileage in poor condition: 1.29% — category rank: 24
- Percent structurally deficient bridges: 7.09% — category rank: 31
- State-control highway miles: 8,551 — 5th lowest
Oklahoma — overall rank: 45
Source: Meindert van der Haven / iStock via Getty Images
- Worst ranking category: Maintenance disbursements ratio — category rank: 45
- Total disbursements per lane-mile: $88,624 — 21st highest
- Percent urban interstate mileage in poor condition: 5.42% — category rank: 38
- Percent rural interstate mileage in poor condition: 2.36% — category rank: 35
- Percent structurally deficient bridges: 9.89% — category rank: 41
- State-control highway miles: 30,407 — 18th highest
Washington — overall rank: 46
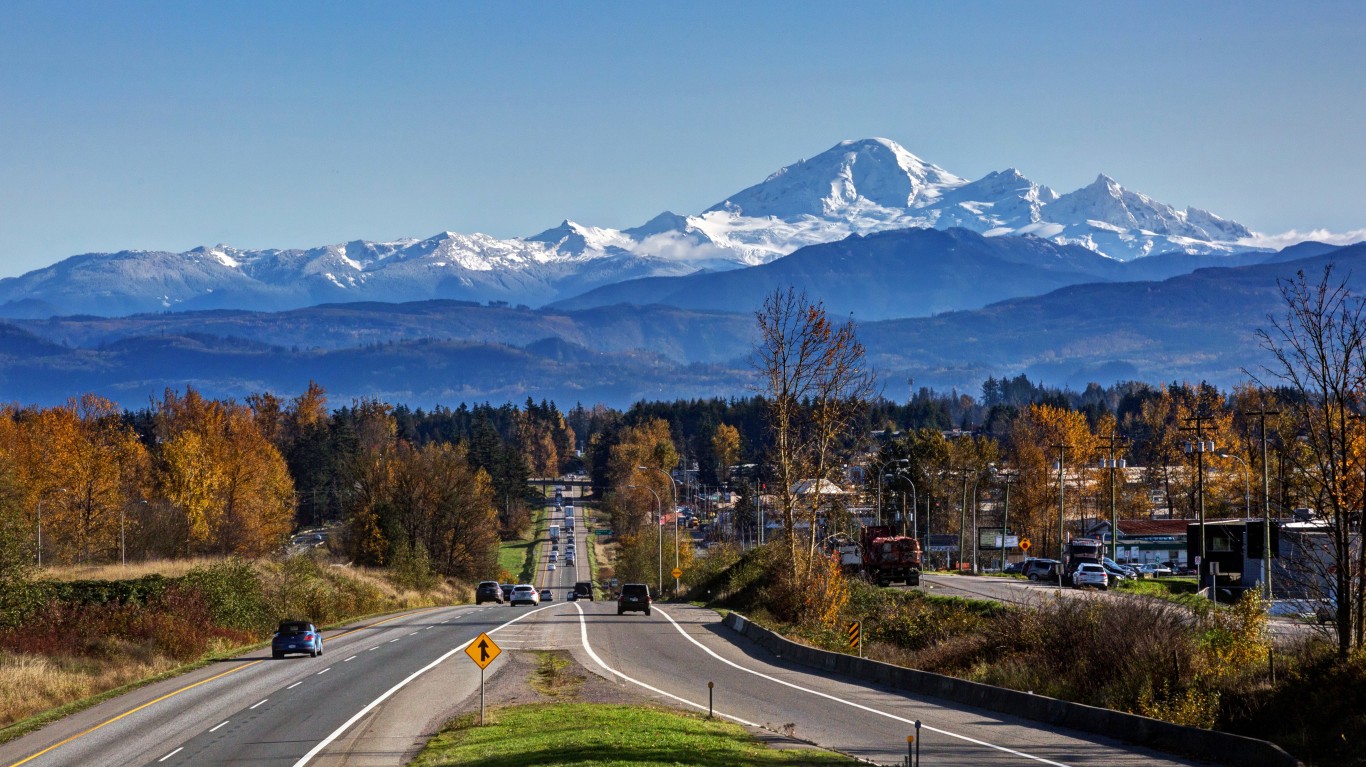
Source: jamesvancouver / iStock via Getty Images
- Worst ranking category: Capital & bridge dibursments ratio — category rank: 50
- Total disbursements per lane-mile: $202,793 — 9th highest
- Percent urban interstate mileage in poor condition: 2.92% — category rank: 22
- Percent rural interstate mileage in poor condition: 4.10% — category rank: 45
- Percent structurally deficient bridges: 4.80% — category rank: 15
- State-control highway miles: 18,450 — 19th lowest
California — overall rank: 47
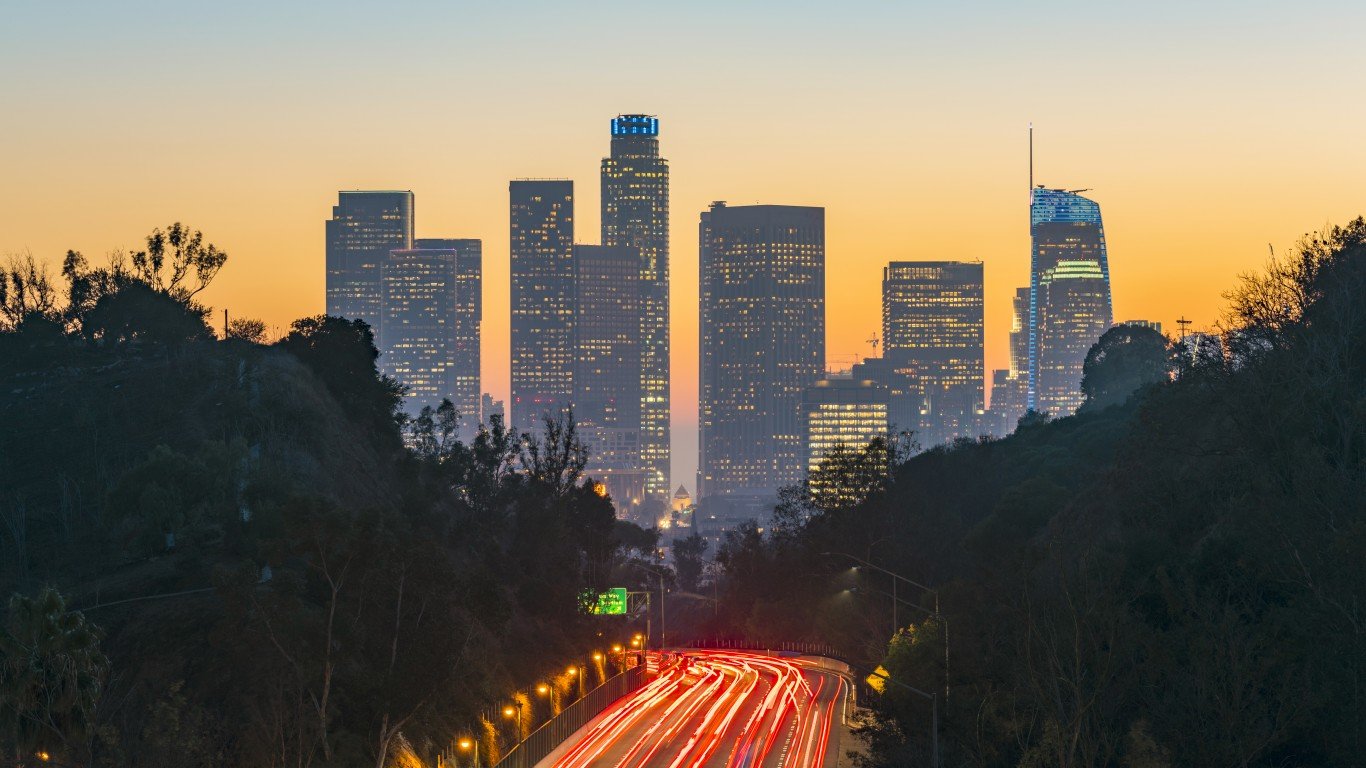
Source: 4kodiak / E+ via Getty Images
- Worst ranking category: Urban other principal arterial pavement condition — category rank: 50
- Total disbursements per lane-mile: $207,482 — 7th highest
- Percent urban interstate mileage in poor condition: 9.38% — category rank: 47
- Percent rural interstate mileage in poor condition: 4.52% — category rank: 46
- Percent structurally deficient bridges: 5.80% — category rank: 25
- State-control highway miles: 52,004 — 9th highest
Hawaii — overall rank: 48
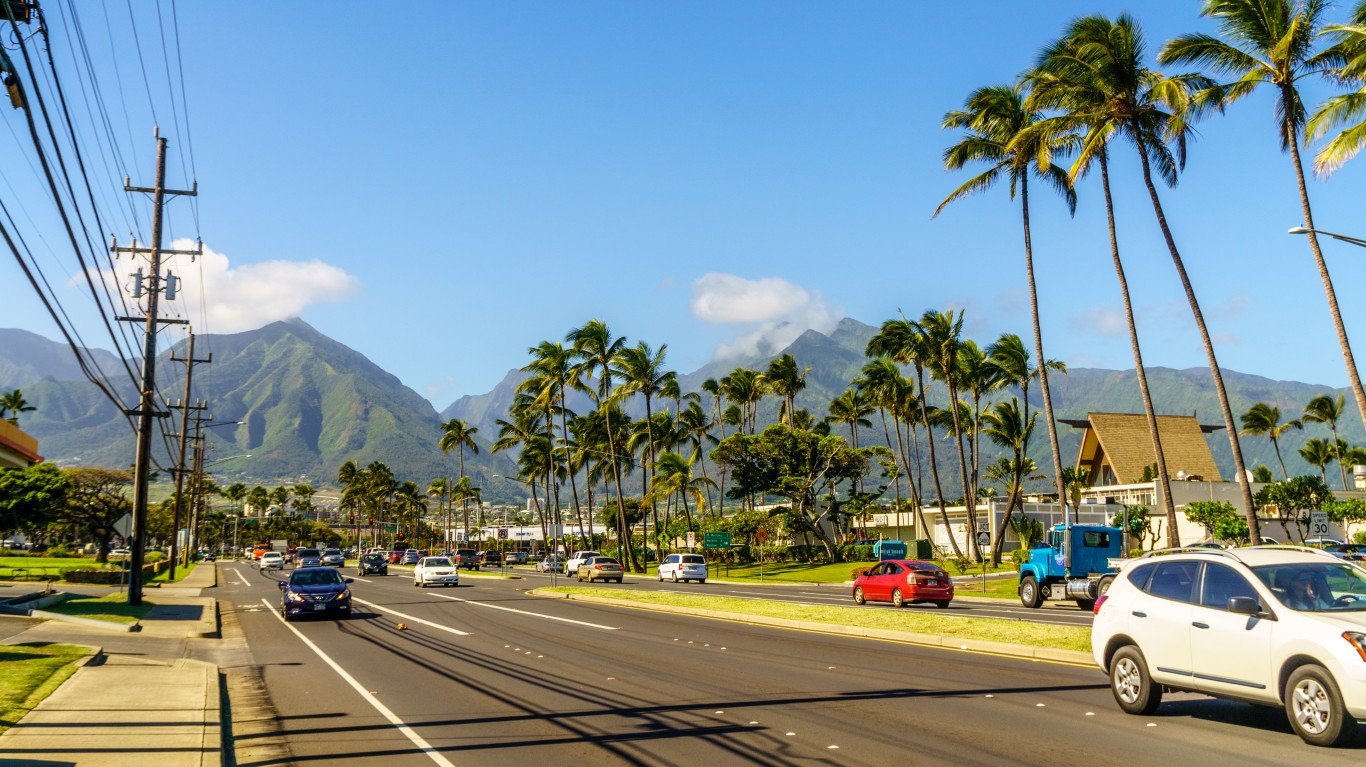
Source: tirc83 / iStock Unreleased via Getty Images
- Worst ranking category: Urban interstate pavement condition — category rank: 50
- Total disbursements per lane-mile: $155,395 — 10th highest
- Percent urban interstate mileage in poor condition: 25.88% — category rank: 50
- Percent rural interstate mileage in poor condition: N/A
- Percent structurally deficient bridges: 7.49% — category rank: 33
- State-control highway miles: 2,477 — the lowest
New York — overall rank: 49

Source: ChrisBoswell / Getty Images
- Worst ranking category: Other disbursements ratio — category rank: 50
- Total disbursements per lane-mile: $374,937 — 2nd highest
- Percent urban interstate mileage in poor condition: 9.39% — category rank: 48
- Percent rural interstate mileage in poor condition: 2.73% — category rank: 38
- Percent structurally deficient bridges: 9.52% — category rank: 40
- State-control highway miles: 38,157 — 15th highest
Alaska — overall rank: 50

Source: Bruce Wilson Photography / iStock via Getty Images
- Worst ranking category: Rural other principal arterial pavement condition — category rank: 50
- Total disbursements per lane-mile: $98,583 — 17th highest
- Percent urban interstate mileage in poor condition: 1.69% — category rank: 12
- Percent rural interstate mileage in poor condition: 9.63% — category rank: 48
- Percent structurally deficient bridges: 8.21% — category rank: 35
- State-control highway miles: 11,754 — 8th lowest
Sponsored: Attention Savvy Investors: Speak to 3 Financial Experts – FREE
Ever wanted an extra set of eyes on an investment you’re considering? Now you can speak with up to 3 financial experts in your area for FREE. By simply
clicking here you can begin to match with financial professionals who can help guide you through the financial decisions you’re making. And the best part? The first conversation with them is free.
Click here to match with up to 3 financial pros who would be excited to help you make financial decisions.
Thank you for reading! Have some feedback for us?
Contact the 24/7 Wall St. editorial team.
Editors' Picks