
By ETFGI
ETFGI, an independent research and consultancy firm covering trends in the global ETFs and ETPs ecosystem, reported record assets and net inflows in Active ETFs world-wide of US$400.77 billion and US$82.23 billion respectively at the end of H1 2021. Active ETFs and ETPs gathered net inflows of US$8.06 billion during June, bringing H1 net inflows to a record US$82.23 billion. Assets invested in Active ETFs and ETPs finished the month up to 12.0%, from US$358 billion at the end of May to US$401 billion, according to ETFGI’s June 2021 Active ETF and ETP industry landscape insights report, the monthly report which is part of an annual paid-for research subscription service. (All dollar values in USD unless otherwise noted.)
Highlights
- Record $400.77 Bn invested in actively managed ETFs and ETPs industry at end of H1 2021.
- Assets have increased 40.2% in H1 going from $285.83 Bn at end of 2020 to $400.77 Bn.
- Record H1 net inflows of $82.23 Bn beating prior record of $26.06 Bn gathered in H1 2020.
- $82.23 Bn H1 net inflows are just $8.97 Bn below full year 2020 record net inflows $91.20 Bn.
- $147.37 Bn in net inflows gathered in the past 12 months.
- 15th month of consecutive net inflows
- Actively managed Equity ETFs and ETPs gathered a record $37.59 Bn in net inflows in H1 2021.
“The S&P 500 gained 2.33% in June and are up 15.25% in the first half of 2021. Developed markets ex-U.S. lost 0.82% in June but are up 9.96% in the first half. Emerging markets are up 0.47% in June and are up 9.03% in the first half,” according to Deborah Fuhr, managing partner, founder and owner of ETFGI.
Growth in Actively Managed ETF and ETP Assets as of the End of June 2021
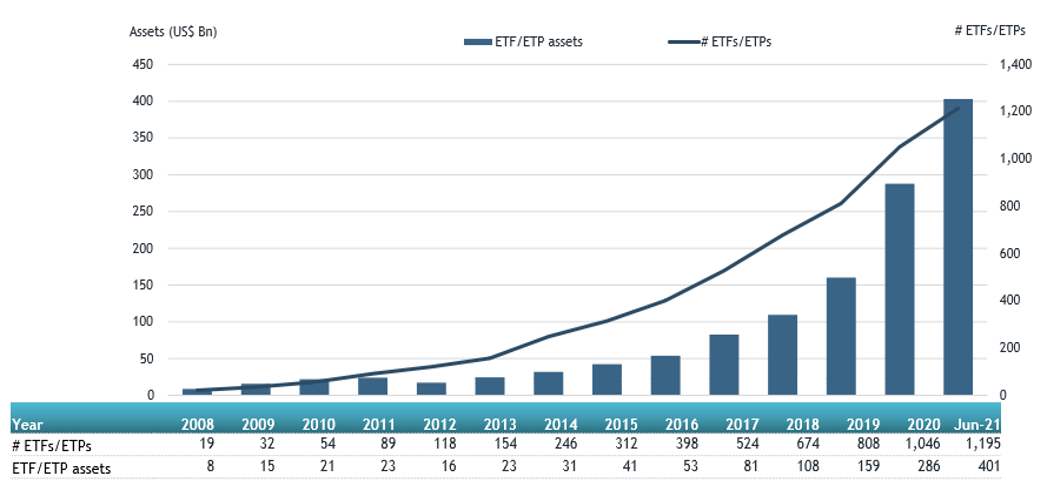
Source: ETFGI data sourced from ETF/ETP sponsors, exchanges, regulatory filings, Thomson Reuters/Lipper, Bloomberg, publicly available sources and data generated in-house. Note: This report is based on the most recent data available at the time of publication. Asset and flow data may change slightly as additional data becomes available.
Equity focused Active ETFs/ETPs listed globally gathered net inflows of $4.08 Bn during June, bringing net inflows for H1 to $37.59 Bn, more than the $10.33 Bn in net inflows equity products had attracted in H1 2020. Fixed Income focused Active ETFs/ETPs listed globally attracted net inflows of $2.80 Bn during June, bringing net inflows for H1 2021 to $35.22 Bn, much greater than the $13.79 Bn in net inflows fixed income products had attracted in H1 2020.
Substantial inflows can be attributed to the top 20 active ETFs/ETPs by net new assets, which collectively gathered $5.61 Bn during June. SPDR Blackstone/GSO Senior Loan ETF (SLRN US) gathered $960 Mn the largest net inflow.
Top 20 Actively Managed ETFs/ETPs by Net New Assets June 2021
| Name | Ticker | Assets (US$ Mn) June-21 | NNA (US$ Mn) YTD-21 | NNA (US$ Mn) June-21 |
|---|---|---|---|---|
| SPDR Blackstone/GSO Senior Loan ETF | SRLN US | 6,295.18 | 3,996.78 | 959.91 |
| ARK Innovation ETF | ARKK US | 25,323.98 | 7,378.78 | 497.21 |
| JPMorgan Ultra-Short Income ETF | JPST US | 17,317.12 | 1,717.39 | 393.02 |
| Quadratic Interest Rate Volatility and Inflation ETF | IVOL US | 3,501.87 | 2,620.30 | 377.53 |
| ARK Genomic Revolution Multi-Sector ETF | ARKG US | 9,747.77 | 2,831.40 | 332.92 |
| First Trust Preferred Securities and Income Fund | FPE US | 7,049.65 | 1,034.27 | 324.73 |
| iShares Commodities Select Strategy ETF | COMT US | 2,464.45 | 2,073.65 | 318.53 |
| JPMorgan Equity Premium Income ETF | JEPI US | 1,889.19 | 1,635.11 | 304.38 |
| Vanguard Ultra Short-Term Bond ETF | VUSB US | 999.1 | 1,011.22 | 300.55 |
| PIMCO US Dollar Short Maturity ETF | MINT LN | 5,292.01 | 967.59 | 235.25 |
| KB KBSTAR Active Korea Total Bond Market A- ETF | 385540 KS | 308.88 | 241.00 | 224.59 |
| BlackRock Ultra Short-Term Bond ETF | ICSH US | 5,643.42 | 406.57 | 212.09 |
| JPMorgan EUR Ultra-Short Income UCITS ETF | JSET LN | 1,315.22 | 504.33 | 173.26 |
| ARK Web x.O ETF | ARKW US | 6,354.09 | 1,175.20 | 159.41 |
| First Trust Senior Loan ETF | FTSL US | 2,327.90 | 997.95 | 148.71 |
| First Trust Global Tactical Commodity Strategy Fund | FTGC US | 1,627.15 | 1,247.00 | 145.33 |
| Avantis U.S. Small Cap Value ETF | AVUV US | 1,398.85 | 629.77 | 143.03 |
| Innovator S&P 500 Power Buffer ETF – June | PJUN US | 201 | 104.42 | 137.78 |
| Horizons Cash Maximizer ETF – Acc | HSAV CN | 858.31 | 38.48 | 111.29 |
| PGIM Ultra Short Bond ETF | PULS US | 1,579.89 | 361.06 | 110.72 |
Source: ETFGI data sourced from ETF/ETP sponsors, exchanges, regulatory filings, Thomson Reuters/Lipper, Bloomberg, publicly available sources and data generated in-house. Note: This report is based on the most recent data available at the time of publication. Asset and flow data may change slightly as additional data becomes available.
Investors have tended to invest in Active Equity ETFs and ETPs during June.
Contact [email protected] if you have any questions or comments on the press release or ETFGI events, research or consulting services.
Contact [email protected] for any questions or corrections.