SoFi Technologies Inc. (NASDAQ: SOFI | SOFI Price Prediction) has been a fintech darling since it came public in late 2020. Just three of 18 analysts who now cover the stock have an Underperform or Sell rating. And the consensus price target of nearly $10 suggests upside in the neighborhood of 33% in the next year. This is despite the share price being down more than 57% since the initial public offering. Note that the S&P 500 is up 14% or so in that time.
The question for current or prospective investors is what happens next. Specifically, here we look at where the share price could be by the end of the decade. We examine where SoFi stands and what Wall Street expects in order to come up with a bull case, a base case and a bear case for where the stock lands by 2030.
SoFi’s Performance
 So how has the company fared since the IPO? Here is a look at its revenue, net income and earnings per share (EPS) for the past three years.
| Year | Revenue | Net Income | EPS |
| 2022 | $1.573 billion | −$320.4 million | −$0.40 |
| 2021 | $984.8 million | −$483.9 million | −$1.00 |
| 2020 | $565.5 million | −$224.0 million | −$2.73 |
For this year, Wall Street is expecting to see SoFi revenue of about $2.02 billion, a year-over-year increase of more than 28%. The consensus EPS estimate is $0.20. SoFi’s recently raised guidance projects revenue near $2.05 billion, and management does expect to report a profit. So the company certainly seems to be headed in the right direction.
However, it has spent a lot to acquire customers and otherwise position itself for growth. Between the end of 2021 and 2022, total debt increased by more than 34% to about $5.62 billion. Free cash flow at the end of 2022 was nearly −$7.36 billion, compared with about −$1.40 billion in the prior year.
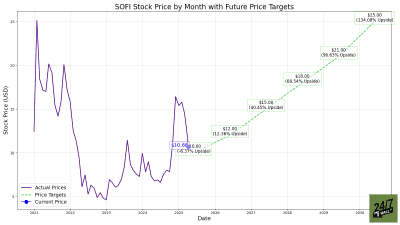
Sofi Technologies shares surged after the IPO to a high of $28.26 but then retreated to a low of $4.24 late last year. The stock bounced this past spring to a year-to-date high of $11.70 a share, but it was last seen trading at less than $7. The 12-month consensus price target is $9.97.
Drivers
 What will drive a turnaround for SoFi? The company is still in a brand-building phase, transitioning itself from student loan company to online bank. CEO Anthony J. Noto said on a recent conference call that SoFi hopes increased bank loyalty will boost its credit card and investing businesses, which are currently losing money.
Its investment arm is similar to Robinhood Markets Inc. (NASDAQ: HOOD), but SoFi is looking to differentiate them. One way is through its technology offerings. SoFi has brokerage and banking software that it has acquired through acquisitions. It aims to provide a customer service bot and fraud detection technology for brokers, banks and other companies that have significant financial operations.
The heavy spending does appear to have paid off. Customer growth is more than 540% since the company went public to nearly 7 million as of the third quarter. While growth has slowed in recent quarters, it remains stable. Growth of its loan portfolio has followed a similar trend.
Another of Noto’s predictions is that SoFi Technologies will become one of the top 10 financial firms in the United States. Its almost $7 million market cap would have to increase by about 680% to approach that of U.S. Bancorp (NYSE: USB), which is low in the top 10. Noto has also said that he wants to deliver investors a “10-bagger,” which is to say a 1,000% gain.
Stock Price Prediction for 2030
 What kind of gain can investors expect in the SoFi Technologies share price for the rest of the decade? How about a 700% gain to $56? Or will it be just a 43% gain to $10? Let’s take a look at a bull case, a base case and a bear case for SoFi stock.
The Bull Case
In this case, the lending environment and consumer sentiment remain strong for the next seven years. SoFi’s student loan, mortgage and IRA businesses thrive. The company continues to grow its customer base, as it increases and diversifies its product offerings, including in cryptocurrency. Money-losing businesses turn profitable, and SoFi grows to resemble the “Amazon of finance” moniker that some supporters have placed on it. That is, it disrupts the banking industry the way Amazon disrupted the retail industry.
In this scenario, SoFi manages a compound annual growth rate (CAGR) of 40% and ends up with a price-to-earnings (PE) ratio of 10 by the end of the decade. That is higher than the big banks but lower than the average of the regional banks. At earnings per share (EPS) of around $5.60, that gives us a share price of $56, which is about double its current post-IPO high.
The Base Case
The base case is more in line with what analysts expect from SoFi in the next few years. In this scenario, customer growth continues to slow and it plateaus. Economic conditions change little, and its lending and investing businesses remain stable. It takes another year or so for the company to become truly profitable, but it manages a 25% CAGR by 2030. A 13 PE would be in line with regional and smaller banks. With earnings at $1.46 per share, the share price is about $19.00.
The Bear Case
What if SoFi continues to struggle to become profitable for the rest of the decade? The customer base begins to shrink, perhaps as more competitors enter the online banking industry. Its student loan business could shrink if forgiveness becomes a trend. Or the economic climate worsens into recession, shrinking its investment business. Or SoFi comes under regulatory scrutiny for its lending practices or because the cryptocurrency market collapses. It’s not hard to imagine, given the debt load, that the company might have to turn its attention to cost-cutting.
But say SoFi still manages a CAGR of 10% for the period. Unfortunately, though, it has a P/E ratio of 18, which puts it more in line with struggling banks. What we see here, then, is EPS of $0.56 and a share price near $10.00 in 2030. That is about what the analysts on average currently expect to see for EPS just a year from now.
Contact [email protected] for any questions or corrections.