
A key component of income investing is a portfolio that includes safe dividends, those that are unlikely to shrink or disappear. Recognizing when a dividend is stable and safe can be a challenge. Yet, certain metrics can offer clear signs for the investor looking to establish or shore up such a portfolio.
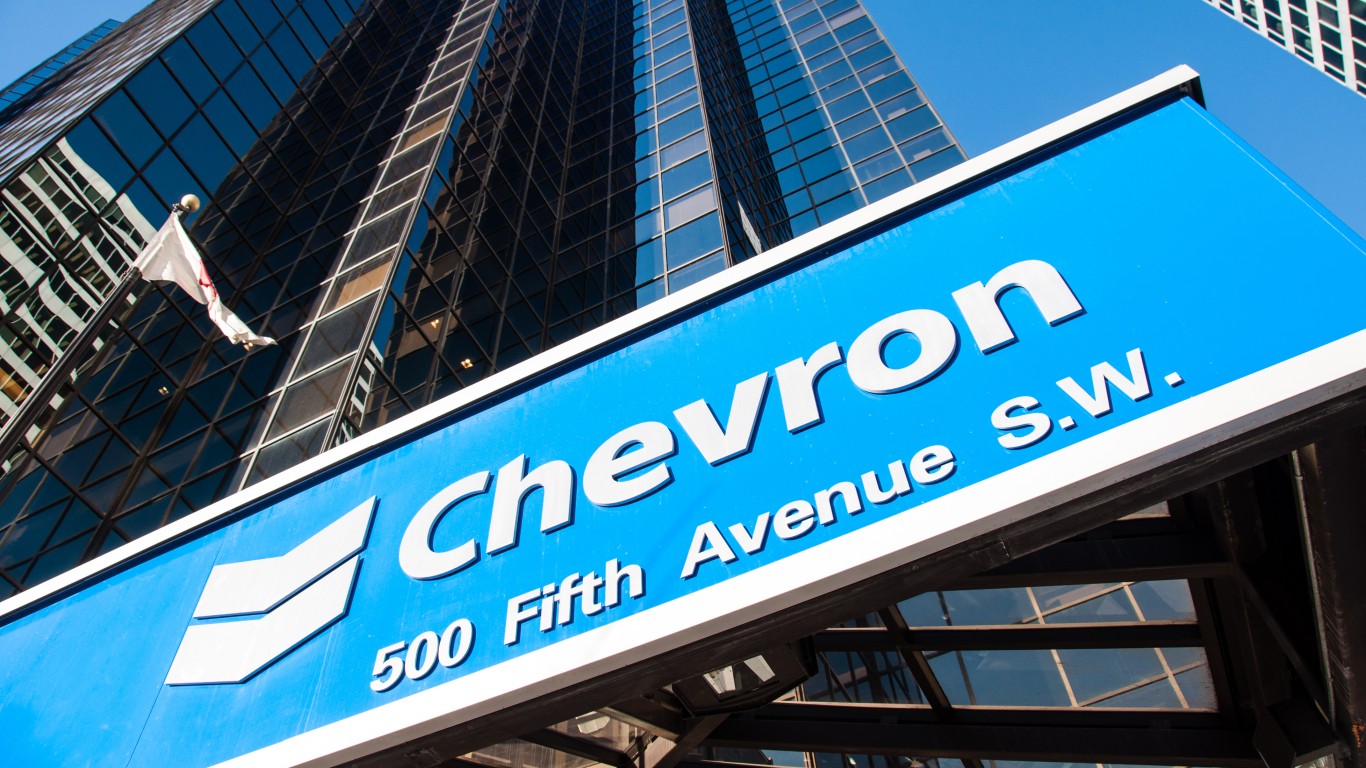
Take the dividend at Chevron Inc. (NYSE: CVX) for instance. The most recent payout was $1.51 a share, and the yield is about 4%. That is higher than those of competitors ConocoPhillips (NYSE: COP) and Exxon Mobil Corp. (NYSE: XOM) but less than that of BP PLC (NYSE: BP). It is also higher than the industry average, which is near 3.5%.
Dividend Aristocrat?

Other Valuation Metrics
The dividend payout ratio indicates how much of a company’s earnings are paid out as a dividend. It is a sign of how safe a company’s dividend is and how much room it has for future growth. The higher the ratio, the greater the risk. Income investors often look for a dividend payout ratio of less than 60%. Compared to that benchmark, Chevron’s dividend payout ratio of less than 45% looks attractive. It is a little higher than the industry average, and more or less in line with Chevron’s average dividend payout ratio over the past decade.
A look at free cash flow reveals whether the company has the funds required for its payout, or for share repurchases or even paying down debt or making acquisitions. As of last September, Chevron’s free cash flow was more than $20 billion for the trailing 12 months, lower than over $37 billion for 2022 and $21 billion for 2021. Income investors prefer growing free cash flows, but for Chevron it is poised to have declined in three of the past five years. And note that for 2013 to 2016 it was in the red.
Return on invested capital is a measure of how well a company allocates its capital to profitable projects or investments. Again, the thing to look for is stability, specifically a double-digit ROIC over many years. Chevron’s ROIC for 2022 was almost 16%. For the five years before that, it was lower though, including a multiyear low of −1.6% in 2020. It was not alone, however, as the story was similar for Exxon Mobil and Shell PLC (NYSE: SHEL).
Operating margin is a measure of the percentage of revenue a company keeps as operating profit. Here too the preference is for a stable double-digit percentage increase. And here too Chevron has seen its operating margin rise and fall, with more down years than up ones since 2013. And again the story is similar for competitors BP and Conoco.
A look at sales growth offers a clue to the volatility or cyclical nature of the business. Steady, moderate growth, say 3% to 7%, is ideal. Chevron is in a cyclical industry and its sales growth shows it, ranging from over 71% to −11% in the past few years.
Probably the most popular valuation metric is the price-to-earnings (PE) ratio. This indicates whether a stock is expensive or cheap at its current market price, compared to the broader market or to competitors. Chevron has a PE ratio of about 11, a little lower than the industry average of almost 12. That also compares with a historical benchmark of 15, as well as the broader market’s current 24 or so. (Why the six highest-yielding Warren Buffett stocks are perfect 2024 investments.)
And finally, the number of shares outstanding is worth a look. When companies buy back their shares, that number shrinks. But secondary offerings of stock increase that number. Investors tend to prefer a declining total, as that increases their stake over time. For Chevron, the number of shares remained fairly steady between 2013 and 2022, between 1.87 billion and 1.93 billion. Chevron does have an ongoing share buyback program. Plus, it is in the process of buying exploration and production company Hess.
Summary
| Dividend Aristocrat | ✔ |
| Dividend payout ratio | ✔ |
| Free cash flow | 🗙 |
| Return on invested capital | 🗙 |
| Operating margin | 🗙 |
| Sales growth | 🗙 |
| PE ratio | ✔ |
| Shares outstanding | ✔ |
Chevron’s status as a Dividend Aristocrat and the history of its dividend payout ratio speak volumes about the safety of its dividend. However, because Chevron is in a cyclical industry, some of the other valuation metrics provide less support. Potential investors interested in income may want to consider this option carefully, and shareholders may want to remain vigilant. For now, Chevron’s prospects appear strong; analysts on average expect almost 20% upside in the share price in the coming year.
Take This Retirement Quiz To Get Matched With An Advisor Now (Sponsored)
Are you ready for retirement? Planning for retirement can be overwhelming, that’s why it could be a good idea to speak to a fiduciary financial advisor about your goals today.
Start by taking this retirement quiz right here from SmartAsset that will match you with up to 3 financial advisors that serve your area and beyond in 5 minutes. Smart Asset is now matching over 50,000 people a month.
Click here now to get started.
Thank you for reading! Have some feedback for us?
Contact the 24/7 Wall St. editorial team.
