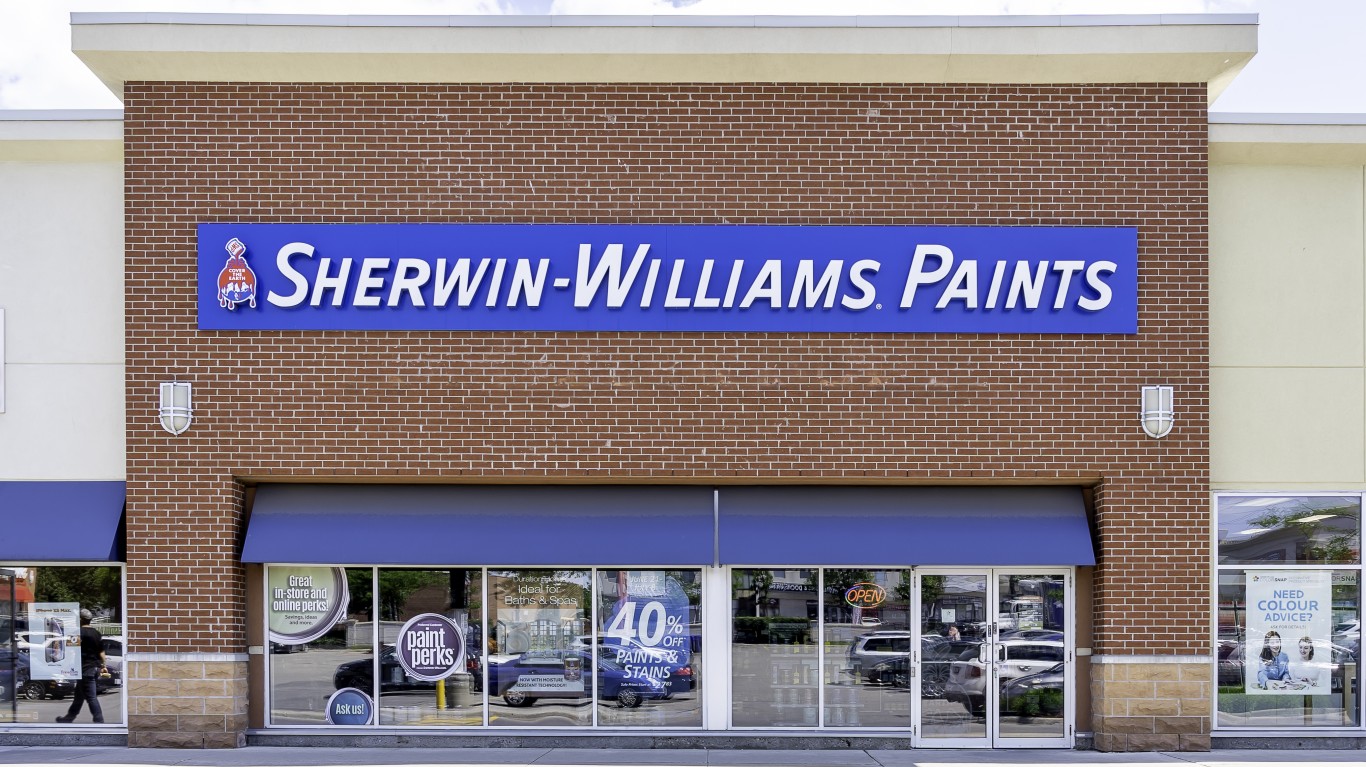

A critical component of income investing is a portfolio that includes safe dividends. That is, those that are unlikely to shrink or disappear. Recognizing when a dividend is stable and safe can be a challenge. Yet, certain metrics can offer clear signs for the investor looking to establish or boost such a portfolio. What do these metrics tell us about the quarterly dividend at Sherwin-Williams Co. (NYSE: SHW)?
The most recent payout from Sherwin-Williams was $0.605 a share, and the yield is now about 0.8%. The next ex-dividend date is expected in late February. The current yield is less than that of such competitors as DuPont de Nemours Inc. (NYSE: DD), Masco Corp. (NYSE: MAS), PPG Industries Inc. (NYSE: PPG), and RPM International Inc. (NYSE: RPM). It is also lower than the industry average of about 1.4%.
Dividend Aristocrat?

One clear sign of whether a dividend is stable and safe is if the company is a Dividend Aristocrat. Those are companies in the S&P 500 that have not only paid a dividend consistently for 25 years but have increased their payouts every year as well. Sherwin-Williams has boosted its dividend annually for 44 years. That means it is only a handful of years away from being a Dividend King. Those are companies whose dividends have risen annually for at least 50 years. (See the seven highest-yielding 2024 Dividend Kings to buy and hold forever.)
Other Valuation Metrics

While being a Dividend Aristocrat is a good sign, other financial metrics provide additional insight.
The dividend payout ratio indicates how much of a company’s earnings it pays out as a dividend. It is a sign of how safe a company’s dividend is and how much room it has for future growth. The higher the ratio, the greater the risk. Income investors often look for a dividend payout ratio of less than 60%. Sherwin-Williams easily hits that mark with a current dividend payout ratio of about 24%. That is lower than the industry average of 40% and the company’s mean dividend payout ratio of 26% over the past decade.
A look at free cash flow reveals whether the company has the funds required for its payout, as well as for share repurchases or even paying down debt or making acquisitions. Income investors prefer growing free cash flows. While the free cash flow at Sherwin-Williams grew from 2016 to 2020, when it was over $3.1 billion, the figure dropped to $1.3 billion afterward.
Return on invested capital is a measure of how well a company allocates its capital to profitable projects or investments. Again, the thing to look for is stability, specifically a double-digit ROIC over many years. At Sherwin-Williams, the current ROIC is about 15%. That percentage has been in the double digits since 2018.
Operating margin is a measure of the percentage of revenue a company keeps as operating profit. Here too the preference is for a stable double-digit percentage increase. The current figure is around 13%. Though it has been in double digits since 2014, the figure has varied from about 11% to almost 16% in that time.
A look at sales growth offers a clue to the volatility or cyclical nature of the business. Steady, moderate growth, say 3% to 7%, is often considered ideal. Revenue at Sherwin-Williams increased every year from almost $7.7 billion in 2010 to more than $22.1 billion in 2022. It is poised to top $23 billion in 2023. That is more steady growth than at any of the competitors mentioned above.
A company’s net debt-to-capital ratio also can signal whether a dividend may be at risk. Because too much debt can put dividends at risk in hard times, a lower ratio is considered better. A debt-to-capital ratio above 0.6 usually means that a business has significantly more debt than equity. The ratio at Sherwin-Williams was last seen at around 0.7. Unfortunately, it has been more than 0.6 in most years since 2015.
Probably the most popular valuation metric is the price-to-earnings (PE) ratio. This indicates whether a stock is expensive or cheap at its current market price, compared to the broader market or to competitors. Sherwin-Williams has a trailing PE ratio of more than 33, which is higher than its median of more than 28 over the past decade, as well as the current industry average of less than 21. Note that the company’s forward PE is less than 28, but that still makes the stock expensive compared with a broad historical benchmark of 15 and the broader market’s current 24 or so. The peers mentioned above all have PE ratios lower than that of Sherwin-Williams. (See which five blue chip dividend stocks make up 75% of Warren Buffett’s portfolio.)
And finally, the number of shares outstanding is worth a look. When companies buy back their shares, that number shrinks. But secondary offerings of stock and stock compensation increase that total. Investors tend to prefer a declining total, as that increases their stake over time. Total Sherwin-Williams shares outstanding have decreased overall since 2010, when it was around 326 million, to more than 255 million. As of the end of 2023, the company had repurchased more than 95.3 million shares, or over a third of the buyback plan announced in October of 2011.
Summary

While its status as a Dividend Aristocrat is encouraging, is there some risk to the Sherwin-Williams dividend?
| Dividend Aristocrat | ✔ |
| Dividend payout ratio | ✔ |
| Free cash flow | 🗙 |
| Return on invested capital | ✔ |
| Operating margin | ✔ |
| Sales growth | ✔ |
| Net debt-to-capital ratio | 🗙 |
| PE ratio | 🗙 |
| Shares outstanding | ✔ |
The dividend payout ratio seems fine, especially with steady revenue growth to support it. However, the free cash flow bears watching. And the high PE ratio suggests the stock could fall at some point. If Sherwin-Williams finds itself in trouble, say if the long-feared recession comes, its debt might become a problem. So, there could be some risk to the dividend in the short term, even if things look solid in the long run and the company is poised to become a Dividend King.
Essential Tips for Investing: Sponsored
A financial advisor can help you understand the advantages and disadvantages of investment properties. Finding a qualified financial advisor doesn’t have to be hard. SmartAsset’s free tool matches you with up to three financial advisors who serve your area, and you can interview your advisor matches at no cost to decide which one is right for you. If you’re ready to find an advisor who can help you achieve your financial goals, get started now.
Investing in real estate can diversify your portfolio. But expanding your horizons may add additional costs. If you’re an investor looking to minimize expenses, consider checking out online brokerages. They often offer low investment fees, helping you maximize your profit.
Thank you for reading! Have some feedback for us?
Contact the 24/7 Wall St. editorial team.


